Transcription
Song et al. BioData Mining (2016) 9:3DOI 10.1186/s13040-016-0082-8SHORT REPORTOpen AccessNetwork-based analysis of genetic variantsassociated with hippocampal volume inAlzheimer’s disease: a study of ADNIcohortsAilin Song1,2,3, Jingwen Yan4,5,6, Sungeun Kim4,5,7, Shannon Leigh Risacher4,7, Aaron K. Wong8, Andrew J. Saykin4,7,Li Shen4,5,6,7, Casey S. Greene1,2,3,9* and for the Alzheimer’s Disease Neuroimaging Initiative* Correspondence:csgreene@upenn.edu1Department of Genetics, GeiselSchool of Medicine at Dartmouth,Hanover, New Hampshire, USA2Dartmouth-Hitchcock NorrisCotton Cancer Center, Lebanon,New Hampshire, USAFull list of author information isavailable at the end of the articleAbstractBackground: Alzheimer’s disease (AD) is a neurodegenerative disease that causesdementia. While molecular basis of AD is not fully understood, genetic factors areexpected to participate in the development and progression of the disease. Ourgoal was to uncover novel genetic underpinnings of Alzheimer’s disease with abioinformatics approach that accounts for tissue specificity.Findings: We performed genome-wide association studies (GWAS) for hippocampalvolume in two Alzheimer’s Disease Neuroimaging Initiative (ADNI) cohorts. We usedthese GWAS in a subsequent tissue-specific network-wide association study (NetWAS),which applied nominally significant associations in the initial GWAS to identify diseaserelevant patterns in a functional network for the hippocampus. We comparedprioritized gene lists from NetWAS and GWAS with literature curated AD-associatedgenes from the Online Mendelian Inheritance in Man (OMIM) database. In the ADNI-1GWAS, where we also observed an enrichment of low p-values, NetWAS prioritizeddisease-gene associations in accordance with OMIM annotations. This was notobserved in the ADNI-2 dataset. We provide source code to replicate these analyses aswell as complete results under permissive licenses.Conclusions: We performed the first analysis of hippocampal volume using NetWAS,which uses machine learning algorithms applied to tissue-specific functional interactionnetwork to prioritize GWAS results. Our findings support the idea that tissue-specificnetworks may provide helpful context for understanding the etiology of commonhuman diseases and reveal challenges that network-based approaches encounterin some datasets. Our source code and intermediate results files can facilitatethe development of methods to address these challenges.FindingsAlzheimer’s disease (AD) is a neurodegenerative disease that affects memory and behavior. Around 70 % of the risk is expected to be attributable to genetics [1]. Includingthe well documented association with the gene APOE, previous studies have identified22 susceptibility loci for late-onset Alzheimer’s disease (LOAD), of which 11 wererecently reported by a large meta-analysis [2]. Most existing genetic analyses lack the 2016 Song et al. Open Access This article is distributed under the terms of the Creative Commons Attribution 4.0 InternationalLicense (http://creativecommons.org/licenses/by/4.0/), which permits unrestricted use, distribution, and reproduction in any medium,provided you give appropriate credit to the original author(s) and the source, provide a link to the Creative Commons license, andindicate if changes were made. The Creative Commons Public Domain Dedication waiver ) applies to the data made available in this article, unless otherwise stated.
Song et al. BioData Mining (2016) 9:3affected tissue context, which is crucial to the precise actions of genes, though someeQTL analyses have begun to address this problem. For example, analysis ofeQTLs in brain samples from control individuals and those with LOAD identifiedvariants associated with changes in gene expression in the brain [3].To identify genes that play a tissue-specific role in disease, we used the recentlydeveloped network-wide association study (NetWAS) method, which takes the tissuespecific functional roles of genes into account, to identify genes associated with differences in hippocampal volume [4]. We applied the NetWAS approach to genome-wideassociation study (GWAS) results from ADNI using hippocampal volume as an endophenotype. NetWAS identifies features in the hippocampus tissue-specific network thatare associated with nominally significant GWAS p-values, and it uses these features toidentify potentially novel AD gene associations. We evaluated the extent to which theNetWAS approach using a hippocampus network could identify AD-associated genesand compared results to the GWAS alone.DataData used in this study were obtained from the Alzheimer’s Disease NeuroimagingInitiative (ADNI) database (adni.loni.usc.edu). The ADNI was launched in 2003 by theNational Institute on Aging (NIA), the National Institute of Biomedical Imaging andBioengineering (NIBIB), the Food and Drug Administration (FDA), private pharmaceuticalcompanies and non-profit organizations, as a 60 million, 5-year public-private partnership.The primary goal of ADNI has been to test whether serial magnetic resonance imaging(MRI), positron emission tomography (PET), other biological markers, and clinical andneuropsychological assessment can be combined to measure the progression of mild cognitive impairment (MCI) and early AD. Determination of sensitive and specific markers ofvery early AD progression is critical to aid researchers and clinicians to develop new treatments and monitor their effectiveness, and to reduce the time and cost of clinical trials.The Principal Investigator of this initiative is Michael W. Weiner, MD, VA MedicalCenter and University of California - San Francisco. ADNI is the result of efforts ofmany co-investigators from a broad range of academic institutions and private corporations, and subjects have been recruited from over 50 sites across the U.S. and Canada.The initial goal of ADNI was to recruit 800 subjects but ADNI has been followed byADNI-GO and ADNI-2. To date these three protocols have recruited over 1,500 adults,ages 55 to 90, to participate in the research, consisting of cognitively normal older individuals, people with early or late MCI (EMCI or LMCI), and people with early AD. Thefollow up duration of each group is specified in the protocols for ADNI-1, ADNI-2 andADNI-GO. Subjects originally recruited for ADNI-1 and ADNI-GO had the option tobe followed in ADNI-2. Thousands of longitudinal imaging scans [5, 6], performanceon neuropsychological and clinical assessments [7] and biological samples [8] werecollected at baseline and at follow-up visits for all or a subset of participants.Genome-wide genotyping data [9] are available on the full ADNI sample. For upto-date information, see www.adni-info.org.Genotype data of all participants from both ADNI-1 and ADNI-2 were downloaded,quality controlled, imputed to the Illumina 610Quad platform and combined, followingthe procedure described in [10]. Freesurfer version 5.1 was used to extract hippocampalvolume and intracranial volume (ICV) measures from the 1.5 T baseline MRI scans ofPage 2 of 8
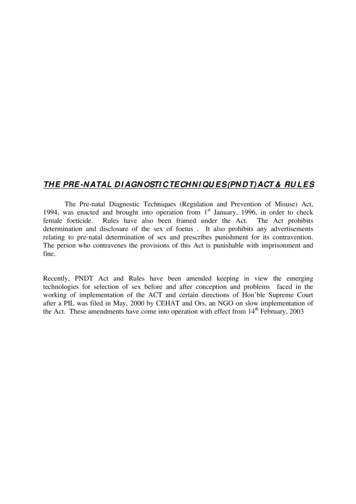
Song et al. BioData Mining (2016) 9:3Page 3 of 8the ADNI-1 participants, and from the 3 T baseline MRI scans of the ADNI-2 participants, as previously described in [11]. Siblings and participants without hippocampal volume were excluded. As a result, we included 748 subjects and 817 subjectsin the ADNI-1 and ADNI-2 analyses, respectively. GWAS analyses were performedby PLINK v1.07 using a linear regression model covaried for age, gender, educationand ICV.The analytic workflowOur analytical workflow was designed to identify genes associated with differences inhippocampal volume. Figure 1 provides an overview of our analytical strategy. To ensure reproducibility, we have used methods that are available from webservers andopen source software packages to ensure accessibility of this analysis for other researchers. Because we performed a large number of NetWAS to evaluate the robustnessof results, the actual analyses were performed on a computing cluster. We provide oursource code and intermediate results under permissive licenses. The goal of phase Iwas to calculate gene-based association p-values based on SNP association p-valuesfrom the hippocampal volume GWAS. The goals of phase II were to reprioritize genebased associations using hippocampus functional network and to assess the concordance of identified disease-gene associations with documented associations.Phase I: gene-level analysisWe applied the versatile gene-based association study (VEGAS) webserver to calculategene-based p-values from individual SNP p-values, described in the data section above,for associations with hippocampal volume endpoint [12]. VEGAS assigns SNPs to individual genes using a window of 50 kb upstream and downstream from the gene sequence and generates a combined test-statistic that accounts for linkage disequilibriumPhase IPhase IIGene-Level AnalysisNetwork AnalysisVEGAS AnalysisNetWASHippocampusNetwork AnalysisROC CurvesDocumentedAD genesROC CurvesDocumentedAD genesGWAS Datafrom TwoADNI StudiesPermuted-NetWASHippocampusNetwork AnalysisFig. 1 An overview of our analysis. In phase I, we mapped SNPs from the GWAS studies to genes andcalculated gene-based p-values from SNP p-values. In phase II, we focused on using hippocampus networkto reprioritize these genes. The efficacy of this approach was assessed with documented associations withAD. NetWAS results from different cohorts were integrated using an average-score approach and assessedfor concordance with documented AD associations
Song et al. BioData Mining (2016) 9:3(LD). The ADNI data we used were restricted to non-Hispanic Caucasian participants[10], so we used the HapMap CEU population for LD. This stage of analysis providedus with gene candidates associated with the hippocampal volume endpoint fromthe GWAS.Phase II: tissue-specific functional network analysisThe gene-based p-values calculated in phase I were used as input for a NetWASanalysis. NetWAS reprioritizes disease-gene associations using a functional network byconstructing a support vector machine classifier using nominally significant genes(p 0.01) as positive examples and non-associated genes as negative examples. Theresulting classifier, which learned patterns in the biological network associated withnominal significance, was then applied back to the network to re-rank genes [4].We performed NetWAS on the DISCOVERY supercomputer at Dartmouth. Toevaluate the stability of predictions and estimate the variance of multiple NetWASruns, we performed 1000 iterations of each analysis with randomly selected crossvalidation intervals. To evaluate potential underlying bias in the method towardsOMIM annotations, we also performed NetWAS on 1000 different GWAS for each cohort in which the associated genes had been permuted. Source code and intermediateand final results for these analyses are provided under permissive open source licenses[13] (code: BSD 3-clause; data: CC0).The ultimate goal of this analysis was to use information about the tissue-specificfunctions and relationships of genes to identify disease-associated genes more effectivelythan GWAS. We mapped OMIM [14] annotations onto the Disease Ontology (DO) [15].To assess the performance of this approach for this phenotype, we used the area under thereceiver-operator characteristic curve (AUC) to compare NetWAS, permuted NetWASand GWAS gene rankings. AUCs were calculated using annotations that were mapped tothe DO term for Alzheimer’s disease (DOID:10652) as gold standard positives.Results and discussionUsing VEGAS, in phase I of the analysis we converted SNP-level association statisticsfrom two different ADNI studies into two sets of gene-level association statistics forthe hippocampal volume phenotype. These statistical associations were reprioritized inphase II using NetWAS analyses that leveraged a functional network for the hippocampus performed across 1000 independent sets of five-fold cross validation. To generatean aggregate list, we summed the ranks for each NetWAS. Tabular complete results foreach of these analyses are available in the source code repository associated with thispaper (ADNI-1 VEGAS: data/vegas adni1.xls; ADNI-2 VEGAS: data/vegas adni2.xls;NetWAS ADNI-1 and ADNI-2: combined-results.csv).The underlying idea of NetWAS is that multiple truly associated genes may exhibitnominal, though not genome-wide, significance, which a machine learning methodcould use to extract phenotype-associated network features. Because NetWAS wasdeveloped to identify network commonalities among nominally associated genes, wegenerated quantile-quantile plots of observed VEGAS gene-wise p-values against auniform distribution. ADNI-1 showed slight inflation, suggesting that this GWASmight represent a good NetWAS candidate (Additional file 1: Figure S1). ADNI-2 didnot show evidence of inflation (Additional file 2: Figure S2).Page 4 of 8
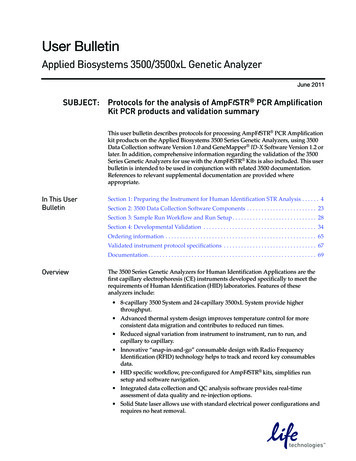
Song et al. BioData Mining (2016) 9:3We compared the GWAS ranked and NetWAS reprioritized genes to genes with adocumented association with Alzheimer’s disease in the OMIM database using theAUC (Fig. 2). Comparing the GWAS against the 95 % confidence intervals, we foundthat the NetWAS ranking more closely matched genes with a documented relationshipto AD than genes identified by the initial VEGAS analysis in the ADNI-1 cohort. In theADNI-2 cohort, this relationship was reversed but less pronounced. In both cases, thescores for the NetWAS performed using the GWAS associations were outside of andabove the 95 % bootstrap confidence intervals for the mean of NetWAS with permutedgene-significance.We noted that in the NetWAS results generated from ADNI-1 GWAS, the top 14genes all belonged to the protocadherin alpha gene cluster (PCDHA). This unusual result had not previously been observed in a NetWAS analysis, so we investigated bothnetwork-based and association-based explanations. Examination of p-values fromVEGAS revealed multiple significant PCDHA genes (PCDHA1-13, PCDHAC1, PCDHAC2).These associations could be driven by the same variants within the overall 50 kb window,Fig. 2 Network reprioritization of AD GWAS identifies AD-associated genes. GWAS ranked and NetWASreprioritized genes are assessed for correspondence to genes known to be associated with Alzheimer’sdisease. We compared ADNI-1 and ADNI-2 to DO-annotated AD genes using AUC. The AUC for NetWAS inADNI-1 was significantly higher than that observed for the GWAS or the permuted NetWAS. The AUCfor NetWAS in ADNI-2 was significantly higher than the permuted NetWAS. Error bars indicate 95 %confidence intervals via bootstrapPage 5 of 8
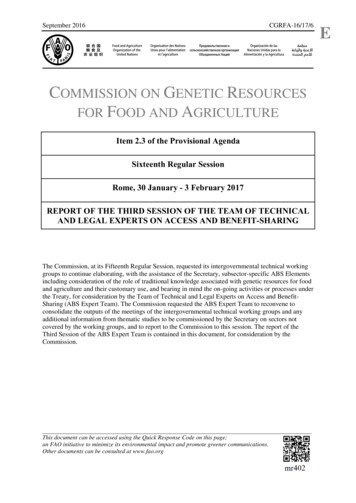
Song et al. BioData Mining (2016) 9:3as the PCDHA gene cluster includes multiple overlapping genes (Fig. 3). In the case thatthese genes are from the same family, as with PCDHA genes, they may also have similarnetwork connectivity patterns, making it difficult for NetWAS to distinguish whether oneor all members of the gene family should be most closely associated with the disease. Themultiple associated genes by VEGAS also make it difficult for NetWAS to successfully distinguish involved members. These properties can, in certain circumstances, make it difficultto pinpoint the principally associated gene. This multiple-mapping problem has previouslybeen reported to have impact on gene-set based analysis [16]. Our analysis demonstratesthat users should also be cognizant of this for network-based approaches. Gene-based association tests that attempt to control for SNPs with potential associations with multiplegenes may be required to address this challenge.While a 50 kb window can lead to multi-gene mapping, it can also fail to capturelong-range interactions between SNPs and genes. For example, SNPs 500 kb from thegene c-MYC were found to directly interact with the promoter of c-MYC, upregulatingthe expression of this gene [17]. Such relationships cannot be captured by existinggene-based association tests without creating additional multiple-mapping challenges.Fig. 3 Significant SNP-wise p-values overlap with the entire PCDHA cluster. The Manhattan plot on the topshows p-values of the SNPs in the PCDHA region. The genome view at the bottom indicates where the genesare located in the genome. The overlap between significant SNPs and all PCDHA genes (PCDHA1-13) potentiallyexplains the significant associations for all genes in this family so that they are largely identified by NetWASPage 6 of 8
Song et al. BioData Mining (2016) 9:3Gene-based association tests that account for potential long-range interactions throughboth haplotype structures and 3D chromosomal organization information would helpto ameliorate this problem.In summary, we have performed the first NetWAS for hippocampal volume, or anyAD-related phenotype, in AD patients and controls using the ADNI-1 and ADNI-2cohorts. In the course of this analysis, we identified the need for new gene-based association tests that aim to solve multiple-mapping challenges for SNP-gene relationships.Additional filesAdditional file 1: Quantile-quantile plot showing the deviation of the distribution of p-values in the ADNI-1dataset from the uniform expected under the null. Some inflation was observed, consistent with gene-phenotypeassociations captured by the GWAS. (PDF 73 kb)Additional file 2: Quantile-quantile plot showing the deviation of the distribution of p-values in the ADNI-2dataset from the uniform expected under the null. We did not observe inflation of p-values for the ADNI-2 dataset.(PDF 77 kb)Competing interestsThe authors declare they have no competing interests.Authors’ contributionsAS, LS, and CSG designed the study. JY, SK, SLR, AJS, and LS analyzed ADNI data and provided association statistics.AS, AKW, and CSG performed VEGAS, NetWAS, and analyzed the results. AS, JY, LS, and CSG created figures andwrote the manuscript. SK, SLR, AKW, and AJS provided critical review of the manuscript.AcknowledgementsWe sincerely thank Dr. Jason Moore for his insights during the conception of this work. We also gratefully acknowledgePeter Andrews, Jonathan Fisher, and Dr. Christian Darabos for their technical support.AS was funded by the Sophomore Science Scholarship Program of Dartmouth College. CSG is supported by theGordon and Betty Moore Foundation’s Data-Driven Discovery Initiative through Grant GBMF4552. Additionally, thework with ADNI was supported by NIH R01 LM010098 and P20 GM103534 at Dartmouth and by NIH R01 LM011360,U01 AG024904, RC2 AG036535, R01 AG19771, P30 AG10133, UL1TR001108, DOD W81XWH-14-2-0151, NCAA 14132004,and NSF IIS-1117335 at IU.Data collection and sharing for this project was funded by the Alzheimer’s Disease Neuroimaging Initiative (ADNI)(National Institutes of Health Grant U01 AG024904) and DOD ADNI (Department of Defense award numberW81XWH-12-2-0012). ADNI is funded by the National Institute on Aging, the National Institute of BiomedicalImaging and Bioengineering, and through generous contributions from the following: Alzheimer’s Association;Alzheimer’s Drug Discovery Foundation; Araclon Biotech; BioClinica, Inc.; Biogen Idec Inc.; Bristol-Myers SquibbCompany; Eisai Inc.; Elan Pharmaceuticals, Inc.; Eli Lilly and Company; EuroImmun; F. Hoffmann-La Roche Ltdand its affiliated company Genentech, Inc.; Fujirebio; GE Healthcare; IXICO Ltd.; Janssen Alzheimer Immunotherapy Research& Development, LLC.; Johnson & Johnson Pharmaceutical Research & Development LLC.; Medpace, Inc.; Merck & Co., Inc.;Meso Scale Diagnostics, LLC.; NeuroRx Research; Neurotrack Technologies; Novartis Pharmaceuticals Corporation; Pfizer Inc.;Piramal Imaging; Servier; Synarc Inc.; and Takeda Pharmaceutical Company. The Canadian Institutes of Health Research isproviding funds to support ADNI clinical sites in Canada. Private sector contributions are facilitated by the Foundation forthe National Institutes of Health (www.fnih.org). The grantee organization is the Northern Alzheimer’s Disease CooperativeStudy at the University of California, San Diego. ADNI data are disseminated by the Laboratory for Neuro Imaging at theUniversity of Southern California.Data used in preparation of this article were obtained from the Alzheimer’s Disease Neuroimaging Initiative (ADNI) database(adni.loni.usc.edu). As such, the investigators within the ADNI contributed to the design and implementation of ADNI and/orprovided data but did not participate in analysis or writing of this report. A complete listing of ADNI investigators can befound at: http://adni.loni.usc.edu/wp-content/uploads/how to apply/ADNI Acknowledgement List.pdf.Author details1Department of Genetics, Geisel School of Medicine at Dartmouth, Hanover, New Hampshire, USA.2Dartmouth-Hitchcock Norris Cotton Cancer Center, Lebanon, New Hampshire, USA. 3Institute for QuantitativeBiomedical Sciences, Dartmouth College, Hanover, New Hampshire, USA. 4Center for Neuroimaging, Department ofRadiology and Imaging Sciences, Indiana University School of Medicine, Indianapolis, Indiana, USA. 5Center forComputational Biology and Bioinformatics, Indiana University School of Medicine, Indianapolis, Indiana, USA. 6School ofInformatics and Computing, Indiana University Indianapolis, Indianapolis, Indiana, USA. 7Indiana Alzheimer DiseaseCenter, Indiana University School of Medicine, Indianapolis, Indiana, USA. 8Simons Center for Data Analysis, SimonsFoundation, New York, NY, USA. 9Department of Systems Pharmacology and Translational Therapeutics, PerelmanSchool of Medicine, University of Pennsylvania, Philadelphia, Pennsylvnia, USA.Received: 7 July 2015 Accepted: 14 January 2016Page 7 of 8
Song et al. BioData Mining (2016) 9:3Page 8 of 8References1. Ballard C, Gauthier S, Corbett A, Brayne C, Aarsland D, Jones E. Alzheimer’s disease. Lancet. 2011;377(9770):1019–31.2. Lambert JC, Ibrahim-Verbaas CA, Harold D, Naj AC, Sims R, Bellenguez C, et al. Meta-analysis of 74,046 individualsidentifies 11 new susceptibility loci for Alzheimer’s disease. Nat Genet. 2013;45(12):1452–8.3. Webster JA, Gibbs JR, Clarke J, Ray M, Zhang W, Holmans P, et al. Genetic control of human brain transcriptexpression in Alzheimer disease. Am J Hum Genet. 2009;84(4):445–58.4. Greene CS, Krishnan A, Wong AK, Ricciotti E, Zelaya RA, Himmelstein DS, et al. Understanding multicellularfunction and disease with human tissue-specific networks. Nat Genet. 2015 Jun;47(6):569-76. doi:10.1038/ng.3259.5. Jack Jr CR, Bernstein MA, Fox NC, Thompson P, Alexander G, Harvey D, et al. The Alzheimer’s DiseaseNeuroimaging Initiative (ADNI): MRI methods. J Magn Reson Imaging. 2008;27(4):685–91.6. Jagust WJ, Bandy D, Chen K, Foster NL, Landau SM, Mathis CA, et al. The Alzheimer’s disease neuroimaginginitiative positron emission tomography core. Alzheimers Dement. 2010;6(3):221–9.7. Petersen RC, Aisen PS, Beckett LA, Donohue MC, Gamst AC, Harvey DJ, et al. Alzheimer’s Disease NeuroimagingInitiative (ADNI): clinical characterization. Neurology. 2010;74(3):201–9.8. Shaw LM, Vanderstichele H, Knapik-Czajka M, Clark CM, Aisen PS, Petersen RC, et al. Cerebrospinal fluid biomarkersignature in Alzheimer’s disease neuroimaging initiative subjects. Ann Neurol. 2009;65(4):403–13.9. Saykin AJ, Shen L, Foroud TM, Potkin SG, Swaminathan S, Kim S, et al. Alzheimer’s disease neuroimaging initiativebiomarkers as quantitative phenotypes: Genetics core aims, progress, and plans. Alzheimers Dement. 2010;6(3):265–73.10. Kim S, Swaminathan S, Inlow M, Risacher SL, Nho K, Shen L, et al. Influence of genetic variation on plasma proteinlevels in older adults using a multi-analyte panel. PLoS One. 2013;8(7):e70269.11. Risacher SL, Kim S, Shen L, Nho K, Foroud T, Green RC, et al. The role of apolipoprotein E (APOE) genotype inearly mild cognitive impairment (E-MCI). Front Aging Neurosci. 2013;5:11.12. Liu JZ, McRae AF, Nyholt DR, Medland SE, Wray NR, Brown KM, et al. A versatile gene-based test for genome-wideassociation studies. Am J Hum Genet. 2010;87(1):139–45.13. Greene CS, Song A, Wong AK. adni-netwas: v1.0. Zenodo. 2016. doi:10.5281/zenodo.44401.14. Hamosh A, Scott AF, Amberger JS, Bocchini CA, McKusick VA. Online Mendelian Inheritance in Man (OMIM), aknowledgebase of human genes and genetic disorders. Nucleic Acids Res. 2005;33(Database issue):D514–7.15. Schriml LM, Arze C, Nadendla S, Chang YW, Mazaitis M, Felix V et al. Disease Ontology: a backbone for diseasesemantic integration. Nucleic Acids Res. 2012;40(Database issue):D940–6.16. Sedeno-Cortes AE, Pavlidis P. Pitfalls in the application of gene-set analysis to genetics studies. Trends Genet.2014;30(12):513–4.17. Wright JB, Brown SJ, Cole MD. Upregulation of c-MYC in cis through a large chromatin loop linked to a cancerrisk-associated single-nucleotide polymorphism in colorectal cancer cells. Mol Cell Biol. 2010;30(6):1411–20.Submit your next manuscript to BioMed Centraland we will help you at every step: We accept pre-submission inquiries Our selector tool helps you to find the most relevant journal We provide round the clock customer support Convenient online submission Thorough peer review Inclusion in PubMed and all major indexing services Maximum visibility for your researchSubmit your manuscript atwww.biomedcentral.com/submit
Network-based analysis of genetic variants associated with hippocampal volume in Alzheimer's disease: a study of ADNI . companies and non-profit organizations, as a 60 million, 5-year public-private partnership. . and to reduce the time and cost of clinical trials. The Principal Investigator of this initiative is Michael W. Weiner, MD .