Transcription
International Journal of Chemical and Biological Engineering 6 2012Oil Refineries Emissions: Source and Impact: AStudy using AERMODAmir. AL-Haddad, Hisham. Ettouney, Samiya. SaqerSeven pollutant concentrations were measured CH4,NMHC, CO, CO2, NO, NO2 and O3. Wind speed, winddirection, temperature, relative humidity and solar radiationwere monitored. Three models were used named as PrincipleComponent regression (PRC), Artificial Neural Network(ANN), and combing of PRC and ANN. The results showedthat combining method improves the forecast accuracy forozone concentration levels in 24 hours period followed byANN and PCR model respectively.Gilham et al. [4] analyzed particulate matter by using x-rayphotoelectron spectroscopy (XPS) to determine the ratio ofelemental carbon to total carbon. All types of particulatematter were considered in this study. Furthermore, results ofXPS method were compared with results from standardmethod. Samples were collected with quartz filter during aperiod of 24 hr on 6 Oct, 2006. It was observed that XPS isbetter to use in determine particles composition while thestandard method will give a good results in studying thechemistry of the particles.Monteiro et al. [5] used the CHIMERE Chemistrytransport model to make air quality assessment for Portugal.Data were applied for one year (2001). The model results werecompared with air quality data from local monitoring stations.It was observed that NO2 concentrations were above the airquality standards in two urban areas due to vehicles emissions.Also, there was exceeding in SO2 concentrations in industrialareas.Abstract—The main objectives of this paper are to measurepollutants concentrations in the oil refinery area in Kuwait over threeperiods during one year, obtain recent emission inventory for thethree refineries of Kuwait, use AERMOD and the emission inventoryto predict pollutants concentrations and distribution, compare modelpredictions against measured data, and perform numericalexperiments to determine conditions at which emission rates and theresulting pollutant dispersion is below maximum allowable limits.Keywords—Emissions, ISCST3 model, Modeling, Pollutants,RefineryI. INTRODUCTIONAnumber of studies have been conducted on air pollutionin Kuwait and around the world. Air quality data wereassessed by Ettouney et al. [1] from two monitoring stations inKuwait named as Al-Jahra and Umm-Alhyman. The data werecovered a period of four years and was analyzed for annualhourly and 1-h maxima. Concentrations of CO, CO2, MHC,NMHC, NOX, SO2, O3, and PM10 were considered. Moreover,meteorological parameters were included. It was concludedthat all data are within the air quality standards except forPM10 due to short rain season. Also, it was observed that theNOX concentrations increase because of increasing inindustrial activities and vehicles.Ettouney et al. [2] estimated the emission inventory of SO2,CO and NOX in Kuwait. The emission sources were powerplants, motor vehicles, oil fields and oil refineries. In addition,pollutants data base for 2003 in Al-Jahra was simulated usingISCST dispersion model. Furthermore, ozone concentrationwas forecasted by using two feed forward artificial neuralnetwork (ANN). The emission inventory showed that themajor sources of SO2, CO and NOX are power plants, motorvehicles and oilfields. Also, the predictions of the ISCSTmodel and the data base were nearly the same for the hourlyaverage but a difference was observed for the hourly maxima.Al-Alawi et al. [3] developed models to predictconcentrations of ozone in Kuwait at lower atmosphere. Thedata was collected in summer. Mobile air pollution laboratorywas located in residential area with high traffic influence.II. MEASUREMENTS AND LOCATIONSAir pollution measurements were taken for sixteen daysover three periods in different areas as shown in Fig.1. Thefirst period was in Fahaheel residential area from 21/12/2010to 5/01/2011. The second period was in Umm Alhymanresidential area from 10/04/2011 to 25/04/2011. The thirdperiod was in Ahmadi residential area from 25/06/2011 to10/07/2011. Mobile laboratory was rented from local companyand used to collect data. Pollutants and meteorologicalparameters were measured at five minutes intervals for 24hours a day. The pollutants were included CO, CO2, SO2, NO,NO2, O3, PM10, H2S, NH3, CH4, NMHC and THC. Therecorded meteorological conditions are relative humidity,wind speed, wind direction, ambient temperature and solarintensity. Details of the measuring instruments can be found in[1].Amir. AL-Haddad is with the Chemical Engineering Department, KuwaitUniversity, Kuwait, PO.Box: 5969, Safat: 13060 (phone: 96524985221;fax: 96524839498; e-mail: amir122@yahoo.com ).Hisham. Ettouney, with the Chemical Engineering Department, KuwaitUniversity, Kuwait (e-mail: ettouney@hotmail.com ).Samiya. Saqer is with the Chemical Engineering Department, KuwaitUniversity, Kuwait (e-mail: eng.samiya@yahoo.com ).162
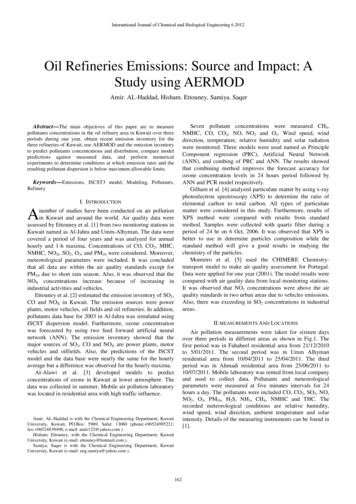
International Journal of Chemical and Biological Engineering 6 2012NortAhmadiFahaheelArabianGulfRefineriesUmm AlhymanFig. 1 Location of the oil refineries and residential areasIII. EMISSION INVENTORYEmission inventory of oil refineries in Kuwait was collectedfor four flares in Ahmadi refinery, two flares in Shuaibarefinery, and six flares in Abdullah refinery during 2007.Data were measured continuously at an interval of 10minutes. The measured data were averaged on monthly basis.Data included SO2, VOCs, NO, CO and CO2.Fig.2: Wind rose graphsIV. ISCST3 MODEL AND PARAMETERSVariations in the particulate matter are shown in Fig.3during the measured periods respectively. The measured dataduring the first period ranged between 20 to 60 µg/m3.Examining wind speed data does not show any stormy oradverse conditions. Therefore, these concentrations werecaused by localized field or site construction. On the otherhand, the measured data during the second and third periodsshow high concentrations of particulate matter ranged between100 to 600 µg/m3. This can be related to wind speed with winddirection in addition to localized field or site constructionIndustrial Source Complex Short Term Model (ISCST3)provides options to model emissions from five basic sources,which include point, volume, area, line and open pit sources.In this paper the (ISCST3) model was used to predict themeasured data of SO2, NO, CO and VOCs. The calculationswere based on the hourly averages of the measured data over a24 hours period per day. The ISCST3 model requiresinformation on source, meteorological data, and receptor [6].V. DATA ANALYSISMeasured data were analyzed over three periods. Fig.2represents wind rose graphs for a period of sixteen days from21/12/2010 to 5/01/2011, 10/04/2011 to 25/04/2011 and25/06/2011 to 10/07/2011 respectively. As shown wind isblowing from North West direction during the first period,from nearly all directions during the second period and fromWest, North West and South West directions during the thirdperiod of measuring data.163
4000100350090Nitrogen Monoxide, ppbParticulate Matter, µg/m3International Journal of Chemical and Biological Engineering 6 200250Hour101520Fig. 4 Variation in measured nitrogen monoxide45004000VI. MEASURED AND PREDICTED DATA3500The contour maps were generated by the ISCST3 model.Examining these figures show that the pollutants distributionpatterns are uniformly distributed and there is strongdependence on the wind direction as illustrated in the windrose graphs. Fig.5 shows contour map of SO2 concentrationfrom 10/04/2011 to 25/04/2011 using emission rates of allrefineries together. As shown, the three residential areas areaffected by Ahmadi, Shuaiba and Abdullah refineries for thecase of simulating the three refineries emissions together. Thisis due to wind direction as discussed which was nearlyblowing from all directions during the second period ofmeasured data. Table I shows predicted concentrations ofSO2, NO, CO and VOCs generated from AERMOD modelduring the three measuring periods for the case of simulatingemissions from Ahmadi, Shuaiba and Abdullah refinery oneby one as well as all the three refineries were 025HourFig. 3 Variation in measured particulate matterThe measured data of nitrogen monoxide (NO) are shown inFig.4. The daily pattern for this pollutant is in the same rangeduring day hours except at early morning and evening. Thereason for this high values is attributed to increase in trafficvolume or heavy use of construction vehicles. This result isconsistent with carbon monoxide data10090Nitrogen Monoxide, ppb25Hour5000Particulate Matter, µg/m3580706050403020Fig. 5 Contour map of SO2 concentration1000510152025Hour164
International Journal of Chemical and Biological Engineering 6 2012TABLE IPREDICTED CONCENTRATIONS OF POLLUTANTS IN THREE RESIDENTIAL AREAS IN KUWAIT DURING THREE PERIODS, PPMReceptorFahaheelPollutantsAhmadi RefineryShuaiba RefineryAbdullah RefineryAll VOCs0.000.00residential area(21/12/2010-5/01/2011)Ahmadiresidential 10-20.758.90x10-11.57x10⁻¹Umm Alhymanresidential area(10/04/2011-25/04/2011)1.52x105.50x10VII. COMPARISON AGAINST EPA STANDARDSVIII. CONCLUSIONTable II shows measured concentrations in Fahaheel, UmmAlhyman and Ahmadi residential areas during measuredperiods. This shows that these areas are affected by othersources of emissions in addition to the oil refineries.Comparing measured concentrations in Fahaheel area duringthe first period of measuring with international standardsgiven by US-EPA illustrates that only CO concentration isbelow EPA limits due to limited number of motors and highambient temperature in Kuwait while SO2 and NOconcentrations are higher than standards. On the other hand, itis shown that SO2, NO and CO measured concentrationsduring second and third periods of collecting data in UmmAlhyman and Ahmadi areas are lower than internationalstandards. However, measured data show that VOCsconcentration is out of the scale in Fahaheel, Umm Alhymanand Ahmadi residential areas which indicates that there areother sources of VOC emissions which should be included inthe next study.This study continues previous efforts on assessment andanalysis of air pollution in Kuwait. Emission inventory wasobtained during 2007 for all flares in the three refineries ofKuwait, Ahmadi, Shuaiba, and Abdullah. Air pollutionmeasurements were made in three residential areas in Kuwait,Fahaheel, Umm Alhyman and Ahmadi. Measured dataincluded pollutants concentrations and meteorologicalparameters. Pollutant dispersion was simulated using theISCST3 of AERMOD. Comparison was made between USEPA standards and measured concentrations of CO, NO, SO2,and VOCs. For the Fhaheel area, the comparison showed thatall pollutants exceeded the international limits, except for CO.This is because of low traffic volume and high ambienttemperature in Kuwait. On the other hand, it is shown thatSO2, NO and CO measured concentrations during second andthird periods of collecting data in Umm Alhyman and Ahmadiareas are lower than international standards. However,measured data show that VOCs concentration is out of thescale in Fahaheel, Umm Alhyman and Ahmadi residentialareas. This is caused by emissions from several small scaleindustrial sites, which are poorly regulated and utilize little orno method of treatment for their emissions.TABLE IIMEASURED CONCENTRATIONS OF POLLUTANTS IN THREE RESIDENTIAL sidential area(21/12/20105/01/2011)Ahmadiresidential 4Umm Alhymanresidential area(10-25/04/2011)ACKNOWLEDGMENTThis research was supported by the Kuwait Universityresearch administration, Project # EC0509, 2010-2012.REFERENCES[1][2]165R. S. Ettouney, J. G. Zaki, M. A. El-Rifai, and H. M. Ettouney, “Anassessment of the air pollution data from two monitoring stations inKuwait,” Toxicological & Environmental Chemistry., vol. 92, Aug.2010, pp. 655–668.R. S. Ettouney, S. Abdul-wahab, and A. S. Elkilani, “Emissionsinventory, iscst, and neural network: modeling of air pollution inKuwait,” International Journal of Environmental Studies., vol. 66, Aug.2009, pp. 181–194.
International Journal of Chemical and Biological Engineering 6 2012[3][4][5][6]S. M. Al-Alawi, S. A. Abdul-Wahab, C. S. Bakheit, “Combiningprincipal component regression and artificial neural networks for moreaccurate predictions of ground-level ozone,” Environmental Modeling &Software., vol. 23, Aug. 2008, pp. 396–403.J. Gilham, et al., “On the applicability of xps for quantitative totalorganic and elemental carbon analysis of airborne particulate matter,”Atmospheric Environment., vol. 42, Aug. 2008, pp. 3888–3891.A. Monteiro, et al, “Air Quality Assessment for Portugal,” Science of theTotal Environment., vol. 373, Aug. 2006, pp. 22–31.C. A. Borrego, and C.A. Brebbia, Air Pollution XV. Belmont,WITPRESS, UK, 2007, pp. 15–113.166
Fig. 1 Location of the oil refineries and residential areas III. EMISSION INVENTORY Emission inventory of oil refineries in Kuwait was collected for four flares in Ahmadi refinery, two flares in Shuaiba refinery, and six flares in Abdullah refinery during 2007. Data were measured continuously at an interval of 10 minutes.
