Transcription
Performance measurement in freighttransport:Its contribution to the design, implementation andmonitoring of public policyPrepared for the Roundtable onLogistics Development Strategies and their Performance Measurements(9-10-March 2015, Queretaro)Alan MCKINNONKuehne Logistics University, Hamburg, GermanyFebruary 2015
TABLE OF CONTENTSINTRODUCTION . 51. FREIGHT TRANSPORT INTENSITY: . 72. FREIGHT MODAL SPLIT: . 92.1 Choice of metric. 92.4 Directness of the routeing: . 102.3 Intermodal freight movements: . 102.4 Contestability of the freight market: . 113. MARKET DIVERSITY: . 114. OPERATIONAL EFFICIENCY . 134.1 Vehicle Loading . 134.2 Fuel Efficiency . 175. SERVICE QUALITY:. 176. ENVIRONMENTAL IMPACT: . 197. CONCLUSION . 20REFERENCES . 213
PERFORMANCE MEASUREMENT IN IN FREIGHT TRANSPORTINTRODUCTIONFreight transport is usually characterised as being the life-blood of a country and vital for itseconomic development, but political acknowledgement of its importance often does not extend as far asthe statistics bureau. As a result, little or no data gets collected to establish the nature and scale of thefreight task and how it is changing. Evidence-based policy-making is clearly impossible within astatistical vacuum, leaving officials to rely on anecdotes, intuition and lessons learned from othercountries. Regrettably, this is the situation in much of the developing world, where the macro-level studyof freight transport has to start from a clean slate.At the other extreme are some developed countries with a long tradition of collecting freight data,where a range of parameters are carefully tracked on the basis of sample sizes that are large enough tomake reasonably accurate assessments of patterns and trends. Even there, however, the statistical base isnever complete. No country collects all the freight data that policy-makers and their analysts require tomodel, let alone understand, the detailed workings of the freight transport system. With the advent of BigData there will potentially be a step-change in the availability of freight data, allowing many of theexisting gaps to be plugged and permitting the macro-level analysis of freight flows and operations at ahigher degree of granularity. This remains to be seen.For many countries, the immediate objective is to collect enough freight data to answer four keypublic policy questions about freight transport:1. How much freight is being moved?The amount of freight movement can be a good barometer of the level of economic activity. Therehas traditionally been a close correlation between freight tonne-kms and GDP, though the ratio of thesevariables can decline as an economy develops and services increase their share of total output. Knowinghow much freight is being moved also indicates the related transport demands for infrastructuralcapacity, fuel, labour and vehicles. It can also shed light on the aggregate level of freight-relatedexternalities.2. Where is the freight going?Knowledge of the spatial pattern of freight flow is critical for infrastructure planning, thedevelopment of regional development strategies and the management of port and airport hinterlands. Inan ideal world, statisticians would be able to track freight consignments across multi-link supply chainsfrom initial origin to final destination, revealing the structure of logistics networks and product routing(McKinnon and Leonardi, 2009). Regrettably, the real world of freight statistics is a long way from thisideal.3. What is the relative use of different transport modes?Few governments are satisfied with the existing freight modal split. Most aim to alter theallocation of freight between modes to relieve congestion on one or more infrastructures, reduce the5
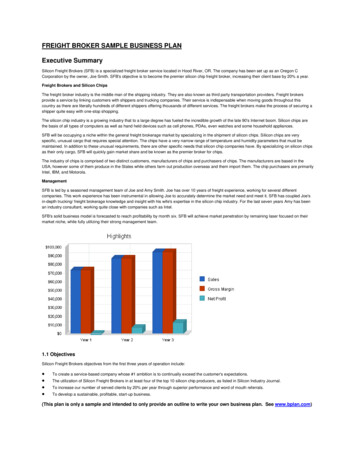
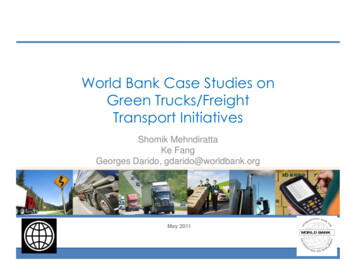
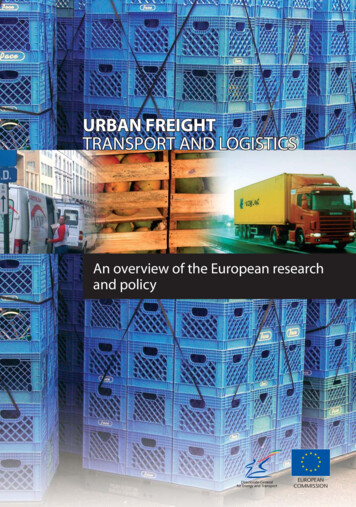
PERFORMANCE MEASUREMENT IN IN FREIGHT TRANSPORTenvironmental impact of freight movement and / or correct what is deemed to be a market failure. In theabsence of freight data disaggregated by mode it is not possible to assess the scale of the problem and thepotential for effecting a modal shift.4. How efficiently is freight being transported?Where freight transport costs are higher as a result of inefficient operation, prices throughout theeconomy are inflated and business competitiveness impaired. Structural processes likely to promoteeconomic development, such as the expansion of market areas and centralisation of production andinventory, are inhibited. Inefficient transport operations also tend to be more environmentally-damaging.So the level of efficiency needs to measured and the main causes of inefficiency identified and corrected.These are the basic questions that need to be answered to start the process of freight policyformulation. The paucity of freight data in many countries suggests that these questions are not evenbeing asked. As the NCFRP (2011: 38) observe, ‘the lack of national freight system programs,performance goals, or targets partially explains the lack of freight system performance data’. The earlystages of policy-making must be underpinned by basic statistical knowledge of the freight transportsystem. One can get into a ‘chicken and egg’ argument over the sequencing of data collection andstrategy formulation thereafter. As policy evolves, as new objectives arise and as a broader range ofpolicy instruments are deployed, causing the freight data requirements multiply. NCFRP (2011) suggestthat one needs ‘clarity regarding strategy and desired outcomes’ before going on to develop ‘metrics togauge the strategy’s effectiveness’.Figure 1 lists some of the main freight transport parameters that are often influenced bygovernment intervention and gives of policy measures that affect them. Evidence-based decision-makingon this range of interventions is inevitably very ‘data hungry’. These data demands expand as freightpolicies are formulated at regional and urban levels by lower tiers of government. Normally regional andmunicipal authorities will be responsible for their own data collection though can benefit from the spatialdisaggregation of national statistics where sample sizes are large enough.At all levels of freight policy-making, the main goal must be to improve the performanceof the freight transport system. The term ‘performance’ can be defined in different ways in thiscontext. In this paper, we will examine six performance criteria, all of which are inter-related1. Transport intensity2. Modal split3. Market diversity4. Operational efficiency5. Service quality6. Environmental impact6
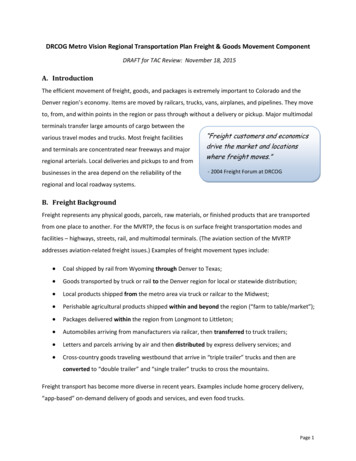
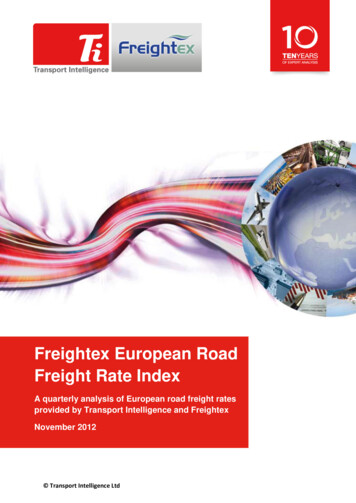
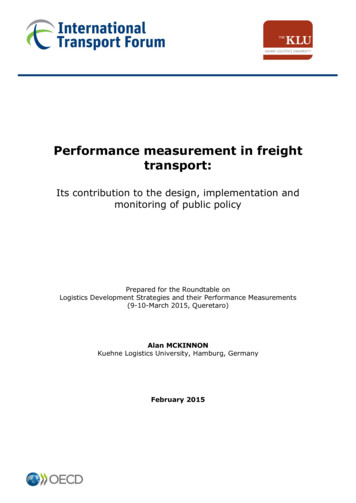
PERFORMANCE MEASUREMENT IN IN FREIGHT TRANSPORTFigure 1. Range of freight transport parameters influenced by government interventionSource: McKinnon, 2015aThe paper will explain why these performance criteria are significant and discuss the indicescommonly used to use to measure them. It will refer to freight policy and data issues in different parts ofthe world though many of the examples of good practice that it cites are drawn from Europe and NorthAmerica.1. FREIGHT TRANSPORT INTENSITYThis is usually defined as the ratio of freight tonne-kms to an economic output measure such asGDP. It is an important indicator of an economy’s dependence on freight transport. Havenga andSimpson (2014) have shown that there are very wide international variations in the amount of GDPgenerated for each tonne-km of freight movement (Figure 1). For example, Norway earns approximatelythirteen times more GDP per tonne-km than South Africa, mainly reflecting differences in the structureof these countries’ economies and the average value density (i.e. per tonne) of the freight. Countries atan earlier stage in their development are usually more dependent on the production and export of lowvalue primary products that have to be moved in large quantities relative to national income. As theydevelop, industrialisation, movement up the global value chain and growth of the service sector tend todepress the level of freight transport intensity. OECD / ITF (2015) indicate how freight intensity is afunction of both per capita income in a country and the service sector share of GDP. It can also beaffected by other factors, however, as illustrated by the diversity of freight intensity trends exhibited byEU member states, even between countries at similar levels of economic development and servicepenetration. Several studies have explored the observed decoupling of GDP and tonne-km trends in7
PERFORMANCE MEASUREMENT IN IN FREIGHT TRANSPORTcountries such as the UK (McKinnon, 2005), Finland (Tapio, 2005) and the Spain (Alises et al,2014).Figure 2. Freight Transport Intensity: amount of GDP generated per tonne-kmSource: Havenga and Simpson, 2014Freight transport intensity is a performance metric that few governments have tried to manipulate.Broader economic policy affects the GDP denominator in the intensity ratio, but governments seldom tryto influence total tonne-kms as an explicit policy objective. The exceptions are those countries for whichlogistics accounts for a large share of GDP. For example, the ‘logistics and supply chain sector’represented around 14% of the UEA’s GDP in 2013 (Geronimo, 2014). Such global logistics hubs have astrong vested interest in maximising tonne-km throughput. At the other extreme, there have been a fewexamples of public policies designed to rationalise the pattern of freight movement and thereby reducetonne-kms relative to economic activity mainly to ease environmental and congestion pressures. TheDutch government, for example, had a ‘transport prevention’ scheme advising companies on wayseconomising on their use of freight transport, while within the EU’s Marco Polo II programmecompanies could receive funding for ‘transport avoidance actions’. This could involve cutting thejourney distance, increasing loads, reducing the number of empty runs or reducing the amount of waste’but not ‘at the expense of jobs or total output’ (European Commission, 2012). As discussed later, mostgovernments’ environmental policies towards freight transport aim to decouple freight-related emissionsrather than tonne-kms from the level of economic activity.Although freight transport intensity is normally measured with respect to GDP, it is not the idealmetric for this purpose. For some types of analysis and policy formulation, it is preferable to have aphysical rather than monetary measure as the denominator in the intensity fraction. The tonne-km, afterall, is a physical measure. In some countries the physical mass of economic inputs and / or outputs aremeasured in weight terms to assess the overall ‘material intensity’ of the economy. For example, Eurostat(2014) publishes domestic material consumption (DMC) statistics measuring ‘the total amount ofmaterials directly used by an economy . defined as the annual quantity of raw materials extracted fromthe domestic territory, plus all physical imports minus all physical exports’.8
PERFORMANCE MEASUREMENT IN IN FREIGHT TRANSPORTIn compiling the tonne-km statistic, national freight surveys estimate the total tonnes-lifted. This anaggregate measure of the amounts of freight loaded onto vehicles at the start of a journey. As each unit offreight is loaded onto vehicles several times as it moves through multi-link supply chains, the tonneslifted statistic is subject to multiple counting. Dividing the tonnes-lifted by a measure of the mass ofgoods in the economy, such as DMC, indicates the degree of multiple counting. The resulting index(known as the ‘handling factor’) can serve as a crude indicator of the average number of links in thesupply chain. There have been several attempts in European countries to conduct this type of analysis(e.g. Fosgerau and Kveiborg, 2004)), though few countries elsewhere in the world compile ‘materialflow accounts’ that would permit similar calculations. Where sufficient data exist, this analysis canreveal the changing structure of supply chains and hence the underlying process of freight traffic growth.2. FREIGHT MODAL SPLITIn most national freight markets, rail, and to a lesser extent waterborne transport, are losing marketshare to road while one of the main freight policy priorities is to arrest and, if possible, reverse this trend.The modal shift to trucks is partly a response to improvements in road infrastructure but also to changesin companies’ logistical requirements which favour road because of its greater speed and flexibility. Incountries, such as India, where this trend is pronounced a process of ‘logistical lock-in’ is underwaywhereby new production and warehousing capacity is gravitating to points of high accessibility in thehighway network often distant from the nearest railway line. Once production and distribution systemsare aligned to the road network, shifting freight back to rail or water can be very difficult. In Europeancountries, where this process is at an advanced stage, a range of freight modal split policy initiativesdeployed over many years have had limited success in winning goods traffic back to rail or water (Savy,2010).The formulation, implementation and monitoring of these policies requires detailed data on theallocation of freight between modes. Superficially this may seem straightforward, but in practice it raisesa series of complicating issues:2.1 Choice of metricMost countries that publish freight modal split data express it in terms of tonne-kilometres (oftenreferred to, quietly misleadingly, as ‘transport performance’) and / or tonnes-lifted. Using the formermeasure gives rail and waterborne transport a higher share as these are essentially long-haul modelswhose comparative advantage over road increases with the length of haul. Targets for altering the modalsplit can also be defined in terms of tonne-kms or tonnes lifted. For example, in a report for the Indiangovernment, McKinsey recommends a target of raising rail’s share of the surface freight market from36% of tonne-km in 2010 to 46% by 2020. The European Commission (2011), on the other hand, in itslast transport White Paper, set a target of getting 30% of freight tonnage moving over distances greaterthan 300 km onto to rail or water by 2030.All weight-based measures of modal split are deficient, however, in the sense that they take noaccount of the average density of the products carried. Rail and waterborne services generally moveheavier primary products, like coal, steel and chemicals, which have a higher average density than themix of products typically transported by road. This means that ‘weight-based measurement of modal splitintrinsically favours modes carrying denser product. If it were expressed in terms of the cubic metres of9
PERFORMANCE MEASUREMENT IN IN FREIGHT TRANSPORTfreight moved, road would account for a significantly larger share of the market’ (McKinnon, 2010: p.7)To our knowledge, no attempts have been made to calculate freight modal split on a volumetric basis.It is, nevertheless, important to bear in mind the differing product density profiles of the freightmodes when considering the feasibility of modal shift targets defined by tonnage or tonne-kms. Much ofthe freight diverted from road would be likely to have a lower density than the average for rail or water.As Woodburn (2007) notes for the UK ‘a coal train operating over the same distance is likely to have atonne kilometres weighting around four or five times that of a premium logistics service. It wouldtherefore be far easier to achieve a target growth volume through new coal flows rather than premiumlogistics ones’ (p.64). He challenges the validity of a weight-based modal split target for rail as it‘appears contrary to the likelihood that the majority of potential rail freight growth will come fromrelatively low weight sectors rather than traditional heavy products’.2.4 Directness of the routeing:Measuring the modal split by tonne-km can also give a distorted view of the freight market becauseof differences in the relative density of the road, rail and waterway networks. As the latter two networksare invariably much less dense that the road network, routeing of the freight flows tends to be less direct.Simply comparing the total length of a country’s road and rail infrastructure can also result in underestimation of differences in the degree of circuity in freight routeing. Sometimes, freight is confined toparticular lines. In the UK, for example, Woodburn (2007) found examples of freight trains travelling 9%further to release capacity for passenger trains on trunk lines and 15% further because of loading gaugeconstraints on particular routes. Wagons may also have to be routed via marshalling yards or traindepots, causing them to deviate further from the more direct route that the freight would normally travelon the road network. For example, in the case of one specimen haul between Rotterdam and Prague, therail distance was 13% longer than the road journey (McKinnon, 2010). This ‘route distance’ bias can becorrected by comparing the lengths of a large sample of hauls between pairs of locations across thedifferent modal networks and deriving a set of scaling factors.2.3 Intermodal freight movements:Where the origins and destinations of freight consignments are not directly connected to the rail orwaterway networks, road feeder movements are required to provide a door-to-door service. Mostgovernment transport statistics do not separately identify these ‘inter-modal’ movements, though thisdata can sometimes be obtained from trade associations representing intermodal operators, such as IURRin Europe. In many European countries and the US, intermodal services are projected to be the mainsource of future railfreight growth providing rail access to traffic moving between non-rail-connectedpremises. Most currently available freight data, however, do not adequately measure the net effect of aswitch from road to intermodal services. This is partly because insufficient allowance is made for theroad feeder traffic, but also because the routeing of freight on an intermodal service is more circuitousthan the direct road movement, generating more tonne-kms. Across a sample of eight trans-Europeanroutes, door-to-door intermodal routes were on average 8% longer than the equivalent direct road journey(McKinnon, 2010). The magnitude of the deviation from the direct route depends on the numbers,locations and catchment areas of the intermodal terminals and can be significant even in regions withrelatively mature intermodal markets. Although greater circuity can partly offset differences cost, energyuse and emissions per tonne-km between road and rail, the net economic and environmental benefits of amodal shift can still be substantial.10
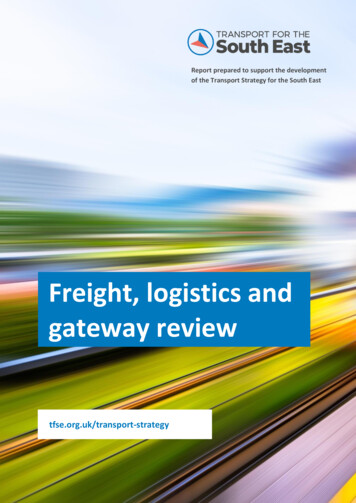
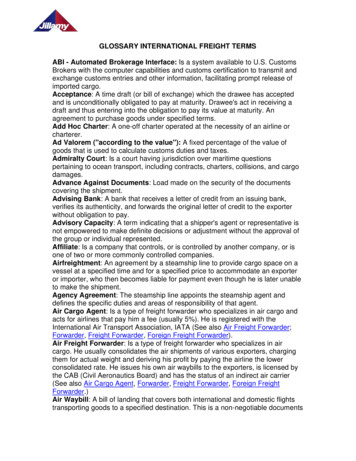
PERFORMANCE MEASUREMENT IN IN FREIGHT TRANSPORT2.4 Contestability of the freight marketStatistical evidence of a large modal imbalance may give the impression that there is huge potentialto switch freight between modes. In practice, however, modes may only compete for a relatively smallproportion of the total freight market. For example, as mentioned earlier, rail and water are generallyonly competitive over longer distances, except where freight volumes are large, regular and movingbetween rail-connected premises. These alternative modes are also ill-suited to low density, high valueproducts moving in variable quantities on a just-in-time basis. Figure uses UK data to illustrate how rail’sshare of the road-rail freight market can vary depending on the definition of the combined market(Department for Transport, 2008a and 2008b). Using a broad definition with all freight moved in truckswith a gross weight in excess of 3.5 tonnes included, rail’s share was only 12%. Within a much morenarrowly-defined market excluding freight not carried in heavier articulated trucks over distances greaterthan 300km rail’s share rose to 42%. To be able to measure the size of the contestable market and henceassess the true potential for freight modal shift, one requires a disaggregation of modal freight data byvariables such as length of haul, commodity type and truck class and weight.Figure 3. Effects of Market Definition on the Road Rail Modal Shift UK 2007% of tonne-kms0%10%20%30%40%50%60%70%80%90% 100%all trucks over 3.5 tonnesroadrailall articulated trucksall articulated trucks with gross weights over 33 tonnesall articulated trucks with gross weights over 33 tonnes haul length 100 kmall articulated trucks with gross weights over 33 tonnes haul length 200 kmall articulated trucks with gross weights over 33 tonnes haul length 300 km3. MARKET DIVERSITYIn the transport economics literature, the structure of national freight markets was traditionallyassessed solely in modal terms, reflecting the deep concern of public policy makers that the modal splitwas unbalanced because of market failures. Viewed from a shipper’s perspective, however, marketstructure is a good deal more complex than the road versus rail debate would suggest. Within eachtransport mode there is a broad range of service offerings. There are now many variants of intermodalservice, combining modes in different ways. Carriers vary in the size and type of consignment theyhandle, the speed with which they deliver and the geographical extent of their coverage. Some operateonly a basic transport service, while others integrate transport within a logistics package comprisingstorage, inventory management, order picking and, possibly, a range of other value-adding services,11
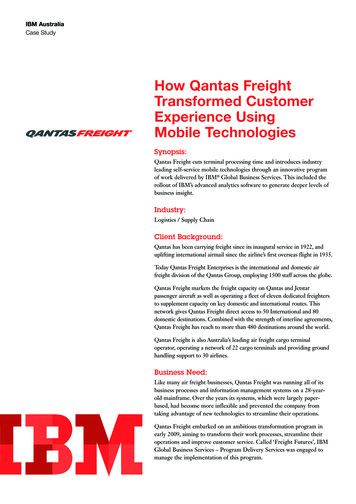
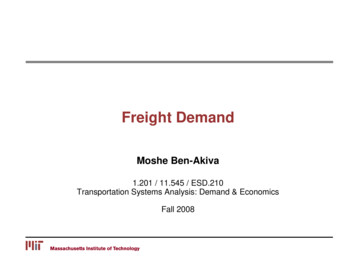
PERFORMANCE MEASUREMENT IN IN FREIGHT TRANSPORTqualifying for the title logistics service provider (LSP). As economies develop, so the spectrum oflogistics services expands to cater for the varying needs of the new types of business that emerge. Annualsurveys of the global third party logistics market have found demand for a broader portfolio of ‘valueadding’ logistics services steadily increasing (Cap Gemini et al, 2015). In a mature logistics market onewould expect to find the range of services shown in Figure 4, differentiated by two criteria, consignmentweight and distance range. Were third and fourth axes to be added to this graph they would be calibratedwith respect to the range of logistics services offered and speed of delivery.Figure 4. Portfolio of freight transport services classified by consignment size and geographical extent.So in judging the logistics capability of a country one must consider the diversity of logisticsservices on offer and the competitiveness of their respective markets. These are factors that affect notonly the performance of other business sectors within the country but also its attractiveness to inwardinvestment, particularly in activities that demand a mix of logistical services.Few countries systematically monitor the state of the national freight / logistics market in themanner described above. Some compile data on the numbers of registered trucking companies and theirfleet sizes, permitting an analysis of the changing degree of market concentration. Depending on thenature of the licensing system, it can also be possible to differentiate companies operating vehicles on anown account as opposed to hire-and-reward basis and to distinguish carriers engaging in domestic and/orcross border work. Such statistics, however, offer very limited insight into the structure and dynamics ofthis complex sector. To gain a deeper insight one normally has to turn to the reports of market researchfirms which scan company annual reports and trade directories to build up a detailed picture of thefreight / logistics market in particular countries and regions, often supplementing their databases withoriginal survey work. Their supply-side view of the market can be compared with the results of thedemand-side surveys of companies regularly buying freight services, of which the Logistics PerformanceIndicator survey is by far the largest and most authoritative (World Bank, 2014).12
PERFORMANCE MEASUREMENT IN IN FREIGHT TRANSPORTAlthough governments tend not to routinely monitor the freight market themselves, relevant data issometimes available from other sources and should certainly be incorporated into the logistics policymaking process, as was done in the UK (Department for Transport, 2010).4. OPERATIONAL EFFICIENCYCentral to most, if not all, government freight transport policies is a desire to improve efficiency.This used to be justified purely on economic grounds, but it is now recognized that it yieldsenvironmental co-benefits and so is considered more sustainable in the ‘green-gold’ sense of the word.Given the importance attached to this policy objective, it is surprising that so little effort is made tocollect the data required to monitor freight transport efficiency at a national level. There is evenuncertainty about the choice of metrics that should be used for this purpose. In this section, we will focuson the efficiency with which vehicle capacity and fuel are used in the freight sector.4.1 Vehicle LoadingIn a seminal paper on performance measurement in logistics, Caplice and Sheffi (1994)distinguished two types of operational measure widely encountered in the freight sector:Productivity: defined as the ratio of outputs (such as tonne-kms or vehicle-kms) to inputs (such asfuel, vehicles or labour). They described this as ‘transformational efficiency’ as it measures theefficiency with which a resource is converted into an activity.Utilisation: the ratio of the capacity actually used to the total capacity available (such as the amount ofspace in a container actually occupied by a load).Both types of efficiency can be measured in several different ways, giving differing impressions ofjust how well a transport operation is performing. For example, tonne-kms per truck per annum is aproductivity index that generally presents the haulage industry in a favourable light, as in the UKbetween the 1953 and the late 1990s (Figure 5). In most countries it has risen steeply in recent decadesbecause trucks have increased in size, weight and power rating, road infrastructure has been upgradedand the move to 24:7 operation has allowed vehicles to be double- or treble-shifted. A similarproductivity trend has been observed among US Class 1 railroads (Figure 6). Higher productivity doesnot necessarily mean, however, that the trucks and wagons are on average running any fuller thanbefore. When the maximum permitted weight of a truck goes up, the average payload weighttypically increases (inflating the productivity index) but not raising it enough to increase the average‘lading factor’ (defined as the actual tonne-kms carried to the maximum that could have been carried ifthe vehicle had been running at maximum weight). Indeed, following increases in the maximum truckweight, lading factors can actually decline as it takes time for companies’ ordering and replenishmentsystems to adjust to the new vehicle weight regulations (McKinnon, 2005). This example demonstratesthe need for a separate set of utilization metrics to show how much of the available carrying capacity invehicles is actually being used.13
PERFORMANCE MEASUREMENT IN IN FREIGHT TRANSPORTFigure 5. Increase in the productivity of UK road freight: 1953-2002400350300Tonne-kms 250per vehicle 99397'01Figure 6. Increase in the productivity of US Class 1 railroads: 1980-2012 ton-miles per locomotive perannumSource: Association of American RailroadsVery few countries routinely collect utilization statistics. EU statistical directives relating to roadfreight make the collection of only one utilization metric mandatory for member states, the % of truckkms run empty (European Commission, 2012). As a result the EU’s statistical agency, Eurostat, has byfar the most comprehensive set of truck empty running statistics in the world, expressed in terms ofdistance travelled and trip numbers and split by type of operator (own account and hire and reward) andbetween domestic and cross-border movements. This European data set reveals wide internationalvariations in empty running ranging from 38% of truck-kms in Greece to 15% in Denmark (Figure 7).No attempts have so far been made to explain these variations or assess their sensitive to differences ingovernment freight transport policy. In the US, the Federal Go
At all levels of freight policy-making, the main goal must be to improve the performance of the freight transport system. The term 'performance' can be defined in different ways in this context. In this paper, we will examine six performance criteria, all of which are inter-related 1. Transport intensity 2. Modal split 3. Market diversity 4.