Transcription
2014 California State Employee Total Compensation ReportWagesBenefitsF2014 California State EmployeeTotal Compensation ReportFor Bargaining Units 1, 2, 3, 4, 7, 11, 13, 14, 15, 16, 17, 18, 19, 20, and 21Published January 12, 2016
2014 California State Employee Total Compensation ReportMessage From the DirectorOffering competitive compensation is crucial to our ability to recruitand retain a highly qualified workforce in state government, and the2014 California State Employee Total Compensation Report reflectsour commitment to better understanding the state’s position in thelabor market. By closely following the model developed by the U.S.Bureau of Labor Statistics (Bureau) and by tapping into its wealth ofdata on wages and benefits, we can now provide policy makers witha consistent method of comparing our compensation practices withother employers in California’s labor market.We selected this path because the Bureau is a well-respected,independent source for labor market information.I would like to express my sincere appreciation to the Bureau,California’s Employment Development Department, the U.S. Officeof Personnel Management, and the State Controller’s Office forproviding us with the data necessary for this report. I would also liketo thank my staff in the Office of Financial Management andEconomic Research for their thoughtful analysis.This is our second Total Compensation Report using the Bureau’smodel for comparing the employer’s costs for employeecompensation. With 15 bargaining units included in this report, wehave now reviewed compensation for the vast majority of the state’srepresented employees using this methodology. Moving forward,we will continue to evaluate and refine how we use this benchmarkdata to compare our total compensation package with otheremployers in California.Richard Gillihan, DirectorDepartment of Human Resources1
2014 California State Employee Total Compensation ReportTable of ContentsExecutive Summary . 3About This Report . 6Changes to Report . 8Comparing Data . 9Authority and Background . 10Mapping of State Jobs . 11About the National Compensation Survey . 12National Compensation Survey Benefit Data . 13Federal Employee Benefit Data. 14About the Occupational Employment Statistics Survey . 15Methodology for Combining Benefit Percentages and Wages . 16Benchmark Selections . 17State Employee Wages . 20Calculating State Employee Benefit Percentages . 21Wages Benefits Total Compensation . 23Bargaining Unit Comparisons . 24Benefit Percentages for Bargaining Units . 25Survey Findings: Total Compensation . 26State Compensation At or Above Market . 27State Compensation Below Market . 29Bargaining Units in Detail . 30Geographic Comparisons . 96Where State Employees Work . 97Comparison with Sacramento Region . 98Sacramento Region (Continued) . 99Comparison with San Francisco Region. 100San Francisco Region (Continued) . 101Comparison with Los Angeles Region . 102Los Angeles Region (Continued) . 103Comparison with San Diego County . 104San Diego County (Continued). 105State Benefits Not Included in Total Compensation . 106Conclusion. 110Glossary of Terms . 111Acknowledgements . 115Office of Financial Management and Economic Research Staff . 116Attachments . 117Endnotes . 1182
2014 California State Employee Total Compensation ReportExecutive SummaryCalifornia’s state government competes for its workforce with localgovernment agencies, as well as with the private sector and thefederal government, which makes it critical that the stateunderstands how its compensation compares with other employers.Making simple wage comparisons, however, provides an incompletepicture. It is analogous to comparing the value of one home toanother, without considering the size or location of the land. That’swhy statutes require the Department of Human Resources(Department) to compare state employee salaries and benefits withpublic and private sector employers.To meet this challenge, the Department turned to the U.S.Department of Labor’s Bureau of Labor Statistics (Bureau), whichproduces two of the nation’s most comprehensive wage and benefitsurveys: the Occupational Employment Statistics (OES) survey andthe National Compensation Survey (NCS).When these surveys are combined with other data, the state’s “totalcompensation” can be compared to that of public and private sectorworkers employed in the same occupations.By using the Bureau’s benchmark data and establishedmethodology for calculating employee costs, the state can nowcompare its compensation practices with other employer groups inCalifornia, and provide valuable insight to current and prospectiveemployees, policy-makers, and the public.Report FindingsThe state’s benefit package has greater impact on totalcompensation when compared with other employers in the labormarket.When comparing median wages only: The state was at or above the market with 20 occupations The state was below the market with 27 occupationsWhen comparing total compensation: The state was at or above the market with 30 occupations The state was below the market with 17 occupations3
2014 California State Employee Total Compensation ReportSummary of Report FindingsTable 1: Occupations Where State Compensation is At/Above or Below Market AverageWAGE ONLYBUAt/AboveMarketAverageOccupation TitleTOTAL eBelowMarketAverage 1Management Analysts 1Accountants and Auditors 1Computer Systems Analysts 1Tax Examiners and Collectors, and Revenue Agents 1Claims Adjusters, Examiners, and Investigators 1Software Developers, Systems Software 1Compensation, Benefits, and Job Analysis Specialists 1Computer Programmers 2Lawyers 2Administrative Law Judges, Adjudicators, and Hearing Officers 3Adult Basic, Secondary Education, Literacy Teachers andInstructors 3Vocational Education Teachers, Postsecondary 4Office Clerks, General 4Court, Municipal, and License Clerks 4Legal Secretaries 7Detectives and Criminal Investigators 7Police, Fire, and Ambulance Dispatchers 7Police and Sheriff's Patrol Officers 7Forensic Science Technicians 11Civil Engineering Technicians 11Forest and Conservation Technicians11Architectural and Civil Drafters 11Medical and Clinical Laboratory Technicians 13Stationary Engineers and Boiler Operators 13Water and Wastewater Treatment Plant and System Operators 4
2014 California State Employee Total Compensation ReportWAGE ONLYAt/AboveMarketAverageTOTAL eBelowMarketAverageBUOccupation Title14Printing Press Operators 14Graphic Designers 15Janitors and Cleaners, Except Maids and HousekeepingCleaners 15Cooks, Institution and Cafeteria 16Psychiatrists 16Family and General Practitioners 16Dentists, General 17Registered Nurses 17Nurse Practitioners 18Psychiatric Technicians 19Clinical, Counseling, and School Psychologists 19Mental Health and Substance Abuse Social Workers 19Rehabilitation Counselors 19Recreational Therapists 19Pharmacists 19Dietitians and Nutritionists 20Licensed Practical and Licensed Vocational Nurses20Nursing Assistants20Dental Assistants20Pharmacy Technicians21Instructional Coordinators21Librarians 5
2014 California State Employee Total Compensation ReportAbout This ReportThe 2014 California State Employee Total Compensation Reportuses salary and benefit data to compare the state’s compensationpractices with three different employer groups: Local Government Private Sector Federal GovernmentMuch of the labor market data in this report was provided by theBureau and the State of California’s Employment DevelopmentDepartment (EDD). Wage and benefit data from two surveysproduced by the Bureau were combined to find the totalcompensation for local government and private sector workers. TheOES survey also provided federal employee wage data, whilefederal employee benefit estimates originated from a CongressionalBudget Office (CBO) report with additional data supplied by the U.S.Office of Personnel Management (OPM).All OES and NCS survey data are calculated by the Bureau.Federal government employee benefit information was estimated bythe CBO. The supplemental pay estimates were provided by OPMfor each occupation. Please refer to the Endnotes for details.State government employee wage and benefit data was provided bythe State Controller’s Office (SCO). The total compensation foreach employer group was calculated by Department staff. The tableon the next page summarizes the sources for wage and benefit datafor each employer group, along with the page number in this reportfor additional details.6
2014 California State Employee Total Compensation ReportTable 2: Major Data Sources for ReportEmployer GroupWagesBenefitsFederal GovernmentOES SurveyCBO & OPM(see pg. 15)(see pg. 14)Local GovernmentPrivate SectorState GovernmentOES SurveyNCS(see pg. 15)(see pg. 12)OES SurveyNCS(see pg. 15)(see pg. 12)SCOSCO(see pg. 20)(see pg. 21)This report compares the state’s compensation costs for itsworkforce in 47 occupations with its primary competitors in the labormarket: local government, large private sector employers (500 ormore employees), and the federal government. We selected theoccupations in this report because state workers employed in theseoccupations are represented in the 15 bargaining units with expiringcontracts in 2016.In addition to making statewide comparisons, this report comparesstate employee total compensation in four geographic regions:Sacramento, San Francisco, Los Angeles, and San Diego.7
2014 California State Employee Total Compensation ReportChanges to ReportWe made a few changes with this year’s report, which arehighlighted in the table below.Table 3: Changes to Report MethodologyItem2013 Report2014 ReportFederalSupplementalPay EstimateAssumed same percentage ofsupplemental pay for federalworkers as state workers.Used annual wage andsupplemental pay data fromthe U.S. Office of PersonnelManagement.MarketDeterminationDetermined the state’sposition in the labor marketbased upon the totalcompensation of two or moreemployer groups.Determined the state’sposition in the labor marketbased upon the “MarketAverage” total compensationof the three employer groups.RegionalComparisonswith PrivateSectorUsed wage and benefit datafrom “all private sector”employers for regionalcomparisons.Used wage and benefit datafrom large private sectoremployers (500 or moreemployees) consistent withstatewide comparisons.Wage EstimatesUsed forOccupationsUsed wage estimates fromthe OES survey, even if theBureau could not produce anestimate of workers for anemployer group.*Used wage estimates fromthe OES survey, only if theBureau could produce anestimate of workers for anemployer group.*The Bureau includes an estimate of wages and number of workers per occupationfor each employer group in the OES survey. However, employment estimates arenot available for some employers in some occupations even when wage estimatesare published. The Bureau withholds these estimates from publication for anumber of reasons, including failure to meet Bureau quality standards or the needto protect the confidentiality of survey respondents.8
2014 California State Employee Total Compensation ReportComparing DataThe intent of this report is to use the best available data to comparethe state’s total compensation costs with other employers inCalifornia.This report does not define the appropriate level of compensationfor state employees.Instead, this report compares how state workers are compensated,as a group, with other workers in the same occupation by measuringthe employer’s costs for providing wages and common employeebenefits.9
2014 California State Employee Total Compensation ReportAuthority and BackgroundAccording to Government Code section 19826(c), when the stateestablishes or adjusts salaries, “consideration shall be given to theprevailing rates for comparable service in other public employmentand in private business,” and the Department must submit itsfindings to the parties meeting and conferring, and to theLegislature. The law requires that the state’s report contains“salaries of employees in comparable occupations in privateindustry and other governmental agencies.” The Budget Act of2015 requires that in addition to salaries the report must includetotal compensation and geographic comparisons.10
2014 California State Employee Total Compensation ReportMapping of State JobsIn 2011, Department staff began mapping more than 3,800 statecivil service classifications to 840 detailed occupations as defined bythe federal government’s Standard Occupational Classification(SOC) system. These occupations are grouped into 23 majorgroups, 97 minor groups, 461 broad occupations, and 840 detailedoccupations.With all of the state’s classifications mapped to the SOC system,employee compensation can be compared with data collected bythe federal government.The mapping used in this report has been reviewed by Bureaueconomists and by the Department’s Personnel ManagementDivision.The table below provides an example of a six-digit SOC code.Table 4: Example of a SOC CodeAccountants and Auditors(13-2011)Major GroupMinor GroupBroad OccupationDetailed Occupation13201111
2014 California State Employee Total Compensation ReportAbout the National Compensation SurveyAccording to the Bureau, the NCS providescomprehensive measures of employeecompensation, compensation cost trends,as well as the degree to which workers haveaccess to — and participate in — employerprovided benefit plans. Bureau fieldeconomists collect and review the surveydata from a national, statisticallyrepresentative sample of private sectorbusinesses, and state and local governmentagencies. Federal government, agricultural,household workers, and workers who areself-employed are not included in thesurvey.The 2014 California State Employee TotalCompensation Report uses data from theECEC, which reports the average totalcompensation on an hourly basis for privatesector, state, and local government workers.The ECEC reports the following employerpaid benefit costs: Supplemental payPaid leaveInsuranceRetirement savingsLegally required benefitsThe Bureau provided the Department withunpublished estimates of annual hoursworked, annual scheduled hours, and hourlywage and benefit costs for private sectorand local government workers separately.This data allowed the Department toannualize these costs and create “benefitpercentages” for each employer group andeach occupation.1 The table belowsummarizes how these percentages werecreated.The NCS data are used in the followingBureau reports: Employment Cost Index (ECI) Employee Benefit Incidence andProvisions Employer Costs for EmployeeCompensation (ECEC)Please refer to the Glossary of Terms,beginning on page 111, for details.Table 5: Calculating the Benefit Percentage From the NCSNCS Wage for MajorOccupational GroupNCS Total Benefitsfor GroupBenefit FormulaBenefit % 40,000 / Year 20,000 / Year( 20,000 / 40,000) 50%50%12
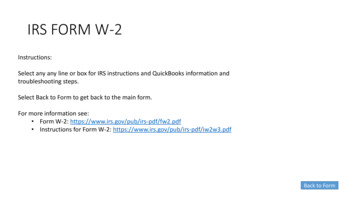
2014 California State Employee Total Compensation ReportNational CompensationSurvey Benefit DataThe Bureau provided the Department with a detailed breakout oftotal compensation costs from the NCS for the Pacific Region2 –with local government and private sector employee data reportedseparately. The map below illustrates the five states in the PacificRegion.13
2014 California State Employee Total Compensation ReportFederal EmployeeBenefit DataThe Bureau collects and reports federal employee wages in theOES survey by detailed occupation. However, because the NCSwage and benefit report is used to set and adjust salaries for thefederal white-collar workers tied to the General Schedule, federalworkers are not included in the NCS.3 To find the percentage ofbenefits to wages for federal workers, we used data from a wellknown CBO report, entitled “Comparing Compensation of Federaland Private Sector Employees.”4 The CBO analysis closelyfollowed the Bureau’s methodology for collecting federal wages andbenefits.5 For its comparison however, the CBO grouped federalworkers by education level rather than occupation. Therefore, weapplied the federal benefit percentages to each occupation basedupon the required education for state jobs in each occupation.Please refer to Appendix D, beginning on D-14, for details.6The author of the CBO report provided the Department withunpublished estimates of annual hours worked for federal workers,which allowed the Department to annualize these benefitpercentages.7 With additional wage and supplemental pay datafrom the OPM, these benefit percentages were revised to produceeven more accurate estimates for each occupation. Please refer tothe Endnotes for details.14
2014 California State Employee Total Compensation ReportAbout the OccupationalEmployment Statistics SurveyAccording to the Bureau, the OES survey is the only comprehensivesource of regularly-produced occupational employment and wagerate information for the U.S. economy. The survey covers all fulltime and part-time wage and salary workers in nonfarm industries.It does not include wages for the self-employed.The OES program is a cooperative effort between the Bureau andState Workforce Agencies (SWA). In California, the EDD is theSWA, and is responsible for collecting local government and privatesector wages. The Bureau collects state and federal employeewage data.All wage data in the survey is categorized into occupations using thefederal SOC system. These occupations typically include entrylevel through journey-level workers, and often first-level supervisors.Some occupations even include managers. Therefore, the OESsurvey represents a wide range of wages for each occupation.The survey is distributed to approximately 97,000 local governmentand private sector employers in California over a three-year period.The Bureau updates any aged survey data using the ECI beforecombining it with current data.The OES data in this report reflects wages in California as of March2014. Private sector wages were filtered for large employers (500or more employees) for all statewide and regional comparisons.15
2014 California State Employee Total Compensation ReportMethodology for Combining BenefitPercentages and WagesHere’s how this works: Multiply the OESannual wage by the benefit percentage tofind the dollar value of benefits, and thenadd this to the annual wage from the OESsurvey. This produces the totalcompensation estimate for workers in theoccupation.Prior to completing this report, the Bureauand the EDD instructed Department staff onhow the data are collected and calculated inthe NCS and OES surveys. This allowedfor a better understanding on how tocombine both surveys for benchmarkingpurposes as well as how to collect andcalculate state employee costs in acomparable manner.Using wage and benefit data in this wayallows an employer to categorize andcompare a wide range of employee benefitsand pay incentives to see how itscompensation compares with otheremployers in the labor market.To find the total compensation for a detailedoccupation, the benefit percentage from theNCS or the CBO report was combined withthe wage data from the correspondingemployer group and detailed occupationreported in the OES survey.Table 6: Estimating the Value of Employee BenefitsOES Annual Wagefor DetailedOccupational GroupBenefit%Multiply Annual Wageby Benefit PercentageAdd OES Annual Wageand Value of BenefitsTotal Compensationfor Occupation 40,000 / Year50%( 40,000 x 50%) 20,000 40,000 20,000 60,000 / Year16
2014 California State Employee Total Compensation ReportBenchmark SelectionsIn previous years, the state published salary surveys using“benchmark classifications” to measure compensation for eachbargaining unit. With the publication of the 2013 California StateEmployee Total Compensation Report, the state took a newapproach, and began comparing “benchmark occupations,”because all Bureau wage and benefit data are reported byoccupation.Government Code section 19826(c) and the Budget Act of 2015requires a total compensation survey be completed at least sixmonths prior to the expiration of a Memorandum of Understanding(MOU) or upon reopening negotiations under an existing one.Therefore, this report includes benchmark occupations from the 15bargaining units with MOU’s expiring by July 2016: BU 1 – Administrative, Financial, and Staff ServicesBU 2 – Attorney and Administrative Law JudgeBU 3 – Professional Educators and LibrariansBU 4 – Office and AlliedBU 7 – Protective ServicesBU 11 – Engineering and Scientific TechniciansBU 13 – Stationary EngineerBU 14 – Printing TradesBU 15 – Allied ServicesBU 16 – Physician, Dentist, and PodiatristBU 17 – Registered NurseBU 18 – Psychiatric TechnicianBU 19 – Health and Social Services/ProfessionalBU 20 – Medical and Social ServicesBU 21 – Education Consultants and LibraryThis report covers 754 rank-and-file and related excludedclassifications associated with the 15 bargaining units listed above.They are mapped to 47 detailed occupations categorized by SOCcode. All classifications mapped to the same benchmarkoccupation are compared, as a group, to the wage and benefit datafor the corresponding occupation. This allows the Department tocompare the state’s costs for employee wages and benefits at an17
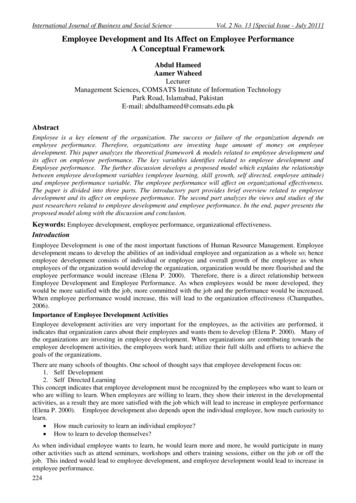
2014 California State Employee Total Compensation Reportoccupational level because the OES and NCS surveys include allworkers in an occupation – from entry-level through journey-level,and in many occupations, related supervisors. Where occupationsdid not include first-level supervisors, state wage and benefit datafor rank-and-file employees were collected and comparedseparately. Please refer to Appendix B for details on the specificclassifications in each occupation.The benchmark occupations used in this report were selected usingthe following criteria: State classifications have consistent duties and qualificationswith the SOC definition State classifications in the occupation represent a significantportion of the bargaining unitApproximately 89,000 full-time state employees are represented inthe 47 occupations included in this report. Chart 1 on the next pageillustrates the percentage of employees associated with eachbargaining unit in this report.18
2014 California State Employee Total Compensation ReportChart 1: Percent of Full-Time State Employees AssociatedWith Each Bargaining Unit Included in This ReportBU 170.8%BU 296.6%BU 360.9%BU 4BU 777.0%53.5%BU 1165.5%BU 13BU 14BU 1596.5%59.8%54.3%BU 1679.3%BU 1790.6%BU 1898.2%BU 1977.5%BU 2084.6%BU 2169.5%For Bargaining Units 4, 13, and 15 only rank-and-file employees are included, because the occupations associated with these unitsdo not include supervisors. For all other bargaining units, related-excluded employees are included in the calculation of thepercentage of employees associated with the bargaining unit.19
2014 California State Employee Total Compensation ReportState Employee WagesThis report uses OES monthly wages for full-time workers as ofMarch 2014. To remain consistent, full-time state employee wagedata was collected for the same month, and the median state wagefor each occupation was compared with the median wage from theOES survey. (The median is the number in the middle of a group.For example, if there are five wages listed in descending order, thenthe third salary would be the median wage.) To do this, all salariespaid to state workers associated with the same bargaining unit andmapped to the same occupation were collected for eachclassification. The average “wage-related” pay differentials for eachclassification were collected and then added to the base salary paidto each state employee to calculate the wage per employee. Themedian state wage was then identified for each occupation.The OES survey instrument has a wage cap. Any wage above 187,200 annually is recorded as greater than that amount( 187,200). For workers in three occupations associated with Unit2 (Lawyers) and 16 (Family and General Practitioners, andPsychiatrists), this was the reported median wage, which makes itdifficult to compare with the state’s median wage. However, theBureau produces a mean wage estimate for these occupations fromother sources. Therefore, in addition to providing median wagecomparisons (in blue) throughout this report, the report also makesseparate mean wage comparisons (in green) for these threeoccupations.8Please refer to Appendix A for additional details on state employeeand labor market wages.20
2014 California State Employee Total Compensation ReportCalculating State EmployeeBenefit PercentagesTo calculate the percentage of benefits to wages for state workers,the Department closely followed the methodology used by theBureau for the NCS.The benefits listed below are included in the NCS, which measuresthe employer’s average costs for wages and benefits. The state’scosts were collected from data provided by SCO for each bargainingunit separately, and then divided by the count of full-time employeesto find an average annual benefit cost per employee. The averageannual benefit cost was then divided by the average annual wagefor that bargaining unit to find a “benefit percentage.” Please referto the Glossary of Terms, beginning on page 111, for detaileddefinitions.Wages: The average base pay for each bargaining unit wascollected. An average of the qualifying pay differentials wascalculated, and then added to the average base pay to arrive at theaverage wage for each bargaining unit.BenefitsSupplemental Pay: This includes the employer’s costs for overtimepay, shift differentials (holiday shifts, weekend shifts, non-regularshift pay differentials), and the remainder of premium pays that arenot included in the wage.This also includes the following Non-Production Bonuses: Merit Award Program (Employee Suggestion Award,Employee Recognition Award, and 25-Year Service Award) Informal time off (ITO) Flex Elect, cash in-lieu of benefits Recruitment and Retention bonuses Longevity bonuses21
2014 California State Employee Total Compensation ReportPaid Leave: To find the employer’s cost for paid leave, allvacation/annual leave, holidays, and personal development daysaccrued are assumed used and totaled. All sick leave used is thenadded to the total. This number is then multiplied by an hourly ratefor paid leave.Insurance: This includes the employer contribution for lifeinsurance,9 health insurance or consolidated benefits (CoBen),dental insurance, vision insurance, short-term disability insurance,long-term disability insurance, and administrative fees paid by thestate for each plan.Retirement and Savings: This includes the employer contributiontowards retirement plans administered by the California PublicEmployees' Retirement System (CalPERS).Legally Required Benefits: This includes the employer costs forSocial Security, Medicare, state and federal unemploymentinsurance, and workers’ compensation.22
2014 California State Employee Total Compensation ReportWages Benefits Total CompensationWhen the value of employ
Bureau of Labor Statistics (Bureau) and by tapping into its wealth of data on wages and benefits, we can now provide policy makers with a consistent method of comparing our compensation practices with . (SOC) system. These occupations are grouped into 23 major groups, 97 minor groups, 461 broad occupations, and 840 detailed occupations.