Transcription
Formal Scenario-Based Testing of AutonomousVehicles:From Simulation to the Real WorldDaniel J. Fremont1,4 , Edward Kim1 , Yash Vardhan Pant1 , Sanjit A. Seshia1 ,Atul Acharya2 , Xantha Bruso2 , Paul Wells2 , Steve Lemke3 , Qiang Lu3 , Shalin Mehta3 ¶§‡†AbstractWe present a new approach to automated scenario-based testing of the safety ofautonomous vehicles, especially those using advanced artificial intelligence-basedcomponents, spanning both simulation-based evaluation as well as testing in thereal world. Our approach is based on formal methods, combining formal specification of scenarios and safety properties, algorithmic test case generation usingformal simulation, test case selection for track testing, executing test cases onthe track, and analyzing the resulting data. Experiments with a real autonomousvehicle at an industrial testing ground support our hypotheses that (i) formal simulation can be effective at identifying test cases to run on the track, and (ii) the gapbetween simulated and real worlds can be systematically evaluated and bridged.1IntroductionA defining characteristic of the growth in autonomous vehicles (AVs) and automated driving systems(ADS) is the expanding use of machine learning (ML) and other artificial intelligence (AI) basedcomponents in them. ML components, such as deep neural networks (DNNs), have proved to befairly effective at perceptual tasks, such as object detection, classification, and image segmentation,as well as for prediction of agent behaviors. However, it is known that ML components can be easilyfooled by so-called adversarial examples, and there have also been well-documented failures of AVsin the real world for which the evidence points to a failure (in part) of ML-based perception. Thereis therefore a pressing need for better techniques for testing and verification of ML/AI-based ADSand AVs.Simulation is regarded as an important tool in the design and testing of AVs with ML components.Several photorealistic 3D simulators are now available for AVs, providing designers with the abilityto simulate “billions of miles” so as to test their AV components, cover corner-case scenarios thatare hard to test in the real world, and diagnose issues that crop up in real-world testing, such asdisengagements. However, some key questions remain. How well does simulation match the realworld? What is the value of simulation vis-a-vis testing on roads in an environment that includesother vehicles, pedestrians, and other road users?An intermediate step between simulation and testing on public roads is track testing. This formof testing involves driving the AV on roads in a test facility with a reasonable degree of control 1University of California, BerkeleyAmerican Automobile Association (AAA) of Northern California, Nevada & Utah (NCNU)‡3LG Electronics America R&D Lab§4University of California, Santa Cruz¶This work has been supported in part by the National Science Foundation Graduate Research Fellowship Program under Grant No. DGE-1752814, NSF grants CNS-1545126 (VeHICaL), CNS-1646208, andCNS-1837132, the DARPA Assured Autonomy program, the Collaborative Sciences Center for Road Safety(CSCRS) under Grant No. 69A3551747113, Berkeley Deep Drive, and Toyota through the iCyPhy center.†2
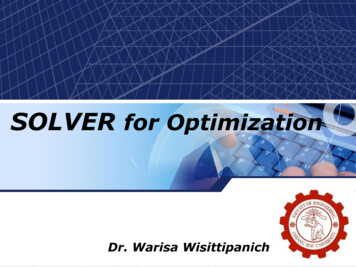
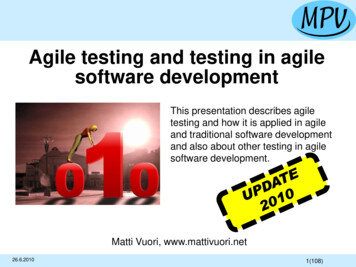
Figure 1: The Autonomous Vehicle (AV) and pedestrian dummy used for track testing. The pictureshows the AV hitting the pedestrian during testing (test F1 Run 1, https://youtu.be/PehgLCGHF5U),see Section 5 for details.over the other agents around the AV, including, for example, pedestrian dummies and inflatablecars to use for crash testing. Track testing allows one to run the actual AV with its real hardwareand software systems in environments that can be designed to mimic certain challenging drivingconditions. However, track testing can be very expensive, labor-intensive, and time-consuming toset up. Given these challenges, which tests should one run? For testing AVs with complex MLbased components, it is crucial to be able to run the tests that will prove most effective at identifyingfailures or strange behavior, uncovering bugs, and increasing assurance in the safety of the AV andADS.This paper takes a step towards addressing these problems by investigating the following two questions:1. Can formal simulation aid in designing effective road tests for AVs? By formal simulation wemean simulation-based testing that is guided by the use of formal models of test scenarios andformal specification of safety properties and metrics. More specifically, do unsafe (safe) runs insimulation produce unsafe (safe) runs on the track? How should one select tests from simulationto run on the track?2. How well can simulation match track testing of AVs? We aim to quantitatively and qualitativelycompare simulation and track testing data, for a test scenario that has been formally specified andimplemented in both simulation and track testing.Our approach is rooted in formal methods, a field centered on the use of mathematical models ofsystems and their requirements backed by computational techniques for their design and verification. In particular, we use a formal probabilistic programming language, S CENIC (1), to specifya test scenario, encapsulating key behaviors and parameters of the AV and its environment. Additionally, we use formal specification languages, such as Metric Temporal Logic (2), to specifysafety properties for AVs. We combine formally-specified scenario descriptions and requirementswith algorithms for simulation-based verification of AVs, also known as falsification, implementedin an open-source toolkit called V ERIFAI (3). These methods, when combined with an advancedphotorealistic full-stack simulator for AVs, the LGSVL Simulator (4), allow us to identify safe andunsafe behaviors of the AV in simulation. We seek to answer the above questions by incorporatinginto the simulator a “digital twin” of an industrial-scale test track, the GoMentum test facility inConcord, California (5). We have developed and deployed a simulation-to-test-track flow whereformal simulation is used to identify test cases to execute on the track, and these test cases aresystematically mapped onto hardware that is used to control agents on the track in the AV’s environment. We present the results of executing this flow on a scenario involving a pedestrian crossingand AV, providing evidence for the effectiveness of formal simulation for identifying track tests, aswell as a quantitative mechanism for comparing simulation results with those obtained on the track.Specifically, our results indicate that:1. Our formal simulation-based approach is effective at synthesizing test cases that transfer well tothe track: 62.5% of unsafe test cases indeed resulted in unsafe behavior on the track, includinga collision, while 93.3% of safe test cases resulted in safe behavior on the track (and no colli-
sions). Our results also shed light on potential causes for AV failure in perception, prediction,and planning.2. While AV and pedestrian trajectories obtained in simulation and real-world testing for the sametest were qualitatively similar (e.g., see Fig 6), we also noted significant differences as quantifiedusing time-series metrics (6; 7) and with metrics such as minimum distance between the AVand pedestrian. Variations exist even amongst simulations of the same test case due to nondeterministic behavior of the AV stack, although these are smaller.Related WorkScenario-based testing of AVs is a well-studied area. One approach is to construct tests from scenarios created from crash data analysis ((8; 9)) and naturalistic driving data (NDD) analysis ((10; 11)),which leverage human driving data to generate test scenarios. Similarly, the PEGASUS project (12)focuses on (i) bench-marking human driving performance using a comprehensive dataset comprisingcrash reports, NDD, etc., and (ii) characterizing the requirements that AVs should satisfy to ensurethe traffic quality is at least unaffected by their presence. Our work differs from these in the use offormal methods for specifying scenarios and safety properties, as well as in automated synthesis oftest cases.Our use of a scenario specification language, S CENIC (1), is related to other work on scenario description languages. OpenSCENARIO (13) defines a file format for the description of the dynamiccontent of driving and traffic simulators, based on the extensible markup language (XML). GeoScenario (14) is a somewhat higher-level domain specific language (DSL) for scenario representation,whose syntax also looks like XML. S CENIC is a flexible high-level language that is complementaryto these. The Measurable Scenario Description Language (M-SDL) (15) is a recent higher-level DSLsimilar to S CENIC, which precedes its definition; while M-SDL is more specialized for AV testing,it has less support than S CENIC for probabilistic and geometric modeling and is not supported byopen-source back-end tools for verification, debugging, and synthesis of autonomous AI/ML basedsystems, unlike S CENIC which is complemented by the open-source V ERIFAI toolkit (3).Recent work on the test scenario library generation (TSLG) problem ((16; 17)) mathematically describes a scenario, defines a relevant metric, and generates a test scenario library. A critical step inTSLG is to construct a surrogate model of an autonomous vehicle. The authors construct this basedon human driving data, which, while useful, may not capture the subtleties in complex ML/AI-basedautonomous vehicle stacks. Additionally, the work presents only simulation results, whereas our paper reports on both simulation and track testing with a real AV. Abbas et al. (18) present a test harnessfor testing an AV’s perception and control stack in a simulated environment and searching for unsafe scenarios. However, in the absence of a formal scenario description language, representing anoperational design domain (ODD) becomes tedious manual labor and challenging as the number oftraffic participants scales up.Researchers have considered the gap between simulation and road/track testing. A methodology fortesting AVs in a closed track, as well as in simulation and mixed-reality settings, is explored in (19).The main aim there is to evaluate the AV’s performance across the different settings using standardtests (20), rather than use computational techniques to generate tests based on formally-specifiedscenarios and outcomes, as we aim to do. A recent SAE EDGE research report (21) dives deeperinto unsettled issues in determining appropriate modeling fidelity for automated driving systems.While it raises important questions, it does not address formal methods for evaluation as we do.In summary, to the best of our knowledge, this paper is the first to apply a formal methods-basedapproach to evaluating the safety of ML-based autonomous vehicles employing formal specificationof scenarios and safety properties, formal simulation-based test generation and selection for tracktesting, as well as evaluation of the methodology in both simulation and the real world, includingsystematically measuring the gap between simulation and track testing.22.1BackgroundS CENIC: A Scenario Specification LanguageS CENIC (1) is a domain-specific probabilistic programming language for modeling the environmentsof cyber-physical systems. A S CENIC program defines a distribution over scenes, configurations ofobjects and agents; a program describing “bumper-to-bumper traffic” might specify a particular distribution for the distance between cars, while letting the location of the scene be uniformly random
over all 3-lane roads in a city. S CENIC provides convenient syntax for geometry, along with declarative constraints, which together make it possible to define such complex scenarios in a concise,readable way. S CENIC has a variety of applications to the design of ML-based systems: for example, one can write a S CENIC program describing a rare traffic scenario like a disabled car blockingthe road, then sample from it to generate specialized training data to augment an existing dataset (1).More generally, the formal semantics of the language allow it to be used as a precisely-defined modelof the environment of a system, as we will see in Sec. 4.2.2.2The V ERIFAI ToolkitThe V ERIFAI toolkit (3) provides a unified framework for the design and analysis of AI- and MLbased cyber-physical systems, based on a simple paradigm: simulations driven by formal modelsand specifications. In V ERIFAI, we first parametrize the space of environments and system configurations of interest, either by explicitly defining parameter ranges or using the S CENIC languagedescribed above. V ERIFAI then generates concrete tests by searching this space, using a varietyof algorithms ranging from simple random sampling to global optimization techniques. Each testresults in a simulation run, where the satisfaction or violation of a system-level specification ischecked; the results of each test are used to guide further search, and any violations are recorded in atable for further analysis. This architecture enables a wide range of use cases, including falsification,fuzz testing, debugging, data augmentation, and parameter synthesis, demonstrated in (3; 22).2.3The LGSVL SimulatorThe LGSVL Simulator (4) is an open-source autonomous driving simulator used to facilitate thedevelopment and testing of autonomous driving software systems. With support for the Robot Operating System (ROS, ROS2), and alternatives such as CyberRT, the simulator can be used withpopular open source autonomous platforms like Apollo (from Baidu) and Autoware (from the Autoware Foundation). Thus, it allows one to simulate an entire autonomous vehicle with full sensorsuite in a safe, deterministic (assuming determinism in AV software stack behavior), and realistic3D environment. The LGSVL Simulator provides simultaneous real-time outputs from multiplesensors including cameras, GPU-accelerated LiDAR, RADAR, GPS, and IMU. Environmental parameters can be changed including map, weather, time of day, traffic and pedestrians, and the entiresimulation can be controlled through a Python API. The LGSVL Simulator (4) is available free andopen-source on GitHub (https://github.com/lgsvl/simulator).2.4GoMentum Testing GroundsGoMentum Station (GoMentum) (5) is the largest secure AV test site in the United States. Locatedin Concord, CA, 35 miles from San Francisco and 60 miles from Silicon Valley, GoMentum features 19 miles of roadways, 48 intersections, and 8 distinct testing zones over 2,100 acres, with avariety of natural and constructed features. Vehicle manufacturers, AV system developers and otherentities have been testing connected and automated vehicles at GoMentum since 2014. Our experiments were conducted in the “urban” or “downtown” zone of GoMentum, which features mostlyflat surface streets that are approximately 20 feet wide and several signed, unsigned, and signalizedintersections amid an urban and suburban landscape with buildings, trees, and other natural andhuman-made features. Speeds are restricted to under 30 mph. The roads feature clear and visiblelane markings on freshly paved roads. The traffic signs include one-way, stop, yield, and speedlimits.3MethodologyWe now describe the methodology we use to assess the safety of the AV in simulation, identifytest cases to run on the testing ground (track), implement those tests on the real AV and associatedtesting hardware, and perform post-testing data analysis.Let M be the simulation model, including the full software stack and vehicle dynamics modelof the AV, and its environment, including models of all other objects and agents in the simulatedworld. This model can be configured through a vector of parameters π , typically supplied througha configuration file or suitable API to the simulator. Each valuation of π defines a test case x. We
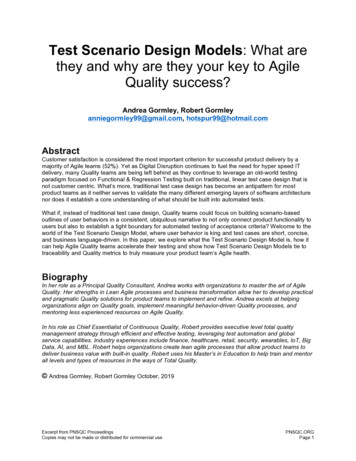
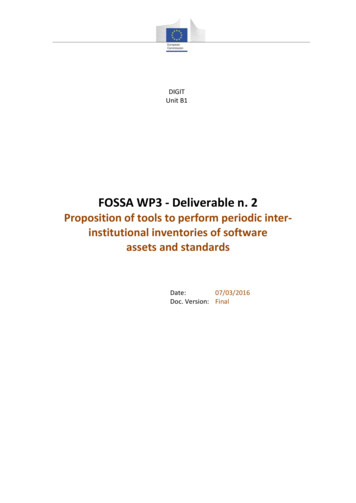
ramTemporalLogicFalsification inVerifAITestcases(safe /unsafe)Test CaseSelectionTestcases(fortrack)TestExecutionon TrackTestdataDataAnalysisResults,InsightsSpecify SafetyProperties/MetricsFigure 2: Formal scenario-based testing methodology used in this paper.assume, for this section, that each test case x produces a unique simulation run.6 The time seriesdata generated by the simulation run is referred to as a trace τ . Each test case x is designed so as toalso be implementable on the real AV on the track, although such implementation can be non-trivialas we describe later. On the track, the environment is less controllable than in the simulator, andtherefore a single test case xi can produce multiple test runs ri,1 , ri,2 , . . .A key aspect of our method is to formally specify a set of test cases along with an associated probability distribution over them. We refer to this distribution of test cases as a scenario S, which isdefined by a S CENIC program PS . Typically, a subset of simulation parameters π are modeled inPS , while the others are left fixed for the experiment.Our overall methodology is depicted in Fig. 2, and involves the following steps:1. Create Simulation Model (Sec. 4.1): The first step is to create a photorealistic simulation environment including dynamical models for a range of agents implementable on the test track. Thisinvolves high-definition (HD) mapping, collecting sensor data by driving around the track, usingthe collected data to create a detailed 3D mesh, loading that mesh into the simulator, annotatingdetails of drivable areas in the simulator, and combining the resulting 3D world model in thesimulator with vehicle and agent dynamics models.2. Formalize Test Scenario (Sec. 4.2): The next step is to formalize the test scenario(s) to executeon the track. We take a formal methods approach, specifying test scenarios in the S CENIC probabilistic programming language (1).3. Formalize Safety Property/Metric (Sec. 4.2): Along with formally specifying the scenario, wemust also specify one or more properties that capture the conditions under which the AV isdeemed to be operating safely. In formal methods, safety properties over traces are usually specified in a logical notation such as temporal logics. When these properties are quantitative, we termthem safety metrics.4. Identify Safe/Unsafe Test Cases (Sec. 4.3): Once the above three steps are complete, the simulation model, test scenario, and safety properties are fed into the V ERIFAI tool to perform falsification. The S CENIC scenario PS defines a distribution over the parameters π . We configuredV ERIFAI to sample from this distribution, simulating each corresponding test case and monitoring the safety properties on the resulting trace. V ERIFAI stores the sampled values of π in safeor error tables depending on whether the test satisfies or violates the specification. Moreover,V ERIFAI uses the robust semantics of metric temporal logic (MTL) (23) to compute a quantitative satisfaction value ρ for the specification ϕ which indicates how strongly it is satisfied: ρ 0implies ϕ is satisfied, and larger values of ρ mean that larger modifications to the trace would benecessary for ϕ to instead be falsified. The resulting test cases are fed to the next step.5. Select Test Cases for Track Testing (Sec. 4.4): V ERIFAI provides several techniques, such asPrincipal Component Analysis and clustering, to automatically analyze the safe and error tablesand extract patterns. For low-dimensional spaces, direct visualization can also be used to identifyclusters of safe/unsafe tests. Using either approach, we identify different behavior modes, andselect representative test cases to execute on the track.6. Implement Selected Test Cases on Track (Sec. 5): Once test cases have been identified in simulation, we need to execute them on the track. For this, dynamic agents (environment vehicles,pedestrians, bicyclists, etc.) must be controllable using parameters, such as (starting location,time to start motion(s), velocities, etc.) specified in the S CENIC program and synthesized into thetest case. Even state-of-the-art hardware available for track testing can have limitations that must6Note, however, that some industrial simulators and AV stacks tend to be non-deterministic in that theconfigurable parameters may not define a unique simulation run. We will discuss later the impact of suchnon-determinism on our results.
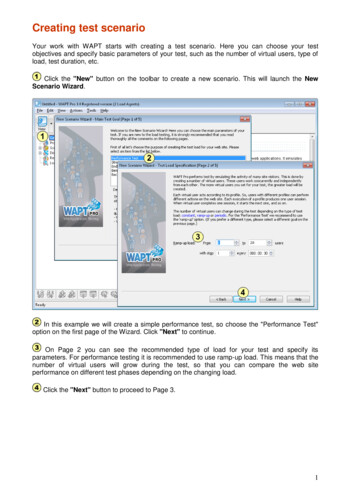
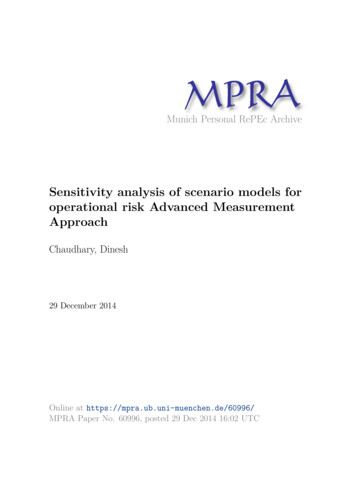
Pedestrianstart pointetl StrePearPedestrianhesitatesAV end pointPedestrianend pointRegion where AV isexpected to yield1 st SThe AV’s pathtreetAV start pointFigure 3: Bird’s-eye view of the scenario S.be matched to the test cases synthesized in simulation so as to accurately reproduce them on thetrack.7. Record Results and Perform Data Analysis (Sec. 6): Finally, during track testing, we recordvarious data including videos of the AV moving through the test environment, data on the AVincluding all sensor data and log data from the AV software stack, as well as data from the testtrack hardware including GPS beacons and the hardware used to control dynamic agents such asa pedestrian dummy. We then analyze this data to evaluate the effectiveness of test case selectionthrough formal simulation, the correspondence between simulation traces and the traces fromtrack experiments, and potential reasons for unsafe or interesting behavior of the AV.44.1SimulationSimulation Model CreationThe photorealistic simulation environment is a “digital twin” of the actual “Urban A” test area atthe GoMentum Station AV testing facility. The environment was created by collecting hundredsof gigabytes of LiDAR point cloud, camera image, and location data while driving around the sitein the test vehicle. The collected point cloud data was processed and converted into a unified 3Dmesh representing every bump and crack in the road surface as well as all of the surrounding objectsincluding curbs, sidewalks, buildings, signs, etc. Tens of thousands of captured images were thenprocessed into textures and applied to the 3D mesh. The mesh was loaded into the LGSVL Simulatorwhich was used to annotate details of the drivable areas including lane lines, driving directions, roadspeeds, crosswalks, intersections, and traffic signs. The annotated, textured mesh was then compiledinto a loadable simulation environment along with HD Maps which were used both in simulationand in the AV for real-world testing.74.2Test Scenario and Safety PropertiesWe selected a scenario where the AV turns right at an intersection, encountering a pedestrian whocrosses the road with hesitation, which the AV drives through. This scenario is diagrammed inFig. 3. To aid implementation on the track, we fixed the initial positions and orientations of the AVand pedestrian, and defined the pedestrian’s trajectory as a straight line with 3 parameters8 : the delay tstart after which the pedestrian starts crossing (with a fixed speed of 1 m/s); the distance dwalk the pedestrian walks before hesitating; the amount of time thesitate the pedestrian hesitates.7The GoMentum digital twin environment is available as a free download including HD Maps in OpenDRIVE, Lanelet2, Apollo, and Autoware formats at 8Other parametrizations are possible. Our choice here corresponds most directly to what we could implement on the test track: see Sec. 5.1.
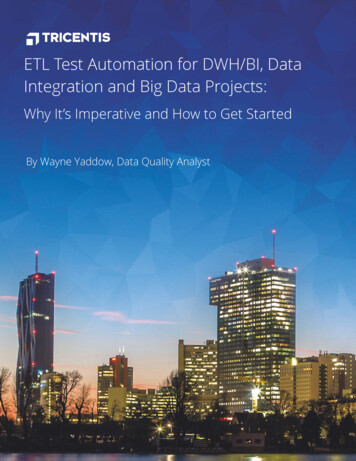
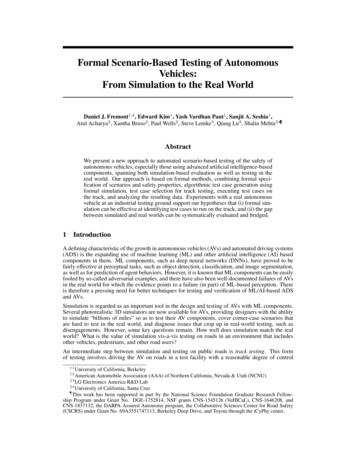
Figure 4: The (simplified) S CENIC program PS encoding our test scenario.We encoded this scenario as the S CENIC program shown in Fig. 4. On lines 7–10 we specify theparameters above to have uniform distributions over appropriate ranges (e.g., tstart (7, 15)). Thefunctions DriveTo and Hesitate on lines 3 and 6 specify the dynamic behavior9 of the AV andthe pedestrian, using API calls to Apollo and the LGSVL Simulator to command the AV to drivethrough the intersection and the pedestrian to walk as described above.Finally, we defined specifications for V ERIFAI to monitor during execution of our test cases. Themost important safety specification is the following: “the AV never comes close to colliding with thepedestrian.” We can formalize this in Metric Temporal Logic (MTL) (2) as ϕsafe G(dist 2.5 m)where dist represents the distance between the AV and the pedestrian (which we can record usingthe LGSVL Simulator API), and G is the MTL operator “globally”, which asserts that a conditionholds at every time point. We chose a threshold of 2.5 m because we measured dist as the distancefrom the center of the AV to the center of the pedestrian10 : the distance from the center of the AV toits front bumper is 2.1 m and to its side is 0.95 m.4.3Identifying Safe and Unsafe Test CasesHaving defined the S CENIC program PS above, we used V ERIFAI to perform falsification, samplingparameters from the distribution S, running the corresponding tests in the LGSVL Simulator, andmonitoring for violations of our specification ϕsafe . We generated 1294 test cases, of which 2%violated ϕsafe . V ERIFAI’s error table stored the parameter values for all such cases, along with thequantitative satisfaction value ρ of the specification; for ϕsafe , this is simply the minimum distancebetween the AV and the pedestrian over the course of the test, minus 2.5 m. We configured V ERIFAIto store the safe runs as well to distinguish robustly-safe runs from near-accident runs. The ρ valueshelp to identify marginal regions that are good candidates for testing.4.4Test Case SelectionIn our experiments, the parameter vector π was low-dimensional enough for direct visualization(there being only 3 parameters). For example, Fig. 5 shows ρ as a function of the start delay tstartand the walk distance dwalk . The darker the points, the smaller the values of ρ, i.e. the closer theyare to a collision. We observe two main clusters of unsafe runs, in the bottom-left and upper-rightquadrants of the graph. Using Fig. 5 and similar plots for the hesitate time thesitate , we selectedvalues of π corresponding roughly to the centroids of each of the main clusters of safe and unsaferuns, the hope being that these would yield robustly safe/unsafe behaviors that would replicate inthe real world, even though noise would likely be introduced to those parameters in implementation.We thereby obtained 7 test cases to execute on the track as shown in Table 1. Based on the quadrantand minimum distance, we classified these test cases as failure, marginally safe (marginal), andsuccess (safe). The success cases are selected from the upper-left quadrant of Fig. 5. The failureand marginal cases are selected from the bottom-left quadrant. The marginal cases are those thatsatisfy ϕsafe , but lie close to other failure cases; hence, implementing these cases in the real worldmay result in failure due to imprecision in implementing π on real hardware.9The behavior property is used by a prototype extension of S CENIC with dynamics, which is used todefine DriveTo and Hesitate and will be described in a future paper.10In future work we plan to improve the simulator interface to measure the distance from the surface of theAV to the surface of the pedestrian.
1112startDelay131415Figure 5: Satisfaction value ρ of ϕsafe (i.e. the minimum distance from the AV to the pedestrian,minus 2.5 m) as a function of tstart and dwalk .Table 1: Track Test Cases Selected from SimulationTest CaseF1F2M1M2M3S1S25HesitateTime (s)2.672.932.131.961.032.852.50WalkDistance (m)4.504.244.235.024.926.886.33StartDelay (s)10.5411.538.508.779.977.648.39MinimumDistance (m)2.231.914.054.785.855.455.95Track Testing5.1Experimental SetupTest AV: The test vehicle is a 2018 Lincoln MKZ Hybrid (shown in Fig. 1) enhanced with DataSpeeddrive-by-wire functionality and several sensors including a Velodyne VLS-128 LiDAR, three Leopard Imaging AR023ZWDR USB cameras, and a Novatel PwrPak7 dual-antenna GPS/IMU withRTK correction for 2 cm position accuracy. The tests were performed using the open-sourceApollo 3.511 self-driving software (24) installed on an x86 Industrial PC with an NVIDIA GTX1080 GPU. Apollo’s perception processes data from the LiDAR sensor using GPU-accelerated deepneural networks to identify perceived obstacles.Pedestrian Dummy and Associated Hardware: To implement the pedestrian at GoMentum, we useda pulley-based 4Active surfboard platform (SB) (25). The battery powered system drives a motor unit that pulls a drivable platform upon which a “soft target”, i.e., an articulated pedestriandummy (26), is mounted. The dummy is designed to have a sensor signature similar to real pedestrians. The SB can be programmed for various types of motions, including the “hesitating pedestrian”trajectory used in our scenario.Triggering Mechanisms: The trigger mechanism of the SB initiates the movement of the pedestrian.For repeatability of scenario testing, it is critical that the same trigger mechanism is implementedboth in simulation and in real world. We originally attempted to configure the SB to trigger automatically when a desired distance dstart between the AV and the pedestrian is met. However, the SBmanufacturer confirmed that the SB does not support triggering based on distance threshold, andwe experimentally confirmed that manual triggering based on an estimate of dstart is not accurate.11This was the most recent Apollo version supported by our hardware.
Therefore, as described in Sec. 4.2, we reparametrized our scenario in terms of a threshold delaytstart measured as the time elapsed from when the AV begins to move to when the pedestrian beginsto move. Although the SB hardware does not support automatic triggering based on a time delayeither, we were able to implement more accurate triggering by starting a countdown timer when theAV begins to move and manually triggering the SB when the timer expired.Setting up track tests was a tedious and time-consuming effort: it took about 8 people ha
formal simulation, test case selection for track testing, executing test cases on the track, and analyzing the resulting data. Experiments with a real autonomous . A defining characteristic of the growth in autonomous vehicles (AVs) and automated driving systems (ADS) is the expanding use of machine learning (ML) and other artificial .