Transcription
CALIFORNIA TOBACCO FACTS AND FIGURES 2019California Department of Public HealthCalifornia Tobacco Control Program
Inquiries may be directed to:Xueying Zhang, MD, MPH, MSChief, Surveillance UnitCalifornia Department of Public HealthCDIC/Tobacco Control ProgramP.O. Box 997377, MS 7206Sacramento, CA 95899-7377CTCPEvaluation@cdph.ca.govAll content is in the public domain and may be reproduced or copied with citation.Suggested citation: Vuong TD, Zhang X, Roeseler A. California Tobacco Facts and Figures 2019. Sacramento, CA: California Department of PublicHealth; May 2019.Any analyses, interpretations, or conclusions reached from the data are credited to the authors and not the data provider. Several data sources are used in thisdocument. Each data source is based on a different survey or surveillance tool, and therefore readers may see slightly different rates throughout this report.However, the rate differences are not statistically significant and represent the most accurate and complete picture of California to the best of our knowledge.iiCalifornia Tobacco Facts and Figures 2019
TABLE OF CONTENTSIntroduction. 1Adult Tobacco Use. 3Youth Tobacco Use.11Tobacco Consumption and Distribution.15Secondhand Exposure.18Tobacco Control Policies .21Cessation. 24References . 29California Tobacco Facts and Figures 2019iii
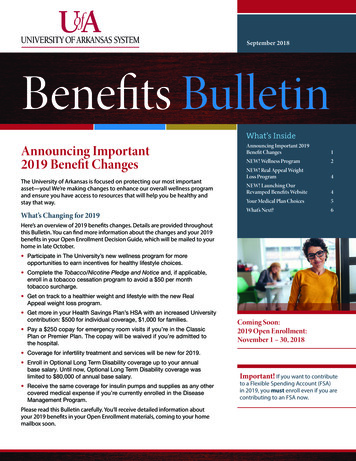
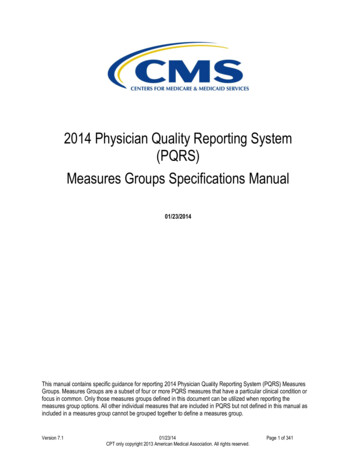
INTRODUCTIONThe California Department of Public Health (CDPH), California Tobacco Control Program (CTCP) was established in 1989 after California voterspassed the Tobacco Tax and Health Protection Act of 1988 (Proposition 99). Since then, California voters renewed their support in the fight against tobaccouse by passing the California Healthcare, Research and Prevention Tobacco Tax Act of 2016 (Proposition 56).With a projected 2.1 billion in California tobacco tax revenue to be collected in fiscal year (FY) 2018-19,1 CDPH/CTCP was appropriated 37.7 millionfrom Proposition 99 and 129.5 million from Proposition 56 by the Legislature and the Governor for health education for fiscal year 2018-19 (Figure 1).Figure 1. Allocation of health education funding to the California Department of Public Health, FY 2018-19Administration, 12.9MLocal Health Departments, 45.2MMedia Campaign, 45.5MGrant Program, 52.9MEvaluation and Surveillance, 10.7MSource: California Department of Public Health, California Tobacco Control Branch; Sacramento, CA: California Department of Public Health; August 2018.CDPH/CTCP receives guidance from the Tobacco Education and Research Oversight Committee (TEROC), a legislatively-mandated advisorycommittee charged with overseeing Proposition 99 and Proposition 56 revenues for tobacco control, tobacco use prevention, and tobacco-relatedresearch. TEROC established three goals for California’s tobacco control efforts:(1) Reduce all tobacco use to no more than 10 percent in adults and 8 percent in high-school age youth by December 2020;(2) Accelerate the reduction in tobacco use rates and eliminate tobacco-related disparities among priority population; and(3) Eliminate the structural, political, and social determinants that sustain the tobacco epidemic in California.2To achieve these goals, CDPH/CTCP seeks to create a climate in which tobacco becomes less desirable, less acceptable, and less accessible. In 2017,CDPH/CTCP launched an initiative to accelerate declines in tobacco-related disparities through extensive engagement of priority population groups intobacco control efforts. To date, CDPH/CTCP has funded over 100 million in grants and contracts towards this initiative, which includes a minimum15 percent of the funds allocated to local health departments for comprehensive tobacco control efforts (Figure 2).3California Tobacco Facts and Figures 20191
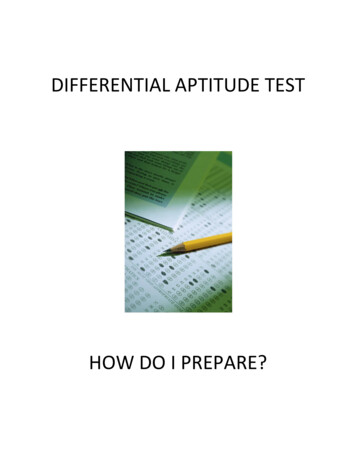
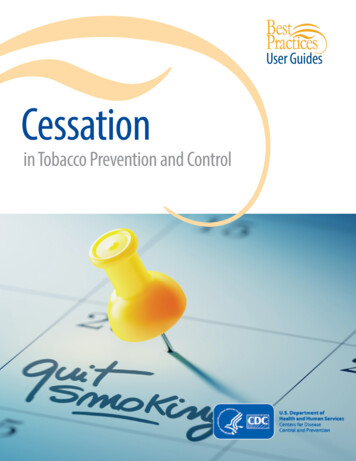
Figure 2. Total project funding for the Initiative to Reduce Tobacco-Related Disparities, FY 2017-18 to FY 2020-21Funding in US Dollars (M, million) 75MFundedAnticipated 60.1 50M 30.3 24.0 22.0 25M 8.6 0MIN DEVELOPMENTLocal Lead AgenciesRegional InitiativesAmerican Indian InitiativeBehavioral Health InitiativeEvidence-Based andPromising Practices InitiativeLow Socioeconomic StatusInitiativeProject TypeNote: Project funding is as of April 12, 2019 and may change if the Budget Act of the current year and/or any subsequent years covered by each individual grants or contracts agreement does not appropriate sufficient funding for the program. Source:California Department of Public Health, California Tobacco Control Program; Sacramento, CA: California Department of Public Health; March 2019.This publication serves as a quick reference and snapshot of the current state of tobacco control in California. With the changing landscape of tobacco use inCalifornia, a tremendous amount of work remains to be done in order to achieve TEROC’s goals of reducing adult tobacco use to no more than 10 percentand teen use to 8 percent by 2020.April Roeseler, Tobacco Control Branch ChiefCalifornia Department of Public Health2California Tobacco Facts and Figures 2019
ADULT TOBACCO USECalifornia Tobacco Facts and Figures 20193
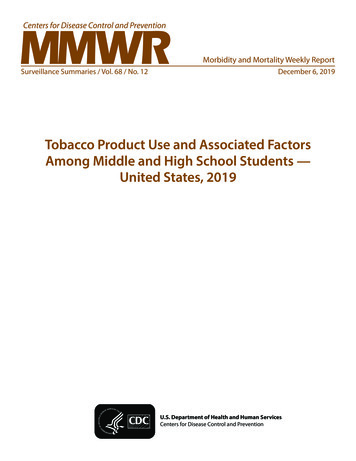
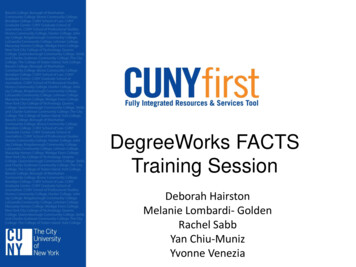
ADULT CIGARETTE USEFewer adults are smoking cigarettes than ever before.4,5 The adult cigarette smoking rate in California declined by 57.4 percent between 1988 and 2017(Figure 3),4 with a current rate of 10.1 percent or about 2.8 million adults.Figure 3. Cigarette smoking rate among California adults, 1988 to %1988Cigarette Smoking Rate (%)Rest of the United StatesYearNote: Restricted to respondents aged 18 or older. Cigarette use is based on self-reported current use. A break in the trend line is shown for California data between 1995 and 1996 and between 2011 and 2012 due to methodological change. A breakin the trend line is shown for the Rest of the United States data between 2010 and 2011 due to methodological change. Source: (1) Behavioral Risk Factor Surveillance System, 1988 to 2017. Sacramento, CA: California Department of Public Health;October 2018. (2) Behavioral Risk Factor Surveillance System, 1996 to 2017. Atlanta, GA: Centers for Disease Control and Prevention; October 2018.4California Tobacco Facts and Figures 2019
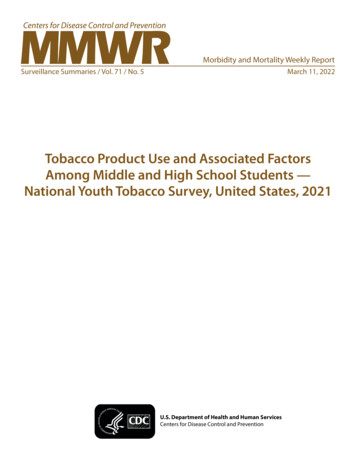
ADULT CIGARETTE USE BY DEMOGRAPHICSDisparities remain for cigarette use among groups defined by gender and sexual orientation, race and ethnicity, age, educational attainment, income,health insurance type, housing type, and community density as depicted in Figure 4.620%Statewide, Employment-BasedPrivately PurchasedHouseMulti-Unit red7.7%300% FPL or Higher4.6%Some Graduate School or Higher13.2%6.7%Bachelor's Degree185% to 299% FPL13.0%Associate's Degree15.1%13.3%Some College100% to 184% FPL18.8%Vocational School15.8%13.5%High School GraduateEducation Attained0% to 99% FPL16.0%12.2%Age 50 to 64Less than High School12.4%Age 35 to 49Age Group6.7%13.2%Age 21 to 34Race and EthnicityAge 65 or Older4.4%7.4%Asian or Pacific IslanderAge 18 to 2019.1%American Indian11.8%17.0%African American or panic or Latino7.8%Female0%14.4%10%MaleCigarette Smoking Rate (%)Figure 4. Cigarette smoking among California adults by demographics, 2016-17Health InsuranceHomeDensityNote: Restricted to respondents aged 18 or older, except for LGBT status which is restricted to respondents aged 18 to 70 (the statewide rate for aged 18 to 70 is 11.8 percent). Cigarette use is based on self-reported current use. The race and ethnicitycategories are non-Hispanic or Latino unless otherwise noted. American Indian includes Alaska Native. Asian or Pacific Islander includes Native Hawaiian. LGBT refers to lesbian, gay, bisexual, or transgender. FPL refers to the Federal Poverty Level. Rural isbased on definition from the Nielsen Consumer Activation, where the population density is fewer than 1,000 persons per square mile. Source: California Health Interview Survey, 2016-17. Los Angeles, CA: UCLA Center for Health Policy Research; October2018.California Tobacco Facts and Figures 20195
ADULT CIGARETTE USE RATE OF CHANGE BY RACE AND ETHNICITYAfrican American or Black adults saw a smaller decrease in the reduction of cigarette use over the past fifteen years compared to other groups, reducingtheir rate by only 14.6 percent from 2003 (Figure 5).6,7 American Indian adults saw a greater rate of decrease at 20.6 percent, but overall use rate stillremains high.Figure 5. Rate of change (ROC) in cigarette smoking among California adults by race and ethnicity, 2003 to 2016-1720032016-17Cigarette Smoking Rate (%)40%ROC: - 36.5%20%ROC: - 14.7%ROC: - 31.3%ROC: - 46.9%ROC: - 31.0%ROC: - 33.2%0%African American orBlackAmerican IndianAsian orPacific IslanderHispanic or LatinoWhiteStatewideRace and EthnicityNote: Restricted to respondents aged 18 or older. Cigarette use is based on self-reported current use. The race and ethnicity categories are non-Hispanic or Latino unless otherwise noted. ROC refers to the rate of change between CHIS 2003 and CHIS2016-17. Source: California Health Interview Survey, 2003 and 2016-17. Los Angeles, CA: UCLA Center for Health Policy Research; October 2018.6California Tobacco Facts and Figures 2019
NUMBER OF ADULT CIGARETTE SMOKERS BY DEMOGRAPHICSCigarette smoking rates vary considerably; however, in considering the burden of smoking by demographic group, it is important to recognize that whilethe smoking rate may be lower in a group such as Hispanic or Latinos, this group makes up over 1 million of California’s adult smoking population(Figure 6).6Figure 6. Number of cigarette smokers among California adults by demographics, 2016-17American Indian19.1%LGBT17.4%African American or Black, Female14.0%Low-Income, African American or Black23.0%Psychological Distress, Female21.5%African American or Black, Male20.4%33.5%White, Did Not Complete High School34.7%Asian, Male10.6%Asian or Pacific Islander, MaleCigarette Smoking Rate (%)DemographicsPsychological Distress, Male11.4%African American or Black17.0%Served in U.S. Armed Forces13.0%Psychological Distress26.7%Rural14.9%Low-Income, White25.0%Did Not Complete High School16.0%Hispanic or Latino, Male15.2%Hispanic or 0001,500,0002,000,000Number of SmokersNote: Restricted to respondents aged 18 or older, except for LGBT status which is restricted to respondents aged 18 to 70. Cigarette use is based on self-reported current use. The race and ethnicity categories are non-Hispanic or Latino unless otherwise noted.American Indian includes Alaska Native. Asian or Pacific Islander includes Native Hawaiian. LGBT refers to lesbian, gay, bisexual, or transgender. Low-income is defined as below 185 percent of the Federal Poverty Level. Rural is based on definition from theNielsen Consumer Activation, where the population density is fewer than 1,000 persons per square mile. Psychological distress is defined as experiencing psychological distress in the past month based on the Kessler 6 scale. Source: California HealthInterview Survey, 2016-17. Los Angeles, CA: UCLA Center for Health Policy Research; October 2018.California Tobacco Facts and Figures 20197
ADULT CIGARETTE USE BY REGIONThere are geographical differences in the cigarette smoking rate in California. Higher rates of smoking are mainly found in rural counties as illustrated in Figure 7.8Figure 7. Cigarette smoking rate among California adults by geographic regions, %Alpine15.3% (a)Placer10.2%Amador15.3% (a)Plumas20.3% (b)Butte17.3%Riverside11.8%Calaveras15.3% (a)Sacramento13.6%Colusa19.8% (c)San Benito10.6%Contra Costa11.8%San Bernardino14.4%Del Norte20.3% (b)San Diego11.1%El Dorado14.6%San Francisco11.0%Fresno14.9%San Joaquin11.6%Glenn19.8% (c)San Luis Obispo11.8%Humboldt16.9%San Mateo9.3%Imperial11.4%Santa Barbara9.6% (e)Inyo15.3% (a)Santa Clara7.8%Kern16.1%Santa Cruz13.4%Kings15.5%Shasta19.4%Lake25.1%Sierra20.3% (b)Lassen20.3% (b)Siskiyou20.3% (b)Los Angeles11.0%Solano14.5%Madera16.1%Sonoma12.3% (d)Marin8.7%Stanislaus17.1%Mariposa15.3% (a)Sutter13.9%Mendocino15.9%Tehama19.8% (c)Merced14.7%Trinity20.3% (b)Modoc20.3% (b)Tulare10.4%Mono15.3% (a)Tuolumne15.3% (a)Monterey11.7%Ventura9.6% (e)Napa12.3% (d)Yolo5.6%Nevada15.6%Yuba22.4%California Tobacco Facts and Figures 2019Note: Restricted to respondents aged 18 or older. Cigarette use is based on self-reported current use. Several countieswere categorized together to produce stable estimates: (a) Alpine, Amador, Calaveras, Inyo, Mariposa, Mono,Tuolumne; (b) Del Norte, Lassen, Modoc, Plumas, Sierra, Siskiyou, Trinity; (c) Colusa, Glenn, Tehama; (d) Napa, Sonoma;and (e) Santa Barbara, Ventura. Source: California Health Interview Survey, 2015-17. Los Angeles, CA: UCLA Center forHealth Policy Research; February 2019.
ADULT TOBACCO USEDespite the decline in cigarette smoking rate, approximately four million adults in California currently use or had used a tobacco product in the past 30days (Figure 8).9 The number of adult tobacco users in California exceeds the population in 23 states.10Figure 8. Tobacco use rate among California adults by product type, 20175.6M14.6%10%10.1%2.8MNumber of Adults (M, millions)Tobacco Use Rate (%)20%3.1%1.6%0%CigaretteElectronic SmokingDeviceLittle Cigar orCigarillo1.4%1.4%CigarHookah0.8%0.6%Smokeless TobaccoPipe TobaccoAny Tobacco0.0MProduct TypeNote: Restricted to respondents aged 18 or older. Cigarette and electronic smoking device use are based on self-reported current use. Cigar, hookah, little cigar or cigarillo, pipe tobacco, or smokeless tobacco use are based on self-reported past 30-dayuse. Any tobacco use is based on current use of cigarette or electronic smoking device or past 30-day use of cigar, hookah, little cigar or cigarillo, hookah, pipe tobacco, or smokeless tobacco. Source: Behavioral Risk Factor Surveillance System, 2017.Sacramento, CA: California Department of Public Health; October 2018.California Tobacco Facts and Figures 20199
YOUNG ADULT TOBACCO USEYoung adults (under age 30) in California use electronic smoking devices (9.4 percent) and hookah (6.0 percent) at a higher rate compared to older adults(Figure 9).11 Furthermore, of young adult tobacco users, 57.7 percent use a flavored tobacco product.Figure 9. Tobacco use rate among California by age group and product type, 2016-17Age Under 30Age 30 or Older20%Tobacco Use Rate 5.4%1.7%0.3%4.3%2.2%ElectronicSmoking DeviceLittle Cigar orCigarilloHookahAny Tobacco0.8%2.8%1.0%CigaretteElectronicSmoking DeviceProduct Type1.0%Little Cigar orCigarillo0.7%Hookah0.3%4.2%Any TobaccoProduct TypeFlavored ProductNon-Flavored ProductNote: Cigarette and electronic smoking device use are based on self-reported current use. Cigar (not shown), hookah, little cigar or cigarillo, and smokeless tobacco (not shown) use are based on self-reported past 30-day use. Any tobacco use is basedon current use of cigarette or electronic smoking device or past 30-day use of cigar, hookah, little cigar or cigarillo, hookah, or smokeless tobacco. Source: Behavioral Risk Factor Surveillance System, 2016-17. Sacramento, CA: California Department ofPublic Health; October 2018.10California Tobacco Facts and Figures 2019
YOUTH TOBACCO USECalifornia Tobacco Facts and Figures 201911
YOUTH FLAVORED TOBACCO USEOne in eight California high school students currently use any tobacco product,12 with the most used product among all students being electronicsmoking devices (10.9 percent). Of those that currently use tobacco, an overwhelming majority use electronic smoking devices (84.3 percent). Inaddition, 86.4 percent of youth tobacco users reported using flavored tobacco products (Figure 10).Figure 10. Tobacco use rate among California youth by product type, 2018Tobacco Use Rate c SmokingDeviceLittle Cigar or okeless Tobacco0.3%Number of High School Youth (K, thousands)20%0.4%CigarAny Tobacco0KProduct TypeFlavored ProductNon-Flavored ProductNote: Restricted to respondents in high school. Cigar, cigarette, electronic smoking device, hookah, little cigar or cigarillo, and smokeless tobacco use are based on self-reported past 30-day use. Any tobacco use is based on past 30-day use of cigar,cigarette, electronic smoking device, hookah, little cigar or cigarillo, or smokeless tobacco. Source: California Student Tobacco Survey, 2017-18. San Diego, CA: Center for Research and Intervention in Tobacco Control, University of California, SanDiego; April 2019.12California Tobacco Facts and Figures 2019
YOUTH TOBACCO USE BY DEMOGRAPHICSDisparities in tobacco use exists among California high school students, with higher rates found in LGBTQ , American Indian, and Pacific Islanderyouth (Figure 11).12Figure 11. Tobacco use rate among California youth by demographics, 2018Statewide , 12.7%LGBTQ18.2%10.0%White10th Grade15.9%17.1%Pacific IslanderRace and Ethnicity12th Grade10.3%Hispanic or Latino7.0%Asian19.7%American Indian9.9%African American or Black15.0%LGBTQ12.0%21.8%Identify Another WayGenderNon-LGBTQ11.1%Female0%12.2%10%MaleTobacco Use Rate (%)20%GradeNote: Restricted to respondents in high school. Cigar, cigarette, electronic smoking device, hookah, little cigar or cigarillo, and smokeless tobacco use are based on self-reported past 30-day use. Any tobacco use is based on past 30-day use of cigar,cigarette, electronic smoking device, hookah, little cigar or cigarillo, or smokeless tobacco. The race and ethnicity categories are non-Hispanic or Latino unless otherwise noted. American Indian includes Alaska Native. Pacific Islander includes NativeHawaiian. LGBTQ refers to lesbian, gay, bisexual, transgender, or queer. Caution should be utilized when comparing previous years of the California Student Tobacco Survey due to changes to the race/ethnicity response option. Source: CaliforniaStudent Tobacco Survey, 2017-18. San Diego, CA: Center for Research and Intervention in Tobacco Control, University of California, San Diego; April 2019.California Tobacco Facts and Figures 201913
YOUTH CIGARETTE USESince 2000, youth cigarette smoking rate in both California and the United States decreased considerably (Figure 12).13,14 California reported its lowesthigh school cigarette smoking rate in 2018 at 2.0 percent.12Figure 12. Cigarette smoking rate among California youths, 2002 to 201830%CaliforniaUnited StatesCigarette Smoking Rate 012201420162018YearNote: Restricted to respondents in high school. Cigarette use is based on self-reported past 30-day use. A break in the trend line is shown for California data between 2012 and 2016 due to methodological change. Source: (1) California StudentTobacco Survey, 2001-02 to 2011-12. Sacramento, CA: California Department of Public Health; 2013. (2) California Student Tobacco Survey, 2015-16 to 2017-18. San Diego, CA: Center for Research and Intervention in Tobacco Control, University ofCalifornia, San Diego; April 2019. (3) National Youth Tobacco Survey, 2002 to 2018. Atlanta, GA: U.S. Department of Health and Human Services; February 2019.14California Tobacco Facts and Figures 2019
TOBACCO CONSUMPTION AND DISTRIBUTIONCalifornia Tobacco Facts and Figures 201915
CIGARETTE CONSUMPTION PER CAPITAPer capita consumption of cigarettes has declined steadily since the 1980s (Figure 13),15 with the greatest rate of decline in California occurring in thoseyears subsequent to increases in the cigarette excise tax. The current per capita consumption in California is 56.5 percent lower than the rest of theUnited States at 16.6 packs in 2018.15Figure 13. Per capita cigarette consumption for California and Rest of the United States, 1980 to 2018150California142.3Per Capita ConsumptionRest of the United States120.2100November 1988Proposition 99 passes, funding theCalifornia Tobacco Control Program5038.2November 1998Proposition 10 passes, fundingFirst 5 CaliforniaYearNote: Cigarette consumption is based on tax-paid cigarette sales. Source: Orzechowski and Walker. The Tax Burden on Tobacco: Historical Compilation, Volume 53, 2018. Arlington, VA: Orzechowski and Walker; 2019.16California Tobacco Facts and Figures 821983198101980November 2016Proposition 56 passes, raising the statecigarette excise tax to 2.87 per pack
UNDERAGE TOBACCO SALESIn 2016, California raised the minimum legal sales age for tobacco products to 21. Tobacco and vape shops have the lowest compliance with this law,16with one out of three tobacco and vape shops selling to underage minors (Figure 14).Figure 14. Underage sales rate to young adults among licensed tobacco retailers in California by retailer type, 2018Violation Rate (%)50%Federally Mandated StatewideTarget , obacco and VapeShopConvenience Storewithout GasSmall MarketConvenience Storewith GasLiquor StoreSupermarketPharmacyStatewideRetailer TypeNote: Decoys age 18 and 19 attempted to purchase conventional tobacco (e.g. cigarette, little cigar or cigarillo) and electronic smoking devices or vaping products (e.g. e-liquid, e-cigarette). Source: Young Adult Tobacco Purchase Survey, 2018.Sacramento, CA: California Department of Public Health; October 2018.California Tobacco Facts and Figures 201917
SECONDHAND EXPOSURE18California Tobacco Facts and Figures 2019
ADULT SECONDHAND EXPOSURECalifornia has a comprehensive smoke-free law;17 nevertheless, over the past three years, the rate of Californians reporting exposure to tobacco smoke,e-cigarette vapor, and marijuana smoke increased (Figure 15).18Figure 15. Secondhand exposure among California adults age 18 to 64, 2016 to 2018100%Exposure Rate (%)75%Tobacco Smoke56.1%52.8%50%39.9%Marijuana Smoke25%32.5%21.5%E- Cigarette Vapor19.5%0%201620172018YearNote: Secondhand tobacco smoke, secondhand e-cigarette vapor, and secondhand marijuana smoke is based on self-reported past 2-weeks exposure in California. Source: Online California Adult Tobacco Survey, 2016 to 2018. Sacramento, CA:California Department of Public Health; November 2018.California Tobacco Facts and Figures 201919
YOUTH SECONDHAND EXPOSURESecondhand exposure remains a concern in youth, with roughly 30 percent of high school students reporting exposure to tobacco smoke, e-cigarettevapor, or marijuana smoke while in a room or in a car (Figure 16).12Figure 16. Secondhand exposure among California youth, 2018100%Exposure Rate (%)75%50%33.4%32.5%Tobacco SmokeE-Cigarette Vapor30.7%25%0%Marijuana SmokeSecondhand Exposure TypeNote: Restricted to respondents in high school. Secondhand tobacco smoke, secondhand e-cigarette vapor, and secondhand marijuana smoke is based on self-reported past 30-day exposure in a room or in a car. Source: California Student TobaccoSurvey, 2017-18. San Diego, CA: Center for Research and Intervention in Tobacco Control, University of California, San Diego; April 2019.20California Tobacco Facts and Figures 2019
TOBACCO CONTROL POLICIESCalifornia Tobacco Facts and Figures 201921
LOCAL TOBACCO CONTROL POLICIESOver the past decade, local jurisdictions made great strides in passing tobacco control ordinances, specifically policies related to outdoor secondhandsmoke, tobacco retail licensing, smoke-free multi-unit housing, and restricting flavored tobacco sales (Figure 17).19Figure 17. Number of California jurisdictions with local tobacco control policies by policy type, 2008 to 2018500Outdoor Secondhand SmokeTobacco Retail LicensingSmoke-Free Multi-Unit HousingFlavored Tobacco Sales RestrictionNumber of 092010201120122013201420152016Year EndingNote: The number of jurisdictions with local policy enacted as of December 31, 2018. Source: Policy Evaluation Tracking Database. Sacramento, CA: California Department of Public Health; January 2019.22California Tobacco Facts and Figures 201920172018
PUBLIC SUPPORT FOR TOBACCO CONTROL POLICIESA majority of California adults agreed with a variety of CDPH/CTCP-policy priorities as detailed in Figure 18,20 with 57 percent agreeing that thereshould be a gradual ban on the sale of cigarettes.Figure 18. Public agreement with tobacco control policies among California adults age 18 to 64, 2018Strongly DisagreeRetail PoliciesPharmacies Should Not Sell Tobacco ProductsFlavor PoliciesDisagree42%AgreeStrongly Agree10%Coupons or Other Special Promotions for Tobacco Purchases Should Be BannedThere Should Be a Gradual Ban on the Sale of CigarettesSale of Flavored Tobacco Products Should Not Be AllowedSale of Menthol Cigarettes Should Not Be Allowed25%25%29%8%24%35%10%Smoking Should Not Be Allowed at Public Beaches5%Apartments Should Require All Rental Units to Be Smoke-Free and Vape-Free8%-50%24%27%33%10%All Indoor Worksites Should Be Smoke-FreeSmoke-free Policies27%25%6%2% cent (%)Note: Exact full wording for each survey question can be found on the CDPH/CTCP website. Source: Online California Adult Tobacco Survey, 2018. Sacramento, CA: California Department of Public Health; November 2018.California Tobacco Facts and Figures 201923
CESSATION24California Tobacco Facts and Figures 2019
CESSATION INTENT AND ATTEMPTThe rate of adult cigarette smokers who thought about quitting or made a quit attempt decreased or remained stagnant over the past five years (Figure 19).21Figure 19. Quit intention and attempt among current adult cigarette smokers in California, 2013 to 2017100%Quit IntentQuit Attempt75.2%75%Percent Note: Restricted to respondents aged 18 or older who are current smokers. Thinking about quitting in the next 6 months (quit intent) and quit attempt in the past 12 months are based on self-reported responses. Source: California Health Interview SurveyPublic Use File, 2013 to 2017. Los Angeles, CA: UCLA Center for Health Policy Research; October 2018.California Tobacco Facts and Figures 201925
DOCTOR REFERRALS TO CESSATION PROGRAMSDoctors should follow evidence-based models to promote cessation among all patients, such as the 5A’s (Ask, Advise, Assess, Assist, Arrange), AskAdvise-Refer (AAR), or Ask-Advise-Connect (AAC).22-24 About one in four adult smokers report that their doctor advised them to quit smoking andalso referred them to a cessation program (Figure 20).25Figure 20. Advised to quit and referred to cessation programs among adult cigarette smokers in California, 2014 to 2017100%Advised and ReferredAdvised OnlyReferred OnlyPercent %28.2%201420162017YearNote: Restricted to respondents aged 18 or older who are current smokers and self-reported seeing a medical doctor in the past 12 months. Survey question was not asked in 2015. Source: California Health Interview Survey Public Use File, 2014 to 2017.Los Angeles, CA: UCLA Center for Health Policy Research; October 2018.26California Tobacco Facts and Figures 2019
CALIFORNIA SMOKERS’ HELPLINEThe California Smokers’ Helpline (Helpline) has provided free and confidential cessation services to over 800,000 Californians since its beginning in1992.26 Services are provided via telephone, chat, text messaging and mobile apps. A profile of the 20,000 individuals that utilized the Helpline in 2018is illustrated in Figure 21.27Figure 21. Profile of California Smokers’ Helpline callers, 2018GenderMale, 45%Female, 55%DemographicsSexual Orientation LGB, 6%Non-LGB, 94%American Indian, 1%Asian or Pacific Islander, 9%Race and EthnictyHispanic or Latino, 18%White, 46%Other, 9%African American or Black,16%Age Under 18, 1%Age GroupAge 25 to 44, 30%Age 45 to 64, 51%Age 65 or Older,16%Age 18 to 24, 3%Medi-Cal Coverage0%Covered, 71%Not Covered, 30%50%100%Percent (%)Note: Percentages may not total to 100 percent due to rounding. The race and ethnicity categories are non-Hispanic or Latino unless otherwise noted. American Indian includes Alaska Native. LGB refers to lesbian, gay, or bisexual. Source: HelplineCaller Intake Reports, 2018. San Diego, CA: California Smokers’ Helpline, University of California, San Diego; March 2019.California Tobacco Facts and Figures 201927
DIRECT REFERRALS TO THE CALIFORNIA SMOKERS’ HELPLINEThe Helpline began accepting two-way electronic health record (EHR) r
ADULT CIGARETTE USE. Fewer adults are smoking cigarettes than ever before. 4,5. The adult cigarette smoking rate in California declined by 57.4 percent between 1988 and 2017 (Figure 3), 4. with a current rate of 10.1 percent or about 2.8 million adults. 10.1% 17.1% 0% 10% 20% 30%