Transcription
Lauren A. HallDespite its small size, Maryland is a diverse state. Its 24jurisdictions sometimes have very different populations, and,consequently, may have very different needs. While statewidedata can be extraordinarily helpful to state-level programmanagers and policymakers, it may not reflect the customers thatlocal departments of social services see in their offices.To assist local departments in better serving their TemporaryCash Assistance (TCA) customers, we examined adult recipientsin 18 of the 24 jurisdictions over the last few years (SFY 20162018). This brief profiles Anne Arundel County, one of theremaining jurisdictions in this installment. Anne Arundel County islocated in central Maryland. It is part of the Baltimore-ColumbiaTowson Metropolitan Statistical Area, meaning that there is ahigh degree of economic integration among the counties1 in thisarea (U.S. Census Bureau, 2018a). Six percent of families withchildren under the age of 18 in Anne Arundel County were livingbelow the poverty line between 2014 and 2018, less than thestatewide percentage of 9.8% (U.S. Census Bureau, 2019b). Inaddition to lower poverty, the county had a median annual familyincome of 112,549, which was higher than the median familyincome for Maryland ( 99,403). (U.S. Census Bureau, 2019b).Anne Arundel County, one of Maryland’s most populatedcounties (U.S. Census Bureau, 2018b), makes up 7% of the TCAcaseload (Gross & Passarella, 2020). As one of the mostpopulated counties, it is valuable to note the ways in which adultrecipients in this county differ from the state as a whole. Table 1provides an overview of the demographic characteristics of adultrecipients. Anne Arundel County TCA recipients are typicallyAfrican American (54.6%) or Caucasian (39.2%) women (91.4%)in their early 30s who never married (75.9%). Compared toMaryland as a whole, Anne Arundel County recipients are morelikely to be Caucasian and less likely to be African American.1KEY FINDINGS Anne Arundel County adultrecipients are typicallyAfrican American orCaucasian women in their30s who never married. Approximately 80% finishedhigh school. One in four have a disabilitythat is expected to last over12 months. Six in 10 worked in the yearbefore they began receivingTCA, but less than 45% ofthose employed worked allfour quarters in that year. Earnings among employedadult recipients in that yearwere low, with a median ofaround 7,200. More than 40% of AnneArundel County adultrecipients who worked in theyear before they receivedTCA were employed in fourindustries: restaurants,administrative and supportservices, general retail, andnursing homes.This statistical area includes Baltimore City and the counties of Baltimore, Carroll, Harford, Howard, and QueenAnne's counties.
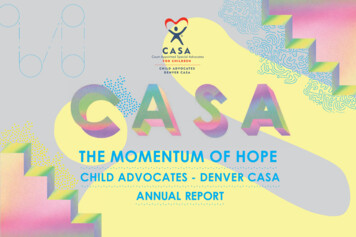
Table 1. DemographicsGender% FemaleAgeAverageRace & Ethnicity% Caucasian % African American % Hispanic% Other Marital Status% Married% Never Marriededucational attainment among AnneArundel County adult recipients alongsideadult recipients statewide and in otherjurisdictions. The lines represent the rangeof values across all 24 jurisdictions, with thebars at the top and bottom indicating thestatewide high—the highest value across alljurisdictions—and the statewide low—thelowest value across all jurisdictions. Thesquare indicates the statewide average, andthe colored diamond denotes Anne % Divorced, Separated,or WidowedComparing Anne Arundel County with therest of the state shows that adult recipientsin Anne Arundel County have somewhathigher levels of educational attainment thantheir counterparts elsewhere. One fifth(20.2%) of Anne Arundel County adultrecipients did not yet finish high school orreceive a GED, which is lower than thestatewide average of 26% and much lowerthan the statewide high of 34%.16.1%Note: non-Hispanic. Valid percentages reported.For adult recipients who are required towork or to participate in work-relatedactivities, educational attainment is aparticularly important characteristic, as itcan affect the job opportunities that areavailable to them. Figure 1 presentsFigure 1. Educational %18.3%20.2%11.6%10%0%13.2%Did not finish high schoolHigh1.2%Finished high schoolAverage (State)LowAdditional education after highschoolAnne ArundelNote: High refers to the jurisdiction with the highest percentage. Low refers to the jurisdiction with lowest percentage.General Education Development Program (GED) certificates are included in high school completion rates. Validpercentages reported.2
In addition, the percentage of adultrecipients in Anne Arundel County whofinished high school (and did not receiveadditional education) was higher than thestate average (68.1% vs. 63.7%). Additionaleducation beyond high school for AnneArundel county recipients (11.6%) was onpar with the state average (10.2%) and wasroughly 10 percentage points higher thanthe statewide low. This suggests that somerecipients in Anne Arundel County haveeducation or training beyond high schoolthat could lead to well-paid jobs.likely to return to TCA while adults witheducation beyond a high school diploma aremore likely to attain median annual earningsabove the poverty level (McColl &Passarella, 2019). In addition, a recentreport showed that single mothers inMaryland are less likely to live in povertyand earn substantially more after graduatingwith an associate degree (Center on Equityin Higher Education). Taken together, thesefindings suggest that additional education—either in the form of a high school diplomaor education beyond high school—couldimprove the chances of Anne ArundelCounty recipients achieving self-sufficiency.While Anne Arundel County adult recipientsgenerally have higher educationalattainment than recipients statewide,providing more opportunities for increasingeducational attainment could provebeneficial. Our research shows thateconomic stability and good jobs are morelikely when adults have more education(Nicoli, Passarella, & Born, 2013; James &Nicoli, 2016). More specifically, thosewithout a high school diploma are moreThe Maryland Department of HumanServices is already pursuing potentialstrategies for increasing educationalattainment and improving recipients’ jobskills by partnering with the MarylandDepartment of Labor’s Division of WorkforceDevelopment and Adult Learning. Careertraining and job seeker services can helpTCA recipients with any number of goals,Data and Study PopulationData comes from the Client Automated Resource and Eligibility System (CARES) and the Maryland AutomatedBenefits System (MABS), which are the administrative data systems for Temporary Cash Assistance (TCA) andUnemployment Insurance (UI), respectively. CARES provides individual- and case-level data on demographics andprogram participation for families receiving TCA. Additional data on adult recipients’ disabilities comes from WORKS,which documents participation in work and work-related activities. The MABS system includes data from all employerscovered by the state’s Unemployment Insurance (UI) law and the Unemployment Compensation for FederalEmployees (UCFE) program. Together, these account for approximately 91% of all Maryland civilian employment.There are a variety of limitations to MABS data. MABS only reports data on a quarterly basis, which means that it isnot possible to calculate weekly or monthly employment and earnings. Another limitation is that MABS does notcontain data on certain types of employment, such as self-employment, independent contractors, and informalemployment; consequently, earnings from under-the-table jobs are not included. Finally, MABS has no information onemployment outside Maryland. Approximately nine percent of Anne Arundel County residents work out of state, whichis higher than the national average (3.7%) but far below the state average (16.8%) (U.S. Census Bureau, 2019a). As aresult, we may be understating employment and some earnings. The study population in this report is the uniquenumber of adults who received at least one month of TCA in SFY 2019 (July 2018 to June 2019). Statewide, 18,510adults received TCA in SFY 2019; in Anne Arundel County 1,121 adults received TCA.3
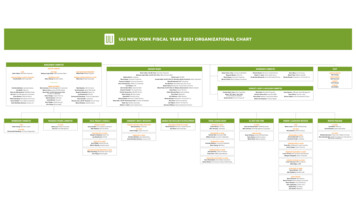
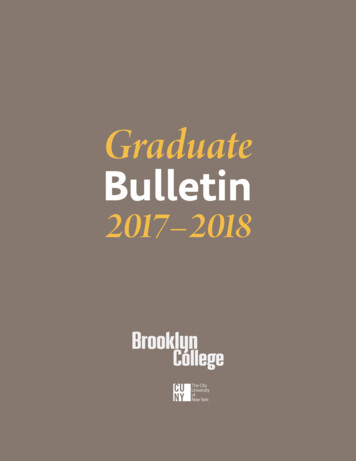
from vocational training or GED attainmentto improving interview skills. The federalgovernment encourages this type ofpartnership through the WorkforceInnovation and Opportunity Act (WIOA).Additionally, Anne Arundel CommunityCollege offers free childcare to low-incomestudents through the U.S. Department ofEducation’s Child Care Access MeansParents in School Program (U.S.Department of Education, 2019). This grantgives low-income parents a chance toobtain job training or earn a degree withoutthe costly burden of childcare.one or more applications (McColl & Nicoli,2018).Partnerships with other entities withinMaryland’s workforce development systemmay also benefit adult TCA recipients withdisabilities. Figure 2 shows the percentageof adult recipients who have disabilities thatare expected to persist for longer than 12months. The figure includes the percentagefor Anne Arundel County adult recipients,the statewide average, and the statewidehigh and low values across all jurisdictions.About one quarter (23.0%) of adultrecipients in Anne Arundel County have along-term disability, slightly less than thestatewide average, but more than thestatewide low of 16%. There are only sixjurisdictions with a lower percentage thanAnne Arundel County, suggesting that thecounty is less likely to have recipients withthis barrier than their counterparts acrossthe state.50%For those with long-term disabilities whowant to work, the Division of RehabilitationServices (DORS), located within theMaryland State Department of Education,may be an excellent resource. Like TCA,DORS is part of Maryland’s workforcedevelopment system, so this is another waythat closer collaboration with workforcepartners may benefit TCA customers.Figure 2. Percent with DisabilitiesLasting 12 Months44.2%40%30%23.0%20%10%16.1%0%HighLow1Average (State)Anne ArundelNote: High refers to the jurisdiction with the highestpercentage. Low refers to the jurisdiction with lowestpercentage. Valid percentages reported.As TCA continues collaboration with itsworkforce development partners,understanding adult recipients’ workhistories becomes even more important.The past employment experiences of adultrecipients can shape their futureemployment and earnings, or highlightopportunities for professional training orother employment services. Figure 3displays the percentage of adult recipientswho worked in the year before they beganreceiving TCA. Three in five (61.4%) AnneArundel County adult recipients wereemployed in that year, a few percentagepoints higher than the state average of 58%.All adult recipients with disabilities areeligible to receive assistance withapplications for federal disability programs,like Supplemental Security Income (SSI),and caseworkers can offer assistance withapplications for disability programs througha statewide contract with a vendor. Themajority of TCA recipients, though, do notsuccessfully receive SSI, despite submitting4
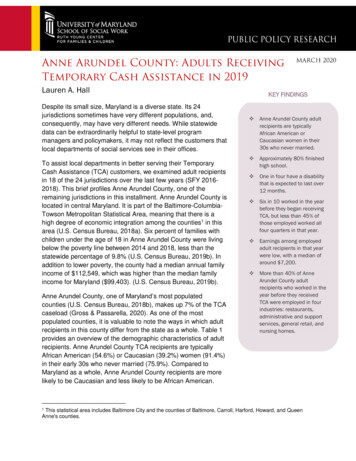
Figure 3. Percent Employed2recipients may need substantial assistanceto find employment, most who findemployment may need services to helpthem maintain employment or to navigateseasonal or short-term employment.Year before TCA Receipt90%80%71.4%70%61.4%60%Figure 4. Percent Who Worked FourQuarters50%40%Year before TCA Receipt30%39.7%70%20%60%10%0%HighLow1 Average (State)40%Anne Arundel30%43.8%29.1%20%Note: High refers to the jurisdiction with the highestpercentage. Low refers to the jurisdiction with lowestpercentage. Valid percentages reported.10%0%It is also useful to examine how manyquarters adult recipients worked in the yearbefore receiving TCA. Figure 4 presents thepercentage of employed adult recipientswho worked in all four quarters in that year.More than two in five (43.8%) Anne ArundelCounty adult recipients worked in all fourquarters prior to receiving TCA, comparedto the statewide average of 38%. Half(50.0%) of employed recipients worked forall four quarters in the jurisdiction with thehighest percentage, only a few percentagepoints higher than in Anne Arundel County.HighLow1 Average (State)Anne ArundelNote: High refers to the jurisdiction with the highestpercentage. Low refers to the jurisdiction with lowestpercentage. Valid percentages reported.Along with their employment histories, it isalso important to examine adult recipients’earnings histories. Figure 5 displays medianearnings for adult recipients in AnneArundel County who were employed in theyear before they received TCA, along withmedian earnings statewide and the highestand lowest median earnings in the 24jurisdictions. These earnings may notnecessarily reflect full-time employmentover the course of an entire year. As Figure4 demonstrated, only 44% of Anne ArundelCounty adult recipients worked for all fourquarters of the year before TCA receipt.Even though 61% of Anne Arundel Countyrecipients worked at some point in the yearbefore TCA receipt, less than half (43.8%)of employed recipients worked for all fourquarters suggesting that adult recipientsmay need more than just assistance infinding employment in order to become selfsufficient. These findings indicate that manyadult recipients work, but the majority whodo work do not work consistently over thecourse of a year. Thus, while some adult250.0%50%Anne Arundel County adult recipients whoworked earned a median of 7,235 in theyear before TCA receipt. This is about 1,000 more than the statewide average ofPlease see the sidebar on page 3 for information on employment data.5
6,298 and about 1,600 greater than thestatewide low. However, median earningsfor both Anne Arundel County recipientsand recipients statewide were substantiallylower than 21,330 the 2019 federal povertythreshold for a three-person household(U.S. Department of Health and HumanServices, 2019), and, expectedly, earningswere considerably lower than the county’smedian earnings for full-time, year-roundworkers (U.S. Census Bureau, 2019c).One strategy to increase wages focuses onthe industries in which adults work. Somejobs can be performed in a number ofdifferent industries. For example,administrative assistants may work in healthcare settings, in schools, or in private firms,but each of these industries may differ in thecompensation they offer for administrativeassistant positions. Helping adult recipientsfind employment in industries that offerhigher pay is one way to increase selfsufficiency.Figure 5. Median EarningsYear before TCA ReceiptIn Anne Arundel County, about half of allemployed residents hold positions in one ofthe following industries: (1) educationalservices, healthcare, and social assistance;(2) professional, scientific, management,administrative services, and waste services;and (3) public administration (U.S. CensusBureau, 2019c). Some of the largestemployers in Anne Arundel County fallunder these industries, such as AnneArundel Medical Center, H&R Block,Northrop Grumman, and the University ofMaryland Baltimore Washington MedicalCenter (Office of Workforce Information andPerformance, n.d.). 12,000 9,837 10,000 8,000 7,235 6,000 4,000 3,936 2,000 0HighLow1Average (State)Anne ArundelNote: High refers to the jurisdiction with the highestpercentage. Low refers to the jurisdiction with lowestpercentage. Earnings are standardized to 2019dollars.Anne Arundel County TCA adult recipientson the other hand, are more commonlyemployed in industries that may beassociated with lower earnings, as shown inTable 2. As shown, one quarter (25.2%) ofadult recipients worked in restaurants. Anadditional 11% worked in the administrativesector, 8% worked in general retail, and 7%worked in nursing homes. A few of thelargest employers in Anne Arundel Countythat fall under these industries include GiantFood, Walmart3, and McDonald’s (Office ofLow median wages may be partiallyexplained by the inconsistent work patternsdescribed in Figures 3 and 4, sinceinconsistent employment drives totalearnings down. However, it could also bethat low wages are also what precipitatesinconsistent work patterns. For example,adult recipients may not earn enough to beable to cover job-related expenses, such astransportation, uniforms, or child care, whichmay limit employment retention.3Businesses can have more than one NAICS code. The Maryland Department of Labor reports one code per business and reportsWalmart under the manufacturing NAICS code. Walmart is also represented by the three digit NAICS code 452, general retail.Please see U.S. Census Bureau for more information or for a general description of NAICS code 452.6
Workforce Information and Performance,n.d.)ReferencesCenter on Equity in Higher Education. (2019).State fact sheets: Investing in singlemothers’ higher education in Maryland.Institute for Women’s Policy r research has found that none of thetop three industries in which Anne ArundelCounty adult recipients were employed areassociated with high earnings. Individualswho left TCA and initially worked in one ofthese industries, particularly restaurants andgeneral retail, had below-average earningsand were more likely to return to TCA(Nicoli, Passarella, & Born, 2014). Theywere also less likely to realize economicstability after exiting TCA (James & Nicoli,2016). Thus, helping adult recipients findand maintain work in industries that providehigher pay to their workers, or providingtraining or other education for positionswithin these industries, may help increaseearnings for these recipients.Gross, A., & Passarella, L. (2020). Life onwelfare: Temporary Cash Assistancefamilies & recipients, 2019. University ofMaryland School of Social Work.James, A.M., & Nicoli, L.T. (2016). Economicstability after leaving welfare. University ofMaryland School of Social economic stability.pdfMcColl, R., & Nicoli, L. (2018). SSI & TCAparticipation among long-term disabledcases. University of Maryland School ofSocial Work. https://familywelfare.umaryland.edu/reports1/LTD SSI.pdfTable 2. Most Common IndustriesMcColl, R., & Passarella, L. (2019). The role ofeducation in outcomes for former TCArecipients. University of Maryland School ofSocial Work. 0Role%20of%20Education.pdfYear before TCA ReceiptRestaurantsFull-service or fast food restaurants as wellas caterers and mobile food services.(NAICS 722)25.2%Nicoli, L.T., Passarella, L.L., & Born, C.E.(2013). Welfare recipients who find goodjobs: Who are they, and what are theiroutcomes? University of Maryland Schoolof Social Work. obs.pdfAdministrative and SupportOrganizations that typically offer contractservices that support the day-to-dayoperations, such as clerical and cleaningactivities as well as general management.(NAICS 561)11.2%Nicoli, L.T., Passarella, L.L., & Born, C.E.(2014). Industries among employed welfareleavers. University of Maryland School ofSocial Work. triesbrief.pdfGeneral RetailDepartment stores and other generalmerchandise stores. (NAICS 452)8.4%Nursing HomesFacilities providing residential carecombined with either nursing, supervisory,or other types of care. (NAICS 623)Office of Workforce Information andPerformance. (n.d.). Anne Arundel County– major employer lists. MarylandDepartment of Labor. Retrieved January20, 2020, from del.shtml7.1%U.S. Census Bureau. (2018a). Metropolitan andmicropolitan. o/about.html7
U.S. Census Bureau. (2018b). Quick Facts:Population estimates, July 1, 2019.https://www.census.gov/quickfacts/U.S. Census Bureau. (2019c). Anne ArundelCounty, Maryland, Narrative Profiles. 20142018 American Community Survey 5-yearestimates. tmlU.S. Census Bureau. (2019a). B08007-Sex ofworkers by place of work—state and countylevel. 2014-2018 American CommunitySurvey 5-year estimates. data.census.govU.S. Department of Education. (2019). ChildCare Access Means Parents in SchoolProgram awards, FY19. S. Census Bureau. (2019b). DP03-Selectedeconomic characteristics. 2014-2018American Community Survey 5-yearestimates. data.census.govU.S. Department of Health and Human Services.(2019). 2019 poverty The author would like to thank Jamie Haskel and Somlak Suvanasorn for their assistance in thecollection and processing of data for this research brief, as well as Letitia Passarella for herassistance with editing this brief. This brief was prepared by the University of Maryland School ofSocial Work with support from its long time research partner, the Maryland Department of HumanServices.For additional information, please contact Lauren A. Hall (410.706.2763; lahall@ssw.umaryland.edu)at the School of Social Work.Please visit our website https://familywelfare.umaryland.edu for additional copies of this brief andother reports.8
2018). This brief profiles Anne Arundel County, one of the remaining jurisdictions in this installment. Anne Arundel County is located in central Maryland. It is part of the Baltimore-Columbia-Towson Metropolitan Statistical Area, meaning that there is a high degree of economic integration among the counties1 in this area (U.S. Census Bureau .