Transcription
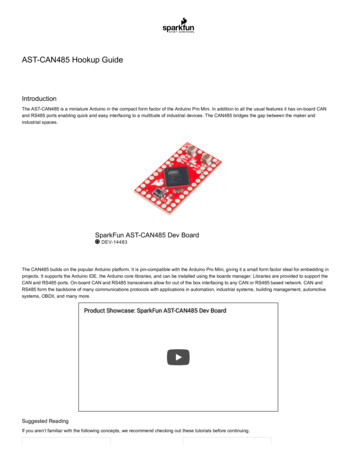
Page 1 of 8 AD8232 Heart Rate Monitor Hookup GuideIntroductionThe AD8232 is a neat little chip used to measure the electrical activity ofthe heart. This electrical activity can be charted as an ECG orElectrocardiogram. Electrocardiography is used to help diagnose variousheart conditions. Now for the disclaimer:This device is not intended to diagnose or treat any conditions.Covered in this TutorialIn this tutorial, we will go over the basics for getting your AD8232 HeartRate Monitor up and running. First, an overview of the board and all itsfeatures will be presented. Then, we’ll show you how hook it up to yourfavorite microcontroller and how to create visual data using Processing.Suggested ReadingIf you are not familiar with any of the following concepts, you may want toreview them before moving ahead. What is an Arduino?Connecting Arduino to ProcessingHow to Power Your ProjectSerial CommunicationSerial Terminal BasicsWorking with WireUnderstanding the ECGIn general terms, lets look at what an ECG is representing and how we’reable to sense it. The ECG is separated into two basic Intervals, the PRInterval and the QT Interval, described below.
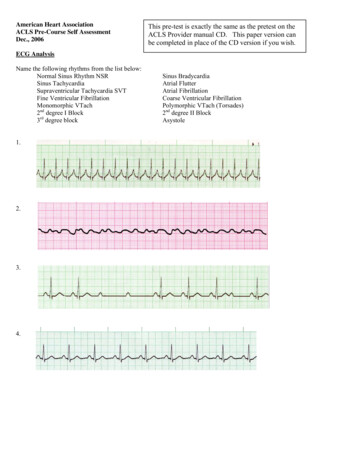
Page 2 of 8Note: All information comes from the Waves and Intervals section ofthe ECG Wikipedia page .Credit Wikipedia.orgDiagram of the heart. Credit Wikipedia.orgPR IntervalThe PR interval is the initial wave generated by an electrical impulsetraveling from the right atrium to the left. The right atrium is the firstchamber to see an electrical impulse. This electrical impulse causes thechambers to “depolarize”. This forces it to contract and drain deoxygenatedblood from both the Superior and Inferior vena cava into the right ventricle.As the electrical impulse travels across the top of the heart it then triggersthe left atrium to contract. The left atrium is responsible for receiving newlyoxygenated blood from the lungs into the left ventricle via the left and rightpulmonary veins. The pulmonary veins are red in the diagram because theyare carrying oxygenated blood. They are still called veins because veinscarry blood towards the heart. Science!QT IntervalThe QT Interval is where things get really interesting. The QRS is acomplex process that generates the signature “beep” in cardiac monitors.During QRS both ventricles begin to pump. The right ventricle begins topump deoxygenated blood into the lungs through the left and rightpulmonary arteries. The pulmonary arteries are blue in the diagrambecause they are carrying deoxygenated blood. They are still called arteriesbecause arteries carry blood away the heart. Science, Again! The leftventricle is also begining to pump freshly oxygenated blood through theaorta and into the rest of the body. After the initial contraction comes the STsegment. The ST segment is fairly quiet electrically as it is the time wherethe ventricals waiting to be “re-polarized”. Finally the T wave becomespresent to actively “re-ploarize”, or relax the ventricles. This relaxationphase resets the ventricles to be filled again by the atriums.
Page 3 of 8Heartbeat with corresponding ECG Credit Wikipedia.orgConnecting the HardwareIn this guide, we’ll connect the AD8232 Breakout to an Arduinomicrocontroller. We will build a simple cardiac monitor that will allow you tomeasure the electrical activity of the heart in real time!Materials required for this exampleAD8232 Heart Rate Monitor Example SparkFun Wish ListSparkFun Single Lead Heart Rate Monitor - AD8232SEN-12650The AD8232 SparkFun Single Lead Heart Rate Monitor is a cost-effe Biomedical Sensor Pad (10 pack)SEN-12969This is a 10 pack of Biomedical Sensor Pads, disposable electrodes t Sensor Cable - Electrode Pads (3 connector)CAB-12970This is your simple three conductor sensor cable with electrode pad le Arduino Pro Mini 328 - 3.3V/8MHzDEV-11114It's blue! It's thin! It's the Arduino Pro Mini! SparkFun's minimal design Breadboard - Self-Adhesive (White)PRT-12002This is your tried and true white solderless breadboard. It has 2 power Break Away Headers - StraightPRT-00116A row of headers - break to fit. 40 pins that can be cut to any size. Us Jumper Wire KitPRT-00124This is a time saving kit of jumper wires - cut, stripped, and pre-bent f SparkFun FTDI Basic Breakout - 3.3VDEV-09873This is the newest revision of our [FTDI Basic](http://www.sparkfun.co SparkFun USB Mini-B Cable - 6 FootCAB-11301This is a USB 2.0 type A to Mini-B 5-pin cable. You know, the mini-B
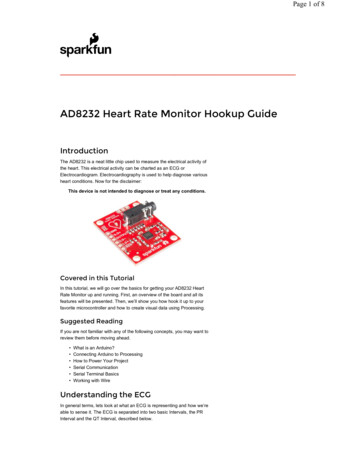
Page 4 of 8Pin ConnectionsThe AD8232 Heart Rate Monitor breaks out nine connections from the IC.We traditionally call these connections “pins” because they come from thepins on the IC, but they are actually holes that you can solder wires orheader pins to.We’ll connect five of the nine pins on the board to your Arduino. The fivepins you need are labeled GND, 3.3v, OUTPUT, LO-, and LO .Board Label Pin Function Arduino ConnectionGNDGroundGND3.3v3.3v Power Supply3.3vOUTPUTOutput SignalA0LOLeads-off Detect 11LO Leads-off Detect 10SDNShutdownNot usedConnecting Headers to the BoardYou can use any method you’d like to make your connections to the board.For this example, we’ll solder on a five-pin length of male-male header stripand use a breadboard and jumpers to make our connections.Headers installedFollow the diagram below, to make necessary connections. The SDN pin isnot used in this demo. Connecting this pin to ground or “LOW” on a digitalpin will power down the chip. This is useful for low power applications.
Page 5 of 8Connection DiagramNow that the electronics are complete, let’s look at sensor pad placement. Itis recommended to snap the sensor pads on the leads before application tothe body. The closer to the heart the pads are, the better the measurement.The cables are color coded to help identify proper placement.Cable ColorSignalBlack RA (Right Arm)BlueLA (Left Arm)RedRL (Right Leg)Sensors connected to Heart MonitorTypical Sensor PlacementsUploading the Sketch and Connectingwith ProcessingBy this point, you should have the hardware connected and ready.The example sketch can be found on github here. You can cut and pastethe code straight from github or clone the repository and open the file. Formore on using the SparkFun Github repositories, read this handy tutorial. Ifyou’ve never worked with the Arduino IDE before, please see this tutorial.
Page 6 of 8Upload sketch to Arduino Pro-MiniNow that you have a sketch running, let’s get the processing sketch ready.The processing sketch will give you a visual output of what’s going on. Theexample processing sketch can be found here.Run the Processing sketchIf the processing sketch does not work, you may need to modify thefollowing line:myPort new Serial(this, Serial.list()[2], 9600);You may need to change the parameter inside Serial.list()[N]. A List ofavailable COM ports will appear in the lower portion of the sketch window.Remember that COM port selection begins at 0. Typically your Arduino willappear as the highest COM number if it is the only device connected toyour computer.
Page 7 of 8The Arduino shows up as COM38. This is found in the Serial List at arrayelement “2”.If everything is working correctly, you should see a nice box pop up andstart displaying the output signal.“Normal” heart rate of an SFE engineerIf your subject decides to remove the sensors, the leads off detection willkick in and display a flat blue line.“Flight, we just lost Lovell!”Tips and TricksECG’s are notoriously noisy. This is because you are measuring muscleactivation. The further sensor pads are from the heart, the more musclenoise you will see. These are commonly referred to as “Motion Artifacts”.So here are some simple tips to improve the signal quality. Keep sensor pads as close to the heart as you can. Make sure the RA and LA sensor pads are on correct sides of theheart. Try not to move too much while taking a measurement. Try to use fresh pads for each measurement. The pads loose theability to pass signals with multiple applications. Prep and clean the area you plan to stick pads. This will help make agood connection (hair is not a good conductor). You may have to adjust sensor placement for different individuals.Resources and Going FurtherThanks for reading. For more resources on the AD8232 Heart RateMonitor, check out the following links: AD8232 Datasheet AD8232 GitHub RepositoryFor more Electronics Fun, check out these other SparkFun tutorials: Hacking the MindWave Mobile Misfit Shine TeardownMore Biometric products offered by SparkFun: BITalino
Page 8 of 8 Pulse Sensor Muscle Sensor v3 rt-rate-monitor-hookup-guide? ga 1.19510. 1/19/2016
This is because you are measuring muscle activation. The further sensor pads are from the heart, the more muscle noise you will see. These are commonly referred to as “Motion Artifacts”. So here are some simple tips to improve the signal quality. Keep sensor pads as close to the heart as you can. Make sure the RA and LA sensor pads are on correct sides of the heart. Try not to .