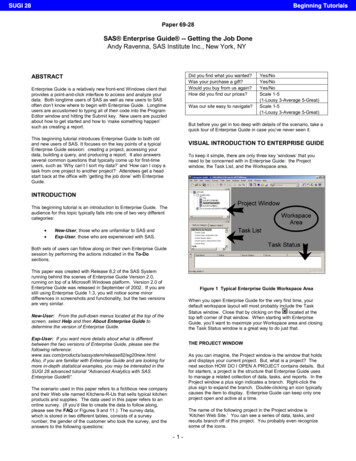
Transcription
Data WarehousingPaper 117-25Constructing a Data Warehouse for Pharmacokinetic DataS.P. Koprowski, Jr., J.S. Barrett, DuPont Pharmaceuticals Company and D.J. Fowler, SAS Institute, Inc.ABSTRACTThe construction of a warehouse using data from DuPont Pharmaceutical’s Clinical Pharmacokinetics Group with the SAS/Warehouse Administrator productis described herein. Data sources incorporated into the pharmacokinetic warehouse existed in multiple formats (Oracle, Excel, SAS data sets, etc) and wererepresented by numerous individual files, rather then few large files. In most cases, the data density enjoys low granularity. The pharmacokinetic data warehousedraws data from many sources represented by multiple departments and spans long drug development cycles with varying degrees of detail. Additionally, dataoriginated from both internal legacy systems or was obtained from an external contract research organization (CRO). Remote systems have been easily identifiedwithin the warehouse and views rather than distinct copies have been incorporated as data sources. The SAS/Warehouse Administrator product was essentialto this effort as it organized the metadata from the various operational data definitions (ODD), assisted in the cleaning / scrubbing of the data via user-writtencode, and facilitated the creation of multi-dimensional databases (MDDB), datamarts and infomarts which were front-ended by exploitation tools includingSAS/IntrNet based and SAS/EIS derived applications. More importantly, the warehouse is under the central control of a single administrator and refresh isscheduled in a manner consistent with the needs of the department using the Windows AT scheduler (Windows NT 4.0). The current data warehouse will assistin multiple aspects of electronic transmission of regulatory data: data (SAS XPORT), reports, and computer assisted new drug applications (CANDA). Thefollowing SAS systems and products discussed included Base SAS , SAS/GRAPH , SAS/Warehouse Administrator v1.3, SAS/SHARE ,SAS/CONNECT , SAS/MDDB , SAS/IntrNet v1.2, and PH.Kinetics v2.00.INTRODUCTIONThe pharmaceutical industry, like other research and development (R&D) driven industries, generates large volumes of data of various types during the process ofdeveloping new medicines to ultimately improve the quality of people’s lives. Data from early chemistry and pharmacology experiments, animal and humantesting, and various processes involved with the manufacture of such chemical entities is collated into a regulatory document (NDA, new drug application). TheNDA is reviewed by the Food and Drug Administration (FDA) and is the basis for approval of new medicines. As the information for a particular submissiongets filtered and cleaned during the time the drug is being developed (11 years on average), this data is often extracted from other in-process data or historicaldata and prepared for regulatory submission in both detailed and highly summarized formats. More recently, the industry has embraced the value of maintaininga current, historical database of successes and failures with respect to potential drug candidates to facilitate knowledge-based decisions that call upon this everexpanding R&D data environment. By the very nature of the typical infrastructure of a pharmaceutical company and the knowledge required to correctlyassemble a database within a single data-generating department, these efforts have been disjoint and difficult to centralize. The advent of tools such as theSAS/Warehouse Administrator has improved the likelihood that such efforts can be linked and that risk-benefit analyses can be based on all pertinent datasources. DuPont Pharmaceuticals is at the genesis of efforts to link data from early discovery, preclinical and clinical development and eventually post marketingand competitive surveillance groups to improve the quality of decision making regarding new chemical entities and in-process drug candidates. The details ofthis “proof-of-concept” effort are contained herein using data from the Drug Metabolism and Pharmacokinetics Department’s Clinical Pharmacokinetic Group.Data describing the safety and tolerability of new drugs in healthy volunteer populations is gathered during early phases of drug development. This data may alsoprovide information on the pharmacokinetics (PK) and/or pharmacodynamics (PD) of a compound - generally defined as the effects of the body on the drug andthe effect of the drug on the body respectively. Such data guides how new drugs are dosed in the patient population for which the drug is ultimately intended.Most recently, data demonstrating the differences in PK and PD due to age, Disease State, and other patient characteristics, which distinguish the patientpopulation from the healthy volunteers, has been gathered and appreciated. The pharmaceutical industry in conjunction with the FDA has sought to examine PKand PD behavior in more relevant populations and in patients themselves when possible.This desire has precipitated the need to pool and query PK and PD data across the numerous studies that may be conducted with a specific drug candidate.Population-based analysis is a model-based statistical approach used to examine the pharmacokinetic/pharmacodynamic behavior of new chemical entities in thepatient population for which the drug is intended. It often encompasses study-related (SR) data (laboratory and clinical) from several trials of which the designmay not be the same. Moreover, this technique involves the combination of data from several sources with predefined variable and file architecture based onprotocol declaration. The creation of combined data set containing PK, PD, and SR data is a milestone in the timeline of the population analysis. The lifetime ofsuch efforts typically occurs just prior to the NDA submission. Hence, the necessity of early planning and efficient coding is essential to: (1) provide “clean” datasets, (2) define partitions to construct randomized test and validation data sets, and (3) allow both construction of combined PK/PD/SR data sets and MDDBs forsubsequent queries or incorporation into exploitation tools. The need to create population analysis data sets was the initial motivation behind the warehousingeffort within the Clinical Pharmacokinetic Group at DuPont Pharmaceuticals. In actuality, it represents a single of many advantages provided by the combinationof the PH.Kinetics and Warehouse Administrator products.METHODSData SourcesOur goals were to build a data warehouse: To identify meta data for PK common repositoryTo created detail tables, including SR, PD and adverse clinical effect (ACE) dataTo provide data for users to create ad hoc queries, analyses, and reports over the intranetFacilitate easier creation of population PK/PD/SR data setsUltimately, to create data that can be ported directly to our electronic publishing systems (Core Dossier and Documentum), to be used inelectronic submissions to the FDA and other regulatory agencies.Data currently available in the warehouse site is derived from several departments including Drug Metabolism and Pharmacokinetics, Safety Assessment,Medicinal Chemistry, Clinical Pharmacology, and Biometrics. The Drug Metabolism and Pharmacokinetics department is composed of six different and diversegroups including Clinical PK, Pre-Clinical ADME/GLP, Discovery Support, Bioanalytical/Structural Chemistry, InVitro/Biotransformation, and IsotopeChemistry. Figure 1 illustrates the connection of the individual groups and their customers outside the department as well as the internal relationship of thegroups.
Data WarehousingDRUG METABOLISM & PHARMACOKINETICS DEPARTMENTTO:Pharmacologyand and MedicinalChemistryDiscoveryPre-clinical PKClinical PKTO:ClinicalPharmacologyand ClinicalResearch viaBiometricsBioanalyticalFigure 1. DM&PK DepartmentHistorically, data has been obtained from the clinical, pre-clinical, discovery and biometrics groups upon request in SAS files stored on the VAX Alpha runningopen VMS , or as PC SAS data sets. We also get data from the same sources in the form of Microsoft Excel worksheets and as Oracle tables. In addition, wemay get clinical and pre-clinical study protocol data directly from our Watson-Oracle Laboratory Information Management System (Watson-LIMS)(See Figure 2).The clinical and pre-clinical data typically include time, concentration and pharmacokinetic data. Pharmacodynamic, demographics, or adverse clinical events(ACE) data is obtained from the Biometrics Department. Demographic and adverse clinical event (ACE) data (SAS data sets) are merged across study.Pharmacokinetic data is either generated by our in-house, user written legacy Pharmacokinetic Information Management System, PK-IMS (a proprietary RS/1application residing on a VAX cluster running VMS), CRO data, or through the use of PH.Kinetics . The latter product is discussed in detail in a separate paperentitled, “The integration of PH.Kinetics with a clinical data warehouse.” Tables containing descriptions for a variety of data entries, such as randomizationschedules, study medications and plasma / urine sample collection information is also stored as SAS files on VMS. Our target user platform is a Pentium PC(running Windows NT with a minimum of a 200 MHz processor and having a minimum of 64mb ram) connected to the company network via TCP/IP, whichconnects us to the VAX Alpha mainframe and other systems. Users will access exploitation tools through the company Intranet using SAS/IntrNet as well asthe local area network (LAN). The company web-browser standard is Netscape Communicator 4.6. The network operating system is MS-Windows NT Server,connected via SAS/CONNECT and SAS/SHARE software.
Data WarehousingFigure 2. Data SourcesTransformation: Validation, Scrubbing, Integration, and StructuringTransformation of PK and PD data involves data validation, data scrubbing, integration, and data structuring. Generating a frequency report is usually done tohelp with data validation or screening of the data to remove duplicate values, invalid, out-of-range, or missing values. Values obtained in the frequency report arethen compared to values in a look-up table. Removing invalid, out-of-range, missing or duplicate values cleans data. Frequently, PK data has parameters definedin multiple attributes, such as, CL or CLO for clearance, AUCINF or AUCT for area under the curve from time 0 to infinity, or V or Vss for volume ofdistribution (see figure 3). Pharmacokinetic data parameters may have data values that are below quantifiable limits (BQL), BLQ, ‘.’, or 0. Values listed as BLQor BQL are recoded as 0, ensuring that the PK parameter remains as numeric input. Ensuring PK values remain as numeric input allows us to summarize PKparameters across compounds, studies or therapeutic areas.StudyDMP266 026DMP266 027DMP266 027PK ure 3. Example of study, Gender, Race, and PK parameter inconsistencies that exist in PK dataInitially, study naming was not consistent across data sets. “Study” in demographics data set may have a data value defined as DMP266 026 while “study” in aconcentration data set may be defined as 266-026. Another example of data cleaning occurs when we have to remove custom formats applied to a data set whenthe format is missing from the format catalog (see figure 4). Other cleaning tasks involve removal of unnecessary columns or the addition of columns to provideusers with needed subject information. We removed columns such as CRF page 1, CRF comment 1. Age was added to the demographics data sets by definingAGE as “Date of Consent” minus “Date of Birth.” Another feature of using the SAS/Warehouse Administrator software is the flexibility to insert user-writtencode at various stages of the cleaning process or simply to transform the data. This code is easily ported to run at many levels and hence code conservation isencouraged. Again, this facilitates the ability of a single administrator to maintain the warehouse.libname userlib 'H:\clinical dw\user exit temp data files’;%let syslast dt266.dt26629d;data userlib.UE26629d;set dt266.dt26629d;format doublee;run;%let syslast userlib.ue26629d;Figure 4. Example of user written code to remove a custom format
Data WarehousingThe Data WarehouseThere were five main steps used to construct the data warehouse for clinical pharmacokinetic data using SAS/Warehouse Administrator : define a warehouse environmentdefine Operational Data Definition (ODD) groupings and associated ODDsthe warehouse elements-detailed and summarized datadefine the processes needed to move data into and through the warehouseload the warehouseThe physical location of the warehouse environment metadata is done with a LIBNAME statement. Shared metadata at the environment level, exists as librarydefinitions for the location of warehouse elements, definitions of hosts (Local and VMS), contact information for the administrator and Investigators responsiblefor the data, and finally connections to the DBMSs (i.e., Oracle). Defining libraries for hosts or a DBMS is straightforward (see figure 5). Our SAS data librariesare collections of SAS files related by compound. SAS files come in several varieties. Most of the SAS files in our data libraries are data sets and data views.Usually, we create SAS data sets by importing data from other (external) sources such as Excel files (either Excel 97, Excel 95/5.0, or Excel for the Macintosh),Oracle databases, or from other sources. The Excel files are created using the SAS import wizard, by using SAS/ACCESS to PC file formats or usingSAS/ACCESS to ODBC.Figure 5. Example of defining a remote host with SAS/CONNECTSome libraries are VAX directories (see figure 6) containing files and SAS data sets of related study information, or on the company file server in locked filedirectories. Each file is indexed with the study compound of interest.Figure 6. Example of defining a remote libraryOur data warehouse environment shares three main operational data definition (ODD) groups; demographic, concentration, and pharmacokinetic. To define anODD group to the environment you assign a name, description, an owner (Investigator) and an administrator (builder of the ODD). There can be an unlimitednumber of ODDs for each ODD grouping. Because the ODDs are stored at the environment level, they are available to any warehouse stored within the sameenvironment. To define the SAS tables or SAS views that will store the data from the operational data source, you define the general, data location and columnstab of the ODD (see figure 7). The general tab will store information about the ODD’s name, which is the owner, who is the administrator, and a description ofthe ODD. The warehouse elements or children may include data warehouses, subjects, summary, detail logical tables, and detail tables. A data warehouse can bethought of as repository of shared metadata among the warehouse elements. The warehouse holds large volumes of integrated read-only data. As a combinationof SAS and non-SAS users, our data warehouse environment contains five warehouses, Anti-Inflammatory, Central-Nervous System, Cardiovascular, Virologyand Radiopharmaceuticals. Within each warehouse, subjects, detail logical tables, detail tables, summary groups, summary tables, data mart groups, data marts,info marts, info mart items may be added. We will explore subjects, data mart groups, and data marts and summary items in further detail.
Data WarehousingFigure 7. Example Operational Data Definition Properties WindowTherapeutic/franchise business areas (virology, cardiovascular, central-nervous system, anti-inflammatory, etc.) comprise the different warehouses. Subjectgroupings within a warehouse are by compound. A subject may be comprised of different types of data including any of the following: SAS data sets, SASMDDBs, charts, reports, or graphs. Within the “General” tab, a subject name, description of the subject, an owner (Investigator in our warehouse), and anadministrator define a subject. After all the subjects were added for a particular subject group, we then added Data Mart groupings (see figure 8). In our clinicalpharmacokinetic warehouse, within a subject group, the Data Mart Groups are categorized by compound name. Categorizing the warehouse by therapeutic areaand study will also facilitate future data mining needs.Not wanting end users to access the actual physical data in the warehouse, we added data mart groups within each of the subject groups. The data mart groupswere created within each subject grouping to hold summary data or tables containing the joined ODDs. Each data mart group was related to the subject. Thecompound name is a data mart group. One data mart was created for each for each ODD group. For example, data marts were created within the SUSTIVA data mart group for demographic, pharmacokinetic parameters, and concentration ODDs. Finally, a data mart was created that contained all other data marts, i.e.;a data mart (all SUSTIVA data) was created to contain the joined data mart items of demographics, PK, and concentration. After the data mart items werecreated, detail logical tables were created as grouping elements. To be consistent in naming, the names of the detail logical tables were the same as the data martgroups.Figure 8. View of Subject groupings across therapeutic area by compound data mart groupDetail tables were then added to the detail logical tables. A subject could only have one detail logical table assigned to it but may contain many detail tables. Themajor advantage of detail tables over data marts are that they can be defined once and linked to many different subjects. When defining the physical storagelocation of the detail table, SAS/Warehouse Administrator , allows you to assign passwords for read, write, and alter access. You may also define indexes or
Data Warehousingadd compression and encryption options. We did not compress our data due to the relatively small size of the data and the increase in CPU time required inprocessing the files. The encryption option allows you to impart security to the SAS data when outside of SAS software.To this point in the construction process, individual warehouse elements (subjects, detail logical tables, data mart groups, etc.) and their associated propertieshave been defined but no relationships exist between the operational source data and tables within the warehouse and data have yet to be loaded into thewarehouse. The final steps needed for constructing a data warehouse for clinical pharmacokinetic data are defining the relationships (processes) between theinput source data and the target data, and loading the warehouse.The four types of processes are: data transfersoperational data mappingsuser exitsrecord selectorsThe most often used processes by our warehouse are user exits, data transfers, and operational data mappings. Unfortunately, for each warehouse process andload step in the flow, source code must be generated. Once input sources for the ODDs have been defined, data transfers from the remote host to the local hostcan be defined. A data transfer is required to move data from one host to another or when an input source and the target data reside on different hosts (see figure9 for example of SAS/Warehouse Administrator generated source code).libname DT266 "H:\Clinical DW\Data Transfer";options comamid tcp;%getusrpw(platform MVSALPHA,macrovar tcpSEC, data SASUSER.ENCRYPT,destuser koprowsp);filename rlink "C:\SAS\connect\saslink\tcpvms.scr";%let MVSALPHA 111.111.111.111;signon MVSALPHA;rsubmit MVSALPHA;proc DOWNLOAD out DT266.DT26629D status no;run;endrsubmit;Figure 9. Example of SAS/Warehouse Administrator generated code for data transferOperational data mappings sift multiple columns from one or more ODDs into a single detail table. Operational data mappings can be unions(ODDs that are appended, see figure 10), joins (ODDs are merged by one or more common columns) or simple merges (one ODD to a detail table).SAS/Warehouse Administrator generates most of the code for loading the warehouse. However, these related but separate bits of code need to be linkedtogether to form one set of code to enable the output of one process to become the input of the next process in the loading of the warehouse. SAS/WarehouseAdministrator does this with use of a macro variable. The SYSLAST macro variable links the output data and input data for each process to be loaded into thewarehouse. Typically, the source code is run in interactive mode, but the code can be saved (as a catalog entry or external file) and executed at a later time. Thiswould be useful for refreshing the warehouse in a batch mode with a scheduler such as AT Scheduler.Once the entire table has been loaded into the warehouse, summary groups, tables and MDDBs can be added. Summary data are used for querying and reporting,and therefore an important part of any warehouse. Summary data with class and analysis variables are easily generated with the software. Statistics can be addedfor the analysis variables. Available statistics include sum, count, average, min and max. In our clinical pharmacokinetic data warehouse we were easily able toview the minimum and maximum as well as, the average age of subjects in the clinical studies. We can also look at average pharmacokinetic parameters such asclearance, half-life, AUC, AUCtau, etc. across studies within a therapeutic class. Summary MDDBs are as easily created as summary tables. The MDDB couldthen be used in custom EIS applications, queried against with the output sent to a company Intranet for further exploitation.
Data WarehousingFigure 10. Process Editor view showing example of Union or appending of multiple ODDsRESULTSDISCUSSIONThe creation a clinical pharmacokinetic data warehouse within the Drug Metabolism and Pharmacokinetics section of the DuPont Pharmaceutical Company, hasenabled us to have centralized control of the section’s data, consistency and unique generation of study tables and figures, elimination of redundancy, andincreased analysis functionality through improved connectivity. We are now able to pool PK data with other data (demographic, safety, PD) across studies andacross compounds within a therapeutic class. This data was then easily ported to EIS applications. We can perform further summarization and analyses on thedata across the company Intranet (see paper entitled “Exploitation of Clinical Pharmacokinetic Data over a company Intranet: Strategies and Practices”).Eventually, we will be able to evaluate biopharmaceutical classification relative to PK/PD performance—in vitro/in vivo correlation. Ultimately, the creation of aclinical pharmacokinetic warehouse should enable us to make better decisions based on data and decrease development time.REFERENCESBuilding a Data Warehouse using SAS/Warehouse Administrator course notes, Chapters 1, 2, 3, 4, 5 and 6Strategic Data Warehousing Principles Using SAS Software, Peter R. Welbrock, Chapter 4SAS/IntrNet Software Version 1.2SAS Software 6.12 TS055SAS/Warehouse Administrator Software Version 1.3Constructing a Data Warehouse, Curtis A. Smith Proceedings of the 24th SAS Users Group InternationalSAS, PH.Kinetics, SAS/CONNECT, SAS/SHARE, SAS/ACCESS, SAS/IntrNet, SAS/GRAPH, SAS/FSP, SAS/STAT, SAS/EIS, SAS/MDDB andSAS/Warehouse Administrator are registered trademark or trademark of SAS Institute Inc. in the USA and other countries. Indicates USA registration.Macintosh is a registered trademark of Apple Computer Company. VAX, Open VMS, are registered trademarks or trademarks of Digital EquipmentCorporation. Pentium is a registered trademark of Intel. Oracle is a registered trademark of Oracle Corporation. MS-Windows NT is a registered trademark ofMicrosoft Corporation.Other brand and product names are registered trademarks or Trademarks of their respective companies.ACKNOWLEDGEMENTSThe authors would like to thank Tim Bara, Systems Analyst of the DuPont Pharmaceuticals Company for his help in configuring software,knowledge and expertise of VAX systems and network administration, as well as, his support and encouragement for this and other projects withinthe Drug Metabolism and Pharmacokinetics Department.CONTACT INFORMATIONStanley P. Koprowski, Jr.DuPont Pharmaceuticals CompanyStine-Haskell Research CenterP.O. Box 30 (1090 Elkton Road)Building 112Newark, DE 19714Questions: e-mail the author at Stanley.P.Koprowski@dupontpharma.com
may get clinical and pre-clinical study protocol data directly from our Watson-Oracle Laboratory Information Management System (Watson-LIMS) (See Figure 2). The clinical and pre-clinical data typically include time, concentration and pharmacokinetic data. Pharmacodynamic, demographics, or adverse clinical events .