Transcription
HindawiWireless Communications and Mobile ComputingVolume 2021, Article ID 7443676, 11 pageshttps://doi.org/10.1155/2021/7443676Research ArticleOnline Data Migration Model and ID3 Algorithm in SportsCompetition Action Data Mining ApplicationLi Ju ,1 Lei Huang,2 and Sang-Bing Tsai31Department of Physical Education, Guangxi Medical University, Nanning, Guangxi, 530000, ChinaBeijing Sport University, Beijing, 100000, China3Regional Green Economy Development Research Center, School of Business, WUYI University, China2Correspondence should be addressed to Li Ju; juli12342010@sina.com and Sang-Bing Tsai; sangbing@hotmail.comReceived 2 June 2021; Revised 20 June 2021; Accepted 1 July 2021; Published 10 July 2021Academic Editor: Yuanpeng ZhangCopyright 2021 Li Ju et al. This is an open access article distributed under the Creative Commons Attribution License, whichpermits unrestricted use, distribution, and reproduction in any medium, provided the original work is properly cited.The ID3 algorithm is a key and important method in existing data mining, and its rules are simple and easy to understand and havehigh application value. If the decision tree algorithm is applied to the online data migration of sports competition actions, it cangrasp the sports competition rules in the relationship between massive data to guide sports competition. This paper analyzes theapplication performance of the traditional ID3 algorithm in online data migration of sports competition actions; realizes theapplication steps and data processing process of the traditional ID3 algorithm, including original data collection, original datapreprocessing, data preparation, constructing a decision tree, data mining, and making a comprehensive evaluation of thetraditional ID3 algorithm; and clarifies the problems of the traditional ID3 algorithm. Mainly, the problems of missing attributesand overfitting are clarified, which provide directions for the subsequent algorithm optimization. Then, this paper proposes a k-nearest neighbor-based ID3 optimization algorithm, which selects values similar to k-nearest neighbors to fill in the missingvalues for the attribute missing problem of the traditional ID3 algorithm. Based on this, the improved algorithm is applied tothe online data migration of sports competition actions, and the application effect is evaluated. The results show that theperformance of the k-nearest neighbor-based ID3 optimization algorithm is significantly improved, and it can also solve theoverfitting problem existing in the traditional ID3 algorithm. For the overall classification problem of six types of samples oftravel patterns, the experimental data samples have the characteristics of high data quality, a considerable number of samples,and obvious sample differentiation. Therefore, this paper also uses the deep factorization machine algorithm based on deeplearning to classify the six classes of travel patterns of sports competition action data using the previously extracted relevantfeatures. The research in this paper provides a more accurate method and a higher-performance online data migration modelfor sports competition action data mining.1. IntroductionSports competition is a competitive recreational activitybased on certain sports rules and is a very important formof sports activity. The viewing of sports competitions playsa unique role in meeting the exercise needs of people. Sincetheir inception, sports competitions have attracted manyparticipants and spectators with their unique charm [1].However, when people study sports competitions, they tendto pay more attention to the technical factors and how topromote the level of competition, but few people study sportscompetitions from the aesthetic level, to explore the deep-seated reasons why sports competitions are so attractive topeople, and to develop a certain ideal space for sports competitions. In recent years, clustering technology has been developing, both in terms of clustering technology and clusteringapplications, and academics have made multifaceted researchon clustering algorithms; recommendation algorithms havebeen applied to the Internet in recent years, and theincreasingly diverse society has led to the rapid developmentof recommendation algorithms [2]. Applying data miningrelated methods to sports competition action data miningcan solve the situation in that the number of athletes is hugeand the condition of the sport is complex and changeable,
2which can effectively solve the problems faced by sportscompetition [3].By comparing the previously learned knowledge with thenew knowledge, we can find out whether there is a similaritybetween the two, and it is this similarity that forms the basisof transfer learning [4]. At present, it seems that suchsimilarity exists in the vast majority of data, which allowsmigration learning to be widely applied to many areas ofmachine learning. Usually, the training of convolutional neural networks does not start from scratch, because as the sizeof the dataset increases, the time required to train the modelis still long even with good hardware performance [5]. Thisavoids the problem of a long training time. The use of migration learning can mainly save the cost of model training,improve the efficiency of model training, and also optimizethe final results. At the theoretical level, migration learningcan be applied to any relevant domain with good results[6]. However, if the similarity between the models to betrained and the pretrained models is not good enough, thefinal results will not be good or even negative migration willoccur, so the similarity between the models is the cornerstonefor migration learning [7]. Clustering is a machine learningtechnique that involves the grouping of data points. Given aset of data points, we can use a clustering algorithm to divideeach data point into a specific group. Theoretically, datapoints in the same group should have similar attributesand/or features, while data points in different groups shouldhave highly different attributes and/or features. Clustering isan unsupervised learning method and is a common statisticaldata analysis technique used in many fields. In data science,we can use clustering analysis to gain some valuable insightsfrom our data.Currently, the amount of research on decision treealgorithms is increasing, and the focus of research is mostlyon the improvement and optimization of decision treealgorithms to improve the classification accuracy of decisiontree algorithms, the application effect of decision tree algorithms, and the improvement of the decision tree pruningprocess to improve the comprehensive application effect ofdecision tree algorithms. The machine learning method is amethod in which a computer uses its data to derive a certainmodel and uses these models to predict the future [8]. Thisprocess is like the human learning process, except thatmachines can analyze large dimensional data and are tireless.The study is described as follows. Chapter one is an introduction, which first analyzes the background and significance ofstudying the application of decision tree techniques andtransfer learning in sports competition action data mining,and provides an overview of the research content. Chaptertwo provides an in-depth analysis of the collected domesticand international research data and grasps the status ofdomestic and international research. Chapter three introduces the data processing and migration models, as well asthe design study of data mining classifiers; evaluates theapplication effect of the optimized ID3 algorithm in sportscompetition action data mining; and proposes an applicationof sports competition action data mining based on the optimized decision tree algorithm according to the evaluationresults. Chapter four analyzes the research results of thisWireless Communications and Mobile Computingpaper and evaluates the overall effect of sports competitionaction data mining application. Chapter five is the conclusionand outlook, which summarizes the conclusions obtained byconducting this study and proposes further research directionsand priorities for the shortcomings in the research conclusions.2. Related WorkClustering is an unsupervised machine learning approachthat aggregates data items, observations, or feature vectorsinto groups. Currently, clustering techniques have beendeveloped significantly, and as an important branch of datamining, clustering techniques have diverse applications invarious fields [9]. Karmani et al. proposed a maximum edgeclustering (MMC) method, which is based on the supportvector machine model. The results of the study proved thatthe clustering results are better than the K-Means algorithm[10]. In web data mining, structured text processing withstructural and semantic coincidences is a challenge in thefield of data mining, and processing XML document data isa challenge. Ma and Tsai used the tree meta-ancestorapproach to identify XML document data and use clusteringmethods to process these data and make experiments accordingly [11]. When the number of athletes increases, it is notpossible to effectively personalize the decision based onindividual circumstances, so the efficiency is low and theresponse strategy and results are not satisfactory. In termsof data mining, we can automate the modeling process anduse a series of techniques such as clustering and recommendation algorithms to help experts make recommendationsand give coping strategies for different aspects of athletes,which is rarely done in sports competitions [12].With the in-depth study of sports competition, the studyof the ideas and theories of sports competition has penetratedall fields of sports. Gao et al. analyzed basketball comprehensively from two perspectives, the core level and the auxiliarylevel, which involved many aspects of basketball such as thebody, technique, tactics, stars, confrontation, spirit, style,and the beauty of form, costume, and field equipment, whichhave positive significance for the study of the characteristicsof basketball sports competition [13]. When the number oflayers of neural networks increases, the learning ability ofneural networks does not improve but, on the contrary,may become worse, which was later proven to be due to thedisappearance of gradients [14]. Xie and Ma proposed theSVM algorithm, which became the mainstream of machinelearning algorithms at that time because of its excellentmigration performance that demonstrated greater advantages over neural networks in many problems [15]. Fujinet al. proposed the convolutional neural network (CNN),which is the first deep learning algorithm with the practicalsignificance of a multilayer network structure [16]. It usesthe spatial relativity of data and a human visual neuralstructure to reduce the number of network parameters, thuseffectively improving the performance of the model [17]. Agood data preprocessing method not only eliminates structural defects in the existing data but also prepares the datafor data mining. The period of archery movements amongindividuals is not equal, and there are differences in the
Wireless Communications and Mobile Computingtiming of applying movement techniques at each stage.Equal-width discretization is suitable for handling complex data with chaotic data structure and strong datacontinuity [18].Data mining algorithms such as association rules, clustering, and Markov-based data mining algorithms have beenintensively studied and applied in sports competition actiondata mining to achieve the set research objectives. Severalspecialized data mining tools have been developed for different domains. The diversity of data mining tasks determinesthat data mining faces many challenging topics [19]. For datamining researchers, designing data mining languages, adopting efficient and useful data mining methods, and developingsystems to build interactive and integrated data-miningenvironments are the main issues. Processing the collectedkinematic data of sports competitions into a standard datastructure suitable for use in data mining techniques is a majorchallenge. Since the speed of different athletes’ sports movements varies, the preprocessing of the data is necessary toensure the integrity of the data and the structure of the data.How to adapt kinematic data to data mining techniquesrequires a lot of experimentation and detailed analysis. Weanalyze the strengths and weaknesses of the models studiedin the relevant references and use them to determine ourown research model.3. Online Data Migration Study of SportsCompetition Action Based on ID3 Algorithm3.1. Data Processing. A suitable data model is built based onthe dataset and the meaning it is intended to convey. Thedata being analyzed is the training set, and each attribute corresponds to a class label. The samples are randomly selectedfrom the training subset samples divided by the trainingdataset, and the data are classified under the guidance ofthe class label number, which is often referred to as guidedlearning. The concept of guided learning is that this dataanalysis knows exactly which class is guiding the trainingsamples, as opposed to not knowing which class is guidingthe training samples, unguided learning, or what is calledclustering. Data analysis is performed on the decision treethat has been constructed. There are many ways to performdata analysis on decision trees; generally, the accuracy ofthe decision tree is analyzed first, because if a decision treecannot guarantee its accuracy, the other data analysis losesits meaning. Therefore, the accuracy rate indicates the proportion of data that can be correctly classified by the decisiontree classification algorithm and is the most important measure. We generally use the known information rules as thestandard and compare the results inferred from the modelconstructed with the decision tree with the standard [20]. Ifthe comparison results are very different, the accuracy rateis lower, and if the difference is smaller, the accuracy rateis higher.Data mining, also known as database file expertise discovery (KDD), is the noncommon process of obtaining reasonable, novel, potentially effective, and finally understandableways from a lot of data. Preprocessing is an important component of the association analysis of datasets. Noise elimination,3data synthesis, and data standard unification are performed onthe dataset using preprocessing to facilitate the subsequentdata management analysis. In general, the specific requirements of preprocessing are the following: first, the smoothingof the processed dataset, mainly to eliminate the noise in thedata, using box division, clustering, and query techniques; second, the synthesis of the dataset, using a concept hierarchy,replacing the low-level “raw” data with high-level concepts;and third, ensuring the standardization of the data—scalingattribute data into a small specific interval [21].Let the set of datasets be D and the data samples in thedataset D bed. Assume that the dataset D has m different classattributes with different values, which are labeled as Bi(i l, 2 n). Therefore, the amount of classification information can be expressed by equation (1), where the weightof class attribute Bi is expressed by bi , which can be calculatedby bi /d. The logarithmic function with a base of 10 is usedhere because the information is encoded in binary.nf ðDÞ bi ln bi :ð1Þi 0Suppose that one of the attributes, here denoted as A, hasv different values, which can be denoted as fb1 , b2 bm g.Thus, the dataset D can be divided into v different subsetsby the attribute A, here denoted as fD1 , D2 Dm g, whereD j (j l, 2 m) is denoted as the set of samples with thesame value b j (j l, 2 n) on the attribute A set. Supposebij denotes the total number of samples belonging to categoryBi in subset D j . The formula for calculating the informationentropy of attribute A is shown in (2), and f ðxÞ denotes theproportion of the number of samples with the value b j tothe total number of samples for attribute A.8 n bij f ðxÞ i , d!mn : GðDÞ f ðxÞ j f bij :j 1ð2Þi 1The information gain of attribute A can be calculatedfromH ðAÞ GðDÞ GðDA Þ:ð3ÞDeep learning is proposed in response to the shallowlearning phenomenon of mechanical learning, rote learning,and knowing what is right but not knowing what is wrong inpractice. The “depth” here refers to the depth of learning ofstudents. We do not require teachers to adopt a fixed modelor method but rather emphasize that teachers should useappropriate methods to trigger, promote, and enhance students’ deep learning. In this sense, deep learning is the opposite of shallow learning, and it is a criticism of the times.The strategy of the decision tree classification algorithmis to calculate the information gain rate of all the test attributes in the alternative dataset and to use the attribute with
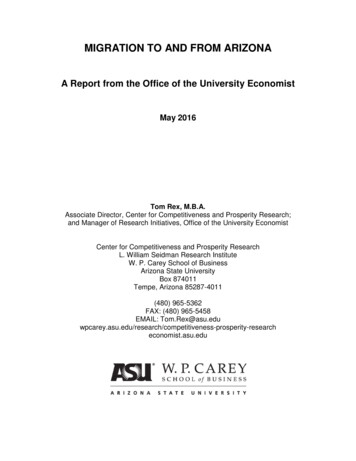
4Wireless Communications and Mobile Computingthe maximum information gain rate as the current divisionattribute and finally to complete the construction of thedecision tree by iterating the above process. The data wereanalyzed using divisional clustering, but the results werefound to be unsatisfactory and not well differentiated [22].Therefore, when conducting the reason analysis, the smallamount of data and many data dimensions may have animpact on the clustering results, and the improved algorithmwas considered according to the characteristics of sportscompetition action data. The improvedK-Means algorithmis applied to the sports competition action data to mine theclustering results. The normalization formula is shown inequation (4), where max and min sub another andJis themaximum and minimum values of the sample data.F ðx Þ x min ðGðDÞÞ:max ðGðDÞÞ min ðGðDÞÞð4ÞClustering all attributes of the data makes the clusteringresults reflect the relationship between metadata more fully;on the other hand, in cluster analysis, the attributes of thetuple inevitably form high attribute clusters with similarity.Due to the attributes of all data, clusters have the characteristics of clustering, and each group of data within its data cluster contains attributes; the formation of attribute clusters oneach attribute will inevitably occur simultaneously. In otherwords, if the number of tuples in the dataset presatisfies theminimum support, then the cluster formed by all attributeclusters becomes the maximum item frequency set of the datacluster [23].3.2. Online Data Migration Model Construction. To addressthe problem of changing the cost of online data, this paperproposes an adaptive cost-sensitive online migration learningmethod. First, we introduce the marker distribution into thetraditional hinge loss function to calculate the classificationcost adaptively; second, we combine the source and targetdomains using the combination parameters to realize theonline migration from the source to the target domain; finally,we migrate to learn the classification model based on both costand accuracy [24]. For each sample, we automatically calculatethe adaptive cost of that sample based on the ratio of the current sample polarity to the polarity of all samples and then addthe adaptive cost to the fusion to the loss function and use it toiteratively update the classification model to obtain the currentlatest classification model. The online data migration model inthis paper is shown in Figure 1.When the sample mx is read, the positive and negativeratios in the sample set at the previous m moments willchange, which will inevitably cause the final classificationmodel to have a learning bias for some samples. To reducethe impact of this change, the current ratio of positive andnegative samples and the ratio of the loss of the currentsample to the total loss are multiplied together anddenoted as Dm , as in equation (5). Where H m and H mrepresent the number of positive and negative samples,respectively, gðbm , ym , f ðxm ÞÞ is the cost hinge loss functionwith introduced cost and gðDm , bm , ym , f ðxm ÞÞ is the lossfunction with introduced marker distribution parameters.Y ðm Þ H mgðbm , ym , f ðxm ÞÞ 100%: H m mi 0 gðDm , bm , y m , f ðxm ÞÞð5ÞCombining multiple weak classifiers using weight parameters to obtain a strong classifier is the β common approach.The adaptive cost-based online migration algorithm similarlycombines the initial classifier f ð0Þ and the online adaptationfunction wðmx Þ by combining the parameters β to obtain acombined classifier.Classifier βf ð0Þ ð1 βÞwðmx Þ:ð6ÞIn the online migration learning process, we aim to updatemx 1 to mx using a suitable algorithm. The classification modelis obtained based on both smoothing and minimizing the costsum. The distance between mx 1 and mx is smoothed usingEuclidean distance as in!ðmx mx 1 Þ2, x ½0, m :ð7ÞM ðxÞ min2The cost changes as the online data changes, so it is necessary to find a way to make the cost change adaptively. Themisclassification cost is updated adaptively using the ratio ofpositive and negative samples, and the updated cost can beused to dynamically adjust the learning of the classifier for different samples. Since the cost of rare samples is usually high, aclassifier based on adaptive cost tends to improve the classification accuracy of rare samples, which in turn improves theperformance of classification.The availability and prevalence of large amounts of dataand the use of tools to properly extract knowledge information have become very frequent. This fact has changed thetraditional data analysis by orienting the data to certain specialized techniques under data science. In short, data sciencecan be considered as a discipline that discovers new andimportant relationships, patterns, and trends after examininglarge amounts of data. Thus, data science techniques pursuethe automatic discovery of knowledge contained in information stored in large databases.The structural similarity matrix is used to describe thedistribution between a descriptive attribute and a categoricalattribute; the number of occurrences of all attribute values ofeach descriptive attribute under all attribute values of the categorical attribute and the attribute values of the categoricalattribute are used to obtain the values with the highestnumber of overlaps to participate in the next step. The structural similarity matrix model will create a matrix for eachdescribed attribute to provide the corresponding parametersfor calculating the sample structural similarity.Since the sample structural similarity of the attributes iscalculated based on the structural similarity matrix, we canassume that if the structural similarity matrix is verified tobe free of multivalued bias, we can conclude that there is nomultivalued bias through the sample structural similarity ofthe attributes [24]. And if it can be verified that there is nodefinite size relationship between the structural similaritymatrix and the increase of attribute values and since the
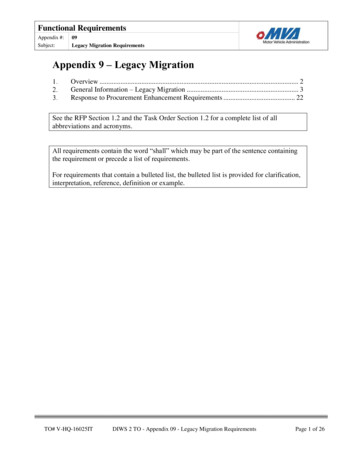
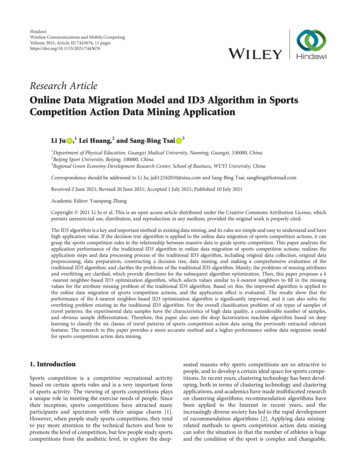
Wireless Communications and Mobile Computing5Classifier trainingprocessOnline dataclassification processSample training setSample measured resultsMeanFeatureextractionParticle isPower spectraldensityEnergy harmonicdensityWeight 1Decision fusionWeight 2Online datamigrationmodelFigure 1: Online data migration model.sample structural similarity generated by the structural similarity matrix is more biased towards the descriptive attributesthat are structurally more similar to the categorical attributes,then the sample structural similarity as weights will play apositive role in the correction of information gain, thusreducing the interference of the multivalue bias problem onthe selection of the joints.3.3. Data Mining Classifier Design. In this paper, we proposean automatic extraction strategy for sports competition actiondata based on image overlap region feature migration machinelearning, as shown in Figure 2. The strategy can be dividedinto three steps: (1) select the classifier with the highest generalization ability among ID3 algorithm classifiers to supervisethe data classification and set it as the source classifier model;(2) propagate the source marker to the adjacent target imageoverlap region, randomly select a certain proportion of itsmarker samples to mix with the source training samples toform the pseudosample, and use the migration learning modelto balance the difference of its temporal distribution; and (3)obtain the final classification model through the source classifier. The final classification model is obtained after continuousiterations, and the distribution difference between adjacenttarget image data is continuously reduced due to the increasing information of balanced temporal samples, to achieve thepurpose of accurate extraction of sports competition actiondata (see Figure 2).Using the automatic sports action data extraction strategy, only the source training samples of the source imagesand the classified images with overlapping areas with theimages to be classified are involved in the classification, andthen, the temporal difference balance based on the migrationlearning model and the source classifier model can completethe classification, and the information extraction of eachimage is completed one by one through the continuousiterative update to realize the large area sports competitiondata extraction. The action data extraction work is completedone by one through continuous iterative updates. In thispaper, the classifier algorithm with high adaptability andgeneralization ability is used as the classification model,which can effectively improve the accuracy of image classification results by learning more potential features. The migration learning model, as a tool for adaptive balancing betweensource and target images, can reduce the differences in datadistribution between them due to temporal and spatial differences and has a weakening effect on improving the problemof obvious color differences in the extraction of thematicinformation covering large regions of sports competitionaction data. Selecting certain marker samples in the overlapping area together with the source training samples constitutes a pseudosample, which makes it possible to considerthe spectral feature distributions of both the source andtarget images when performing temporal phase differencebalancing and avoid the overbalancing situation. The closecooperation of the above methods to complete the large areagrass information extraction will help to improve theextraction accuracy.4. Analysis of Results4.1. ID3 Algorithm Performance Analysis. Comparing therunning time of the traditional ID3 algorithm and theimproved ID3 algorithm, the execution time of the improvedID3 algorithm is shorter and the running time is reduced bythe improvement, and the comparison results are shown inFigure 3(a). By comparing the classification error rate of thetraditional ID3 algorithm and the improved low algorithm,the error rate of the improved ID3 algorithm is lower, andthe comparison results are shown in Figure 3(b). By comparing the experiments of both the traditional ID3 algorithmand the improved ID3 algorithm in terms of algorithmexecution time and classification error rate, it can be foundthat the dataset has reduced running time and lowered the
6Wireless Communications and Mobile ComputingSource image (1scene)Target image(multi-scene)Overlapping area(target domain)Source classifiermodelSource tagsampleSource classifiermodelTarget marksampleTransfer learningmodelFake sampleOnlinemigrationRunning time (ms)Figure 2: Flowchart of automatic extraction strategy for sports competition action data.100806040200123456789456Data set number789Data set numberTraditional ID3 algorithmImproved ID3 algorithmAlgorithm error rate (%)(a)6050403020100123Traditional ID3 algorithmImproved ID3 algorithm(b)Figure 3: Comparison of the running time and error rate of the algorithm.
Wireless Communications and Mobile Computing74.5Time (s)4.03.53.02.52.0050100150200Number of data tuples ( 1000)Traditional ID3 algorithmImproved ID3 algorithmFigure 4: Modeling time comparison results.average classification error rate after using the improved ID3algorithm (see Figure 3).Although the improved ID3 algorithm is proportional intime cost to the number of data tuples in the sample dataset,as the number of data tuples increases, this ratio is converging to the time to quantity ratio of the original algorithm.This means that the larger the sample dataset, the closer thedecision tree algorithm is to the traditional ID3 algorithmin terms of practical performance. Then, we continue to process the time information to get the results of modeling timecomparison between the traditional ID3 algorithm and theimproved ID3 algorithm (Figure 4). Figure 4 shows that thetime ratio between the improved ID3 algorithm and the traditional ID3 algorithm increases when the number of datatuples in the sample dataset grows from 10,000 to 20,000,while the time ratio between the improved ID3 algorithmand the traditional ID3 algorithm continues to decreasewhen the number of data tuples grows from 20,000 to80,000, but at the value of 80,000, the decreasing trend of thisratio slows down at 160,000 items. This trend indicates thatthe time efficiency of the improved ID3 algorithm decreaseswhen the number of data tuples is small, mainly due to themore complex algorithm, but the proportion of time spentby the algorithm decreases when the number of entriesincreases steadily. When the number of data tuples in thesample dataset is very large, the main time overhead hasshifted to data I/O and processing and is no longer concentrated on the algorithm (see Figure 4).The sample structural similarity model used by theimproved ID3 algorithm does not have a large impact onthe classification performance for datasets with an overalllow structural similarity. When encountering datasets wherethe number of attribute values does not differ much and thestructural similarity of
application steps and data processing process of the traditional ID3 algorithm, including original data collection, original data preprocessing, data preparation, constructing a decision tree, data mining, and making a comprehensive evaluation of the . field of data mining, and processing XML document data is a challenge. Ma and Tsai used .