Transcription
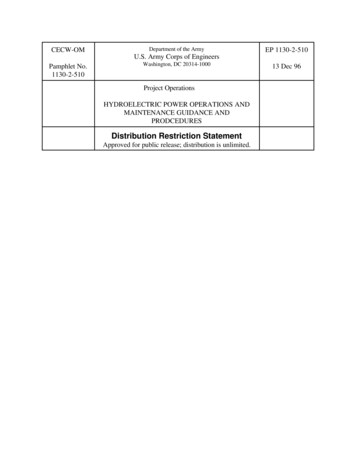
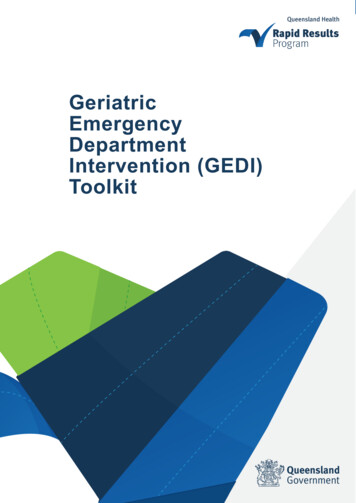
Appendix: We present further evidence exposing NIO of itschicaneries.READ OUR DISCLAIMER HEREWe Believe NIO is Shifting a Large Portion of its Battery SwappingNetwork Off Balance SheetThe Battery Swapping Network was Referred to as Weineng Battery’s NetworkAccording to an article by 21jingji.com, the battery charging and swapping network wasreferred to as the “Weineng Battery Charging and [Battery] Swapping Network”.We, therefore, suspect that Weineng Battery is one of the entities that NIO uses to offloadcosts.Translation:As part of NIO’s ecosystem, NIO is actively pushing for the establishment of WeinengBattery’s Network development.Weineng Battery is Not Alone, At Least One Other Battery Swap Station Not Consolidatedby NIODespite NIO claiming to own and operate the charging and battery swapping network, we’veseen that it was referred to as Weineng Battery’s network. We found another piece of evidencethat suggests that there is at least one other entity that operates a battery-swapping stationthat NIO claims to own and operate.According to this article, in the city of Kaifeng, Henan Province, NIO had one battery-swappingstation deconstructed due to its negative impact on the city’s environmental appearance. Thebattery-swapping station was later relocated. However, the article showed that the operatingentity behind the battery swapping station was Henan Xiangyu Technology Co., Ltd. (Chinesename: 河南相舆科技有限公司), another undisclosed entity that is not consolidated by NIO.
Source: QichachaAccording to Qichacha, the company has no relationship with NIO and is owned by twoindividuals that appear to be unrelated to NIO.34% Missing CAPEX Signals Even More Cost Shifting and Hidden Undisclosed CorporateNetworkWhile Weineng Battery might be the largest identifiable entity used to manipulate revenue andcosts, we believe there lies a vast network of undisclosed entities that NIO is using to shiftalmost 1.2 billion RMB worth of CAPEX away from their balance sheet. The battery swap stationwe identified previously is direct proof of such a network.While the identification of this network has proven to be challenging, upon analyzing NIO’sdisclosures, we have a pretty good idea of the scale of this scheme. We believe NIO has shiftedat least 34% of their CAPEX off of their balance sheet, roughly 1.2 billion RMB. NIO has beendisclosing numbers around what they claim to be their battery swap stations, superchargingstations, and destination charges.During NIO’s Q4 2021 conference call, management stated that NIO has so far deployed 866battery swap stations in 190 cities in China.“In terms of the charging and swapping network, we have deployed 866 battery swapstations in 190 cities and completed over 7.6 million swaps in China. So far, we have 711supercharging stations and 3786 destination chargers in China. In 2022, we will add 30new destination charging routes to the Power Up Plan. With that, NIO willaccumulatively operate over 1300 battery swap stations, 6000 power chargers, and10,000 destination chargers in China. We will further expand our power network toprovide a better charging and swapping experience to users.”
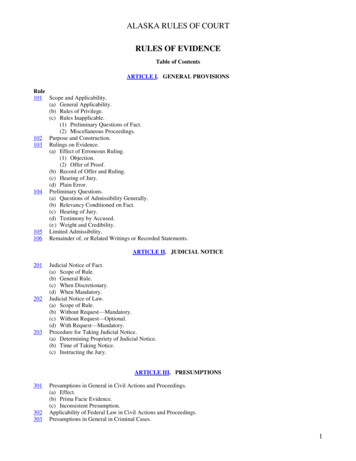
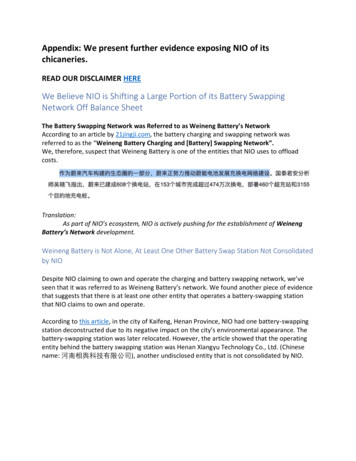
NIO has been disclosing the CAPEX related to charging & battery swap stations PPE. As ofSeptember 2021, they had close to 1.7 billion RMB in charging & battery swap equipment.Below is a table of their disclosed PPE vs their disclosed station numbers.Source: company filings; Grizzly AnalysisNIO started to report a detailed breakdown of the number of supercharging stations,destination chargers, and battery swap stations in Q4 2020. According to NIO, the company hasincreased the number of battery swapping stations and charging stations by 4.5 times, yet itsreported CAPEX has increased by approximately 3 times. Currently, on NIO’s mobile application,it shows there are 915 battery swapping stations nationwide in China.
Source: NIO AppThrough multiple articles reported in China, some even sourcing NIO themselves, we were ableto estimate the cost per supercharging station and cost per battery swap station. Using thisinformation we were able to deduce an estimated cost per battery swap station. According toan article published by Sina, NIO’s European Manager Hui Zhang stated that constructing abattery swap station costs 772,000 (roughly 5 million RMB), including batteries and propertylease, and construction of a (super)charging station costs 309,000 (roughly 2 million RMB).Similarly, according to specialists in the machine equipment industry, as of February 2022, theconstruction of a battery swap station costs roughly 5 million RMB in total. Huaxi Security, asecurity broker in China, also modeled the CAPEX of a battery swap station to be 5 million RMB.Mobile energy service provider Xie Xin Energy Technology disclosed that its battery swappingstations construction costs can reach 5 million RMB.We therefore backtracked and estimated that each destination charger costs approximately20,000 RMB, which we believe to be a very conservative estimation. For reference, even thehome use version of their charging stations costs over 15,000 RMB.
Source: company filings; Grizzly AnalysisAccording to our calculation, NIO should at least have 3.4 billion RMB in PPE related to charging& battery swap equipment. However, NIO only reported 2.3 billion RMB, representing anunder-reporting by over 51%. In addition, NIO did not separate battery swapping equipmentand facility and called them all battery swap infrastructure in Q4 2020. Assuming NIO simplyrenamed infrastructure to equipment, this would represent an under-reporting of 136%.Since NIO cannot misreport how many charging stations and battery swap stations there are, asthis information is readily available to NIO users on the NIO app, the only logical explanation isthat NIO does not own all of these charging stations and has shifted many of them off thebalance sheet. This allows NIO to hide costs associated with establishing and operating theseentities, thereby greatly improving their financial position.Bulls may think that perhaps depreciation is the reason why we are seeing these variances. Thisargument is unfounded, as the numbers reported by NIO were already excluding depreciationor pre-depreciation. On a pure original cost basis, the numbers do not add up. In addition, all ofthe above assets are depreciated using a 5-year fixed depreciation schedule. Even ifdepreciation played a factor, we should see at most a 20% deviation.Furthermore, we were already conservative with our calculations by giving them the benefit ofthe doubt and separating the equipment cost from the facility costs. If we had consolidatedboth into one CAPEX line, we would see an even larger variance as we show above.Middle School Math Shows How Untrustworthy NIO’s Numbers AreNote that with 3 full quarters (Q2, Q3, and Q4 2021) of official station counts and total PPE datafor all 3 quarters, we can mathematically back out the price of the cost per battery swap
station. We can establish 3 ternary linear equations by assuming a cost per superchargingstation to be x, cost per destination chargers to be y, and cost per battery swap station to be z.We can solve the above equation to get x 1,101, y 108 and z 1,400. If we were to believeNIO’s numbers, it would essentially mean that battery swapping stations cost 1.4 million RMBto build. The most interesting about this is that the costs we reference are very recent. Whilewe agree costs can shift and vary, this amount of variation is unlikely and suggests there issomething wrong with how NIO is accounting for these costs.Again, according to this industry article, the construction cost of 1 battery-swapping station fora passenger car is 5 million RMB, and the operation costs per year are 600,000 RMB.This means all 866 battery swap stations NIO claims to have will further generate approximately519.6 million RMB in annualized operating costs. However, we have shown that NIO’sdisclosures prove that they cannot possibly own and operate all 866 battery swap stations. Weestimate that NIO only owns 66% (2,280 / 3,440) of these stations at most. This implies that upto Q4 2021, NIO has effectively hidden close to 177 million RMB in operating costs off of itsincome statement.Furthermore, NIO claims that it plans to have 1,300 battery swapping stations installed by 2022,and 4,000 battery swapping stations by the end of 2025.Source: company filings; Grizzly AnalysisHence, assuming NIO shifts 34% of these battery swapping stations off of the balance sheet, itcould reduce up to 860 million RMB in annualized operating costs and up to 6.8 billion RMB inCAPEX in 2025.
NIO’s Related Party Transaction Have Us Deeply WorriedWe were also surprised at the number of related party transactions within NIO’s financials.Compared to its competitors: LI and XPEV, NIO by far had the biggest balance of related partytransactions.The table below summarizes NIO’s related party transactions from 2019 to 2021. In its filing,NIO separately disclosed the related party transaction and related party balances. Wesummarize these two categories from NIO and compared them to the other two competitors LIand XPEV. It shows that NIO’s related party transaction amount (i.e. sales of goods, purchase ofraw material, property and equipment, etc.) ballooned from 285.6 million RMB in 2019 to 5.5billion RMB in 2021, whereas LI’s related party transaction amount is in tens of millions RMBand XPEV didn’t disclose any related party transaction amount during this period. In addition,NIO’s related party balances (i.e. amounts due from related parties, amounts due to relatedparties, etc.) also increased from 1.9 billion RMB in 2019 to 2.6 billion RMB in 2021, whereasboth LI and XPEV’s related party balances are in tens of millions RMB. To put into perspective,NIO’s related party transaction amount in 2021 is 113 times the combined amount from bothLI and XPEV, and NIO’s related party balances amount in 2021 is 27.4 times the combinedamount from both LI and XPEV.Source: company filings; Grizzly AnalysisWe dug deeper into these related-party companies that NIO listed in its filings, and we findthings are much more complex than it originally looks.Battery Supplier Casts Doubt on Delivery NumbersNIO disclosed Suzhou Zenlead XPT New Energy Technologies Co., Ltd. (“Suzhou Zenlead”,Chinese name: 苏州正力新能源科技有限公司, previous name: 苏州正力蔚来新能源科技有限公司) as an affiliate in its annual report. According to NIO’s disclosure, NIO paid 132.2
million, 132.5 million, 174.7 million, and 89.3 million RMB to Suzhou Zenlead in 2018, 2019,2020, and 2021, respectively. The business relationship between NIO and Suzhou Zenlead is for“manufacturing consignment”.Source: company filingsBelow is part of Qichacha’s introduction page for Suzhou Zenlead. The company accounts for100% of the cost of manufacturing consignment and was even called NIO Zenlead beforeSeptember 2019.Source: QichachaAccording to Qichacha, Weiran (Nanjing) Energy Storage System Co., Ltd. (“Weiran Nanjing”)had been its 35% shareholder from its inception until 02/23/2022. Weiran Nanjing, throughcertain subsidiaries, is 100% owned by NIO.Source: QichachaKnowing what we know about revenue inflation through the overselling of batteries, NIO’srelationship with its sole battery suppliers cast another layer of doubt on its credibility. Thereare numerous articles (link 1, link 2, link 3) stating that Suzhou Zenlead is the supplier of theBattery Pack to NIO, and it appears it is the only one with manufacturing capability.
Source: https://www.sohu.com/a/445792191 492545Assuming the pricing of the Battery Pack for each EV delivered stays the same from 2018 to2020, the expense that NIO pays to Suzhou Zenlead should be proportionate to the deliveredEVs during this period. Even if we give this metric some breathing room in terms of pricefluctuations, this relationship should still hold. However, our analysis reveals a completelydifferent reality.The table below shows that even though 2019 NIO’s EV delivery number almost doubled from11,348 in 2018 to 20,565, NIO’s payment for the Battery Packs stayed flat. In 2020, NIO’s EVdelivery number more than doubled to 43,728 from 20,565 in 2019, yet NIO’s payment toSuzhou Zenlead for the Battery Pack only increased by 42 million RMB, which is only anapproximately 31.8% increase. What’s even more concerning is that NIO claimed its EV deliverymore than doubled from 43,728 in 2020 to 91,429 in 2021, however, its payment to SuzhouZenlead for the Battery Pack almost halved from 174.7 million RMB to 89.3 million RMB.Source: company filingsIn our opinion, there are two possibilities for this discrepancy:1. NIO underpays its affiliated company to reduce expenses and narrow its loss. According to ourcalculations, these numbers imply that in 2018, each battery pack would approximately be11,640 RMB; in 2019, 6,400 RMB; in 2020, 3,990 RMB and in 2021, 977 RMB. Each year, the
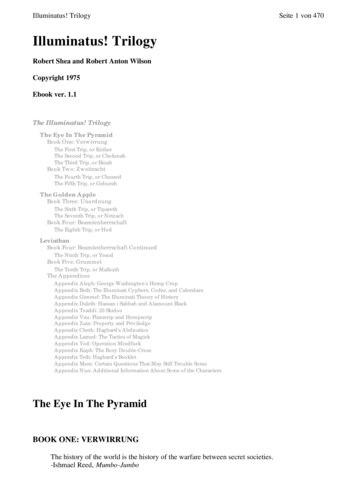
price NIO pays for the battery packs is roughly halved which is either a function of anunbelievable scientific innovation or simple accounting shenanigans.2. The payment from NIO to Suzhou Zenlead is reflective of this proportional relationship whichwould imply that the real number of cars delivered is much lower. This would imply egregiousmisrepresentation by NIO. We believe either situation should give a big pause on NIO’sinvestors’ trust in the company.Why We Believe NIO is in the Worst Positioned among the Three publicEV Players in China.NIO’s EV Delivery Data Seems to Be in the Downward Trend Compared to its PeersThe table below shows the monthly EV deliveries from NIO on its 4 models (EC6: five-seaterpremium smart electric coupe SUV; ES6: five-seater high-performance premium smart electricSUV; ES8: six- or seven-seater flagship premium smart electric SUV; ET7: flagship premiumsmart electric sedan). Due to its relatively high-priced models, NIO’s direct competitors includeTesla, BMW, Audi, etc.Source: company filings; Grizzly AnalysisIn recent months, it appears NIO’s deliveries peaked in November 2021 and since then havebeen on a down-trend. While this trend is concerning on its own, it becomes even worse whenyou compare NIO’s delivery numbers with two comparable: LI and XPEV. The table below showsthe comparison of the total delivery units between these three companies since August 2021.
Source: company filings; Grizzly AnalysisThe chart above shows the year-over-year growth of the monthly delivery units. We can seethat both LI and XPEV have a much higher year-over-year growth rate than NIO. For example, inJanuary 2022, LI and XPEV’s growth rates were 128.1% and 115%, respectively, yet NIO’sgrowth rate was just 33.6%. The month after, the growth rate of LI and XPEV expanded to265.8% and 180%, respectively, yet NIO’s growth rate contracted from 33.6% in January to just9.9% in February.We visited certain NIO’s EV shops. Below is an example of their shop called NIO Space.
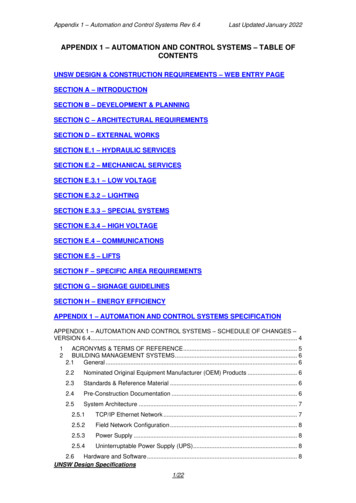
Source: NIO Space Physical StoreThrough talking to the salesperson, we were told that it would take about 14 weeks untilcustomers would be able to get their order delivered on the sedan model ET7, as compared to6-9 months if customers were to order a Tesla. What’s more concerning is that we were toldthat NIO’s SUVs took a much shorter time to deliver, which is about 5-6 weeks. For ET7, there isonly a national subsidy when customers purchase the car. However, for SUVs, there arenational subsidies, NIO subsidies, and trade-in subsidies if customers want to trade theircurrent car to purchase an NIO SUV. Be reminded that NIO’s SUVs were its main selling modelsright now, and the fact that the delivery cycle is relatively this short with these different typesof subsidies tells investors NIO’s EVs in general are not selling that well currently.Since the majority of customers of these three EV companies are in China, we believe BaiduIndex, which is similar to Google Trend in the U.S., is a good indication of their popularity orinternet user attention. The diagram below shows the Baidu Index for the period from July 2021to early April 2022.Source: Baidu Index
The blue line is for NIO, the green line is for LI, and the orange line is for XPEV, respectively. It isclear that LI’s index is much higher than both NIO and XPEV, and in the meantime, XPEV’s indexis higher than NIO most of the time.Source: Baidu IndexNIO (in green) was in the lead at the beginning of 2015, where they had a head start, and kepttheir lead up until 2018. In 2019, NIO was quickly surpassed by XPEV and LI.In the past few years (since 2020), NIO has consistently lagged its peers in terms of internetsearch interest, which corresponds to the decline in its delivery volume. Bringing Tesla into thepicture, we see that although NIO is priced like a Tesla, its interest falls way short of the leadingEV brand.
Source: Baidu Index
Source: WeChat IndexSimilarly, we see the same trend on WeChat. The above charts show data collected fromWeChat Index, which tallies common keyword search rates from China’s most popular socialmedia platform WeChat. NIO (in blue) consistently lags behind LI(in green) and XPEV (in yellow).The lagging delivery growth and declining trends from WeChat and Baidu support the story thatNIO is losing its steam in the EV market compared to its other competitors. Even a privatecompany called Nezha EV delivered 7,117 units in February, according to this report, and itmakes NIO now ranked 4th in the monthly delivery units in February (the 1st place goes to BYD).According to a report in February 2022, Nezha EV received the D round of financing of RMB2 billion and the valuation of the company exceeds RBM 25 billion ( USD 3.9 billion).
NIO initially used several marketing gimmicks to attract buyers, but the concepts turned out tonot work after all. For example, it was reported that there could be moving charging vehiclesfollowing NIO EVs to provide charging service in case the EV needs charging. This kind of servicewas good to attract initial buyers and works well when the EVs are sold in small numbers.However, after selling a much larger number of EVs, there is no way to keep these kinds ofservices going sustainably because the cost associated will be enormous.Since 2018, the company has reported losses of 7.6 billion on a GAAP basis. We believe this isjust the sugar-coated results as we believe it is hiding a substantial amount of losses throughaccounting shenanigans!Source: cpcaauto
Source: cpcaautoAccording to the third-party data above, even though the total delivery number of NIOincreased from 2020 to 2021, its market share in the pure EV sector decreased from 4.7% in2020 to 3.8% in 2021. And its overall ranking decreased from No.7 in 2020 to No.8 in 2021, interms of delivery numbers.Market Share 2020 vs 00%TeslaNIO20202021Source: company filings; Grizzly analysisXPEV
Below-Average Performance of NIO’s IP Parts and Marketing StuntsThe holy grail for the adoption of electric vehicles is the range and efficiency provided by a welloptimized battery and drivetrain unit. According to recent and independent real-world tests,NIO’s cars do not compare well in the efficiency measures to direct competitors. EV tester BjørnNyland concludes in this test about the NIO ES8 that it is “very, very thirsty ( ) the thirstiest[EV] car ever”, meaning it is very inefficient. We believe this is one of the reasons why NIO lacksbehind its peers in consumer appreciation. Nyland’s 1,000km real-world challenge provides thefollowing comparative results of the drivetrains’ overall efficiency performance.This information reveals that the ES8 is among the least efficient cars tested. The Time columnindicates the effective time needed to make the journey, including the charging or battery swapbetween the start and finish line. The Watt-hours per kilometer describe the energyconsumption.The efficiency of an electric car is determined by a variety of technical factors that playtogether. The vehicle weight, the friction to the surface and air, components for electricityconversion, the electric motor, the thermal management system, and software play a role. EVmakers seek to optimize these setups despite many components being provided by suppliers.With reference to the table above a very fair comparison is to compare NIO’s ES8 to othernewer SUV models of a similar weight class. We want to mention particularly Tesla’s Model X LRRaven (empty weight: 2,533 kg), Audi e-Tron 55 (empty weight: 2,595 kg), and the MercedesEQC 400 (empty weight: 2,495 kg) who perform all well below 300 Wh/km in comparison to the“thirsty” and noticeably lighter ES8 (empty weight: 2,425 kg) with 318 Wh/km.Another metric of EV drivetrain usability is the charging speed. Since the optimization ofcharging speed depends on the complex interplay of battery thermal management and
inverters, all EV makers develop their setup for this to some degree and performance variessignificantly among different EV cars. Nyland compares four competitors’ fast charging speedsfrom 10% to 100% of charge. The results reveal NIO’s poor performance.In everyday use scenarios, batteries are usually only charged between 10% and 90% of fullcharge to minimize battery degradation. This reveals how strongly NIO is outclassed by Audiand Tesla.NIO uses a lot of standard parts that other automakers in the luxury price segment use as well.An analyst report summarizes that for automated driving, NIO uses Mobileye’s third-partysolution, as well as crucial parts provided by ZF, Brembo, ThyssenKrupp, Bosch, and Fuyao.These are proven parts but this depends shows that NIO will not be able to materialize anypricing advantage over the non-Chinese direct competitors. We believe NIO’s negotiationpower for parts like this is weaker than for large-scale OEMs like Volkswagen Group, MercedesBenz, BMW, and Tesla.NIO’s only long-term unique selling point apart from the battery-swap system is brandingrelated. The infotainment user interface is inspired by the smartphone-like look known fromTesla and Volvo/Android. NIO’s interior and exterior design language was well-perceived butdoes not have a strong own and unique design language as is expected in the luxury autosegment. Therefore, we don’t see any convincing strategy of how NIO can successfully upscaleits sales globally in this competitive landscape.
NIO’s Highly Touted NeoPark Involvement Is yet another MarketingStuntThere is no shortage of YouTubers and social media accounts who are bullish on NIO and seemto follow the company closely. One thing that makes them excited is NIO’s previouslyannounced NeoPark news. In that news, the company announced that its Chairman and CEO,Bin Li, attended the industry park NeoPark’s kicking-off ceremony with certain governmentofficials in the Province of Anhui, China.“NIO is honored to be one of the largest members of NeoPark, a world-class smartelectric vehicle industry cluster encompassing innovative research and development ofvehicles, core parts and components, and autonomous driving, envisions becoming apioneering innovation chain with global competitiveness. NeoPark is a hub for hundredsof key supporting enterprises and a highly-clustered full-fledged industry chain. NIO isone of many companies in NeoPark's vision. The 16,950-acre park features three mainfunction areas, smart manufacturing, R&D and living space, and eco-park.NeoPark aspires to be green and environmentally friendly and contributes to peakingcarbon emissions and achieving carbon neutrality. The park aims to be an innovativehighland for top-notch talents, to accommodate over 10,000 R&D personnel and 40,000technical workers.With an annual production capacity of 1 million vehicles and 100 GWh battery, NeoParkis expected to realize a gross yearly output of RMB 500 billion.”The news release looks pretty exciting. Of course, who will not be excited for a 16,950-acreindustry park that can accommodate over 10K R&D personnel and 40K technical workers, and isexpected to realize an overall annual output of RMB 500 billion? We believe NIO’s press releaseon the NeoPark caused a lot of confusion to the retail investors. For example, this article iscomparing the area of NeoPark to Tesla’s Fremont Plant, saying NeoPark is 12 times of Tesla’sFremont plant, and “Nio expects to attract 10,000 R&D personnel and 40,000 technical workersto NeoPark, which will have a production capacity of 1 million EVs and 100 GWh in batterypacks per year.” Another example on the Youtube video has the title “Neo Park, NIO startsbuilding smart EV industrial park in Hefei with an initial investment of RMB 50B”, which givesretail investors watching the video the impression that NeoPark belongs to NIO.However, we believe NeoPark’s significance has been largely overstated by theseaforementioned website articles and youtube videos.First of all, the name of the industry park, NeoPark, sounds similar to NIO’s name, and thiscould make some English-speaking investors automatically associate this industry park withNIO. However, this industry park’s real Chinese name, if translated directly, is Xinqiao SmartElectric Vehicle Industry Park. Of course, NIO is not going to call the industry park this name,because its real Chinese name does not include any words related to NIO! Not only does thename not include any words related to NIO, NIO is nothing but a mere tenant (out of possiblyhundreds) located in the park.
We uncovered documents that show that NIO is not doing the bidding for this industry park,Xinqiao Smart Electric Vehicle Industry Park, which approves NIO does not own this industrypark.Link1, Link2We have reviewed the phase I project contract of Xinqiao Smart Electric Vehicle Industry Park,and it is pretty clear that the company that put out the bid for this project is Hefei XinqiaoTechnology Investment Development Co., Ltd. (“Hefei Xinqiao” thereafter; Chinese name: : QichachaThis company was established on December 29, 2020, and its 100% shareholder is the localgovernment of the City of Hefei, Anhui Province. NIO or any of its related affiliates was not theshareholder of Heifei Xinqiao. We suspect that NIO does not have any ownership of thisindustry park, and it may not have any ownership of this newly built manufacturing facility. Ifthis is the case, what is NIO bragging about on this Xinqiao Smart Electric Vehicle Industry Park?
Full Legal Disclaimer***IMPORTANT LEGAL DISCLAIMERTHIS REPORT AND ALL STATEMENTS CONTAINED HEREIN ARE THE OPINIONS OF GRIZZLY RESEARCH, AND ARE NOT STATEMENTSOF FACT.Reports are based on generally available information, field research, inferences and deductions through Grizzly Research’s duediligence and analytical process. Our opinions are held in good faith, and we have based them upon publicly available facts andevidence collectedand analyzed including our understanding of representations made by the management of the companies weanalyze, all of which we set out in our research reports to support our opinions, all of which we set out herein. HOWEVER, THEYREMAIN OUR OPINIONS AND BELIEFS ONLY.We conducted research and analysis based on public information in a manner than any person could have done if they had beeninterested in doing so. You can publicly access any piece of evidence cited in this report or that we relied on to write this report.Grizzly Research makes no representation, express or implied, as to the accuracy, timeliness, or completeness of any such informationor with regard to the results to be obtained from its use.We are entitled to our opinions and to the right to express such opinions in a public forum. We believe that the publication of ouropinions and the underlying facts about the public companies we research is in the public interest, and that publication is justifieddue tothe fact that public investors and the market are connected in a common interest in the true value and share price of the publiccompanies we research. All expressions of opinion are subject to change without notice, Grizzly Research does not undertake a dutyto update or supplement this report or any of the information contained herein.Recipients of the research report are professional investors who are expected to make their own judgment as to any reliance thatthey place on the research report. You represent that you have sufficient investment sophistication to critically assess theinformation, analysis and opinion on this website.You further agree that you will not communicate the contents of reports and other materials on this site to any other person unlessthat person has agreed to be bound by these Terms of Use. If you access this website, download or receive the contents of reports orother materials on this website on your own behalf, you agree to and shall be bound by these Terms of Use. If you access ourwebsite, download or receive the contents of reports or other materials on this website as an agent for any other person, you arebinding your principalto these same Terms of Use.AS OF THE PUBLICATION DATE OF GRIZZLY RESEARCH’S REPORT, CERTAIN GRIZZLY RESEARCH ASSOCIATED PERSONS (AS DEFINEDHEREUNDER) (ALONG WITH OR THROUGH ITS MEMBERS, PARTNERS, AFFILIATES, EMPLOYEES, AND/OR CONSULTANTS), CLIENTS,AND INVESTORS, AND/OR THEIR CLIENTS AND INVESTORS HAVE A SHORT POSITION IN THE SECURITIES OF A COVERED ISSUER(AND OPTIONS,SWAPS, AND OTHER DERIVATIVES RELATED TO THESE SECURITIES), AND THEREFORE WILL REALIZE SIGNIFICANTGAINS IN THE EVENT THAT THE PRICES OF NIO INC’S SECURITIES DECLINE. GRIZZLY RESEARCH AND GRIZZLY RESEARCHASSOCIATED PERSONS ARE LIKELY TO CONTINUE TO TRANSACT IN NIO INC’S SECURITIES FOR AN INDEFINITE PERIOD AFTER ANINITIAL REPORT ON A COVERED ISSUER, AND SUCH POSITION(S) MAY BE LONG, SHORT, OR NEUTRAL AT ANY TIME HEREAFTERREGARDLESS OF THEIR INITIAL POSITION(S) AND VIEWS AS
According to our calculation, NIO should at least have 3.4 billion RMB in PPE related to charging & battery swap equipment. However, NIO only reported 2.3 billion RMB, representing an under-reporting by over 51%. In addition, NIO did not separate battery swapping equipment and facility and called them all battery swap infrastructure in Q4 2020.