Transcription
iowa storm watermanagement manual3.01 Unified Sizing Criteria
CHAPTER 3.01 UNIFIED SIZING CRITERIAIOWA STORM WATER MANAGEMENT MANUALTable of contents3.01-1 DEFINITION AND GOALS1 3.01-4 COMPLIANCE223.01-4.A Narrative of Management Approach. 223.01-2 EVALUATION/MEASUREMENT23.01-2.A Small Storm Criteria. 2Recharge Volume (Rev). 2Water Quality Volume (WQv).63.01-4.B Recharge Volume (Rev). 223.01-4.C Water Quality Volume (WQv). 233.01-4.D Channel Protection Volume (CPv). 233.01-4.EOverbank Flood Protection (Qp)& Extreme Flood Protection (Qf). 243.01-4.FOverland Flow and FloodplainManagement Requirements. 24Channel Protection Volume (CPv).83.01-2.B Large Storm Criteria. 11Overbank Flood Protection (Qp). 11Extreme Flood Protection (Qf). 123.01-2.C Multi-Stage Outlet Design. 133.01-5 SPECIAL CASES253.01-5.A Direct dischargefrom project limits. 253.01-3 IMPLEMENTATION153.01-5.B Multiple discharge points. 253.01-3.A Toolbox of Best ManagementPractices for Water Qualityand Quantity. 153.01-5.C Inflow from areasbeyond project limits. 263.01-3.B Location of Practices. 16“Site/Development Scale” vs.“Regional” Approach. 163.01-6 SPECIAL CASE DESIGN EXAMPLES 30Private vs. Public Ownershipand Maintenance.183.01-3.C Overland Flow andFloodplain Management. 19Overland Flow Requirements. 19Floodplain Management .19Buffers along overland flow paths,streams and floodplains .20Refer to the glossary for words in bold black text.Some items of emphasis are listed in bold blue text.ISSUED 12.31.2019ii3.01-7 LOCAL ORDINANCEAND POLICY GUIDANCE383.01-8 APPENDIX—SETTING “NATURAL”CONDITION CN STANDARDS40
IOWA STORM WATER MANAGEMENT MANUALCHAPTER 3.01 UNIFIED SIZING CRITERIA3.01-1 Definition and GoalsThe Unified Sizing Criteria (USC) are a set of measurement standards used throughout this manual toevaluate management of the quality and quantity of stormwater runoff. These criteria are to be usedin the design and review process to verify that proposed best management practices (BMPs) areprovided with adequate size and storage to achieve desired treatment goals.Their purpose is to provide a framework to meet the following objectives set forth in Section 1.04(Stormwater Management Criteria): Minimum guideline #2: Remove stormwater runoff pollutants and improve water quality Minimum guideline #3: Prevent downstream streambank and channel erosion Minimum guideline #4: Reduce potential of surcharge of downstream storm sewer systems andoverbank flooding Minimum guideline #5: Safely pass or reduce the runoff from extreme storm events Minimum guideline #7: Groundwater recharge (volume reduction)NOTERefer to Sections 1.05 and 9.03 forinformation to be included in theStormwater Management Reportand associated calculationsTABLE 3.01-1.1: UNIFIED SIZING CRITERIA SUMMARYCRITERIAOBJECTIVESMALL STORMRecharge Volume (Rev)Runoff volume reduction, groundwater recharge.Water Quality Volume (WQv)Provide water quality treatment, reduce total pollutant load.Channel Protection Volume (CPv)Protect downstream channels from increased flow rates,extended duration of high flows and erosive flow velocities.LARGE STORMOverbank Flood Protection (Qp)Reduce potential for downstream storm sewer networksurcharge and overbank flooding in local urban watersheds.Extreme Flood Protection (Qf)Protect adjacent and downstream properties andinfrastructure. Prevent increases in flood high waterelevations downstream. Manage impacts of extremestorm events through detention controls and floodplainmanagement.Pretreatment is not listed as one of the Unified Sizing Criteria, but is critically important to be consideredin the design of BMPs. Pretreatment practices are used upstream of Water Quality and Quantity BMPsto collect heavier sediments, trash and other debris. Without pretreatment measures, BMPs wouldrequire more intense maintenance or may even cease to function due to loss of storage volume, lostinfiltration capacity (plugging), blocked outlets and poor aesthetic conditions. Pretreatment measuresshould be addressed in the planning and design of any stormwater BMP.1NOTERefer to Sections 5.01-5.07for more information aboutPretreatment practices.
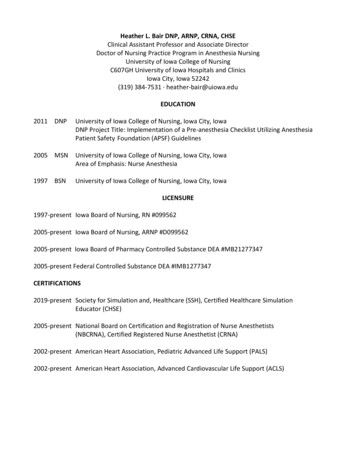
CHAPTER 3.01 UNIFIED SIZING CRITERIAIOWA STORM WATER MANAGEMENT MANUAL3.01-2 EVALUATION/MEASUREMENTNOTERefer to Section 2.02 (Rainfall andRunoff Analysis) for more informationabout rainfall frequency anddistribution.The Unified Sizing Criteria (USC) cangenerally be grouped into standards relatedto water quality and quantity. Criteria thataddress water quality are primarily focusedaround the management of the most frequentlyoccurring, smaller storms.Water quantity isprimarily managed by volume reduction andlimitation of runoff rates during all storm events.Figure 3.01-2.1A. SMALL STORM CRITERIAThe most fundamental change in hydrology asurban areas develop is an increase in runoffVOLUME.This directly impacts channelstability and flood risk. It also means lesswater is infiltrating into the ground, reducingbaseflow levels in urban streams duringperiods of low precipitation.Employing methods to mitigateincreases in runoff volume should begiven first priority.1. Recharge Volume (Rev)The Recharge Volume (Rev)standard is intended to reduceoverall surface runoff volumesand improve stream baseflow byimproving recharge of shallowgroundwater levels.It can be achieved by: Application of Soil QualityRestoration and direction ofrunoff from impervious areas toopen spaces where SQR has beenapplied (refer to Section 7.03 for moreinformation) Rainfall Collection and Reuse BMPs Use of Infiltration BMPs or Permeable Pavement Systems with elevated subdrains, to require aset volume to be infiltrated into subsoil layers or be retained within the soil media or aggregatelayers for plant uptake and/or evapotranspiration Other methods as approved by local jurisdictions2
IOWA STORM WATER MANAGEMENT MANUALCHAPTER 3.01 UNIFIED SIZING CRITERIAThe Recharge Volume is defined as:EQUATION 3.01-2-1:Rev (CF) 0.95 x Impervious Area (SF) x Recharge Depth* (inches) / 12 (inches per foot)Rev Recharge Volume (CF)0.95 Runoff Coefficient for impervious surfacesImpervious Surface Area (SF) measured for a given site area or subwatershedRecharge Depth 1 inchProjects need to demonstrate that practices and approaches have been employed to reach the rechargevolume to the maximum extent possible. Simply stating that nothing is possible, should not be viewedas acceptable. Almost every site can employ soil quality restoration, rainfall collection and/or reuse orother methods to capture, use, or infiltrate water on-site.Caution should be used when attempting to infiltrate water into subsoil layers on sites with contaminated soils, karsttopography or high water tables and/or ultra urban locations. Even in these conditions practices such as green roofs, soilquality restoration and rainwater capture and reuse can be used to reduce runoff volume. Infiltration practices can also beused in such cases, if appropriate liners are installed and the system is configured to maintain saturated conditions withinportions of the soil and aggregate layers.Open spaces with heavilycompacted soils or those withinsufficient organic contentto support desired vegetationwithout intense irrigation will oftengenerate runoff even during smallstorm events. For this reason, sitesand/or subwatersheds withoutadequate topsoil or soil qualityrestoration (SQR) applied to adepth of at least 4 inches shouldbe treated as if they were coveredby 50% impervious cover, forthe purposes of calculating Revrequirements. Refer to Section7.03 (Soil Quality Management andRestoration) for more information.If it can be demonstrated that the Recharge Volume requirement for a 1” rainfall event is fully achievedat a given site (or subwatershed), then the Water Quality Volume (WQv) requirements for that same areawill be considered to be satisfied.If it is not feasible to reach this goal, then additional practices need to be employed to address the WQvrequirements. Any runoff volume reductions achieved may be credited toward the WQv to be treated fora given site (or subwatershed).Examples of practices which could be used to achieve the Rev standard: Stormwater capture / re-use: Volume expected to be used on site within a typical 72 hour period. Soil quality restoration: Volume expected to be retained by soil materials (see Section 7.03). Tree filter systems and bioretention: Volume in aggregate layers below subdrain (able to beexfiltrated with 72 hours) or volume retained within void space within modified soil / aggregatelayers by internal water storage (see Section 7.05 or 7.07). Infiltration trenches and bioswales: Volume in aggregate layers below subdrain (able to beexfiltrated with 72 hours - see Section 7.06 or 7.08). Permeable pavement systems: Volume in aggregate layers below subdrain (able to be infiltratedwith 72 hours - see Section 8.01). Ponds / wetlands: Any volume lost through evapotranspiration. Requires water balance analysisto be performed (see Section 9.05).Note: Individual practices should be sized as needed to meet the Water Quality volume standard, however if the 1” rechargevolume is achieved at a given site, no additional practices would be needed to address the remainder of the site’s WaterQuality volume.3NOTEExfiltration is the subsurfacemovement of water into subsoillayers, such as the movementof water from modified soils oraggregates into native soil materialsbelow a bioretention cell.
CHAPTER 3.01 UNIFIED SIZING CRITERIARev 0.95 x 43,560 SF x 1 inch x (1 foot / 12 inches)Rev 3,449 CF (cubic feet)EXAMPLE PROBLEM #2:This second scenario shows how a table could be provided that demonstrates compliance with thisstandard.Parameters:Bioretention Cell #1Footprint of cell 1 acre x 70% impervious x 5% 0.035 acresx 43,560 SF / acre1,525 SFx 3 feet (internal water storage)*x 0.30 (porosity)1,372 SF (Rev retained)1 acre (70% impervious -- building, sidewalks, parking) draining to Bioretention Cell #1. Cellfootprint area would be 5% of impervious area drained, with 12” of aggregate layer belowthe subdrain and internal water storage within 24” of aggregate / modified soil layer (porosity30%).C.2 acres permeable pavement area (90% impervious). Permeable area assumed to be 1/3 ofentire impervious parking area. 10” of aggregate storage below subdrain (porosity 30%).D.1 acre (40% impervious -- sidewalks, parking, driveways) draining to Bioretention Cell #2.Cell footprint area enlarged to be 15% of impervious area drained, with 13” of aggregatelayer below the subdrain and internal water storage within 24” of aggregate / modified soillayer (porosity 30%).Deepest depth of aggregate layer to be infiltrated 13 inches. Required subsoil infiltration rate to drainthis layer in 72 hours: 13 inches/72 hours 0.183 inches/hour. If site soils can achieve this infiltrationrate, the full Rev requirement would be met for this 384,138100%0BioretentionCell #1BioretentionCell #11.0070%2,41402,4141,37257%1,042BioretentionCell retentionCell #2BioretentionCell #21.0040%1,3791,0422,4212,421100%0Dischargefrom Site** 10” of aggregate belowsubdrain.4DownstreamBMP(acres)Soil QualityRestorationPracticeRev Retainedby BMPRevDirected toDownstreamBMPTable 3.01-2-1a: Example #2 Rev Calculations% of RevRetained byBMP* For this example it is assumedthat an upturned elbow or waterlevel control structure keeps aninternal water storage depth thatkeeps the bottom 2 feet of modifiedsoil and noted depth aggregatebelow subdrain saturated.B.UnretainedRev fromUpstreamBMPsPermeable PavementFootprint of permeable surface 2 acre x 90% impervious x(1/3) 0.60 acresx 43,560 SF / acre26,136 SFx 0.833 feet(internal water storage)**x 0.30 (porosity)6,534 SF (Rev retained) 6,207CF to treat2 acres (60% impervious -- building, sidewalks, etc.) draining to open spaces with 8” depthSQR, w/ 5% organic matter (2.22” of water storage available in 0.8 acres of open space -reference Section 7.03).Rev of Area tobe RetainedBioretention Cell #2Footprint of cell 1 acre x 40% impervious x 15% 0.060 acresx 43,560 SF / acre2,614 SFx 3.083 feet(internal water storage)*x 0.30 (porosity)2,421 SF (Rev retained)A.Total Rev toBMPSoil Quality Restoration2 acres x (40% open space) 0.8 acres of SQR areax 43,560 SF / acrex 2.22 inches / 12 (inch/foot)6,447 CF 4,138 CF to treatGiven: 1 acre of impervious cover (43,560 SF)% ImperviousExample #2 shows how tocalculate how recharge volumeis being achieved, if multiplepractices are used at a given site.EXAMPLE PROBLEM #1:Area to beTreated byBMPExample #1 only shows howthe required Rev to be treated iscalculated.IOWA STORM WATER MANAGEMENT MANUAL
IOWA STORM WATER MANAGEMENT MANUALCHAPTER 3.01 UNIFIED SIZING CRITERIAEXAMPLE PROBLEM #3:This third scenario is similar to Example #2, but the aggregate layers below the subdrain are omitted,showing an example where site soils are assumed to allow for no infiltration.Parameters:A.2 acres (60% impervious -- building, sidewalks, etc.) draining to open spaces with 8” depthSQR, w/ 5% organic matter (2.22” of water storage available in 0.8 acres of open space -reference Section 7.03).B.1 acre (70% impervious -- building, sidewalks, parking) draining to Bioretention Cell #1. Cellfootprint area would be 5% of impervious area drained, with internal water storage within 24”of aggregate / modified soil layer (porosity 30%).C.2 acres permeable pavement area (90% impervious). Permeable area assumed to be 1/3 ofentire impervious parking area. 3” of aggregate storage below subdrain (porosity 30%).D.1 acre (40% impervious -- sidewalks, parking, driveways) draining to Bioretention Cell #2.Cell footprint area enlarged to be 15% of impervious area drained, with internal water storagewithin 24” of aggregate / modified soil layer (porosity 30%).% ImperviousRev of Area tobe RetainedUnretainedRev fromUpstreamBMPsTotal Rev toBMPRev Retainedby BMP% of RevRetained byBMPRevDirected il etentionCell #1BioretentionCell #11.0070%2,41402,41491538%1,499BioretentionCell tentionCell #2BioretentionCell #21.0040%1,3797,7069,0861,56817%7,518Dischargefrom SiteTotalWatershedArea6.0068%14,139 Rev Targetto be Retained(CF)PracticeRev Retained (CF) 0.656,621DownstreamBMPArea to beTreated byBMPTable 3.01-2-1b: Example #3 Rev Calculations Rev Targetto be Retained(wtr-in)7,518 RevDischarged(CF)Rev Retained (watershed-inches) 0.300.35 RevDischarged(wtr-in)% of Rev Target Retained 47%53% % ofRev TargetDischarged5Example #3 shows how todocument recharge volume whenthe runoff generated by the 1inch storm event cannot be fullyretained.Soil Quality Restoration2 acres x (40% open space) 0.8 acres of SQR areax 43,560 SF / acrex 2.22 inches / 12 (inch/foot)6,447 CF 4,138 CF to treatBioretention Cell #1Footprint of cell 1 acre x 70% impervious x 5% 0.035 acresx 43,560 SF / acre1,525 SFx 2 feet (internal water storage)*x 0.30 (porosity)915 SF (Rev retained)Bioretention Cell #2Footprint of cell 1 acre x 40% impervious x15% 0.060 acresx 43,560 SF / acre2,614 SFx 2 feet (internal water storage)*x 0.30 (porosity)1,568 SF (Rev retained)Permeable PavementDue to poor site soils in thisexample, minimal infiltration isexpected from aggregate below thesubdrain. Only 3” of aggregate is tobe provided below the subdrain toaccommodate water entry into thesubdrain.* For this example it is assumedthat an upturned elbow or waterlevel control structure keeps aninternal water storage depth thatkeeps the bottom 2 feet of modifiedsoil saturated and no infiltration isaccounted for in storage below thesubdrain.
CHAPTER 3.01 UNIFIED SIZING CRITERIAIOWA STORM WATER MANAGEMENT MANUAL2. Water Quality Volume (WQv)The WQv criteria is focused on the capture and treatment of runoff from the most commonly occurringstorm events. Statewide, approximately 90% of rainfall events on an annual basis are less than or equala depth of 1.25 inches. The vast majority of runoff from a site will be captured and treated throughinstallation of BMPs that are sized to address these most common, small storms. A 80% reduction inTSS can typically be expected from practices that address 90% of annual rainfall events.This is a volumetric standard, calculated using the “Short cut method” (Schueler, 1987):Step 1Open spaces with heavilycompacted soils or those withinsufficient organic contentto support desired vegetationwithout intense irrigation will oftengenerate runoff even during smallstorm events. For this reason, sitesand/or subwatersheds withoutadequate topsoil or soil qualityrestoration (SQR) applied to adepth of at least 4 inches shouldbe treated as if they were coveredby 50% impervious cover, forthe purposes of calculating WQvrequirements. Refer to Section7.03 (Soil Quality Management andRestoration) for more information.For a given practice or subwatershed area, a volumetric runoff coefficient (Rv), needs to be calculated.Rv is based on the percentage of impervious cover in the area of interest.EQUATION 3.01-2.2Rv 0.05 0.009 (I)I percentage of impervious cover, written as a percentage (i.e. for 73% impervious cover, I 73)Example #1Given imperviouscover (I) 73%Rv 0.05 0.009(I) 0.05 0.009 (73) 0.7070Example #2Given imperviousEffective impervious 73% (100% - 73%) x 0.50 cover (I) 73%;86.5%Topsoil/SQR ( 4 in.)Rv 0.05 0.009 (I) 0.05 0.009 (86.5) 0.8285Step 2Calculate WQv by the equation below:EQUATION 3.01-2.3WQv (43,560 SF / acre) [(P)(Rv)(A)] / 12P 1.25 inches (WQv storm event depth)Rv from Equation 3.01-2.2A area (in acres)WQv will be in units of cubic feet.6Example #1Rv 0.7070WQv (43,560 SF/acre) [(1.25 in)(0.7070)(1 ac)] /12 3,208 CFExample #2Rv 0.8285WQv (43,560 SF/acre) [(1.25 in)(0.8285)(1 ac)] /12 3,759 CF
IOWA STORM WATER MANAGEMENT MANUALCHAPTER 3.01 UNIFIED SIZING CRITERIATable 3.01-2.2 includes values of Rv and WQv based on various levels of site impervious cover. Valuesin this table may be used for estimation in preliminary design or for reference during design review.Final design calculations should calculate WQv using the preceding equations based on more detailedinformation about post-development site or subwatershed conditions.NOTEtable 3.01-2.2: WATER QUALITY TREATMENT VOLUME ANDADJUSTED NRCS CURVE NUMBERS FOR THE WQv EVENTwqVAdjusted cn% Impervious arearv(PER 1199Compliance with the WQv criteria isbased on proper design of BMPs ona given site to address this standard,and calculations to demonstrate howsuch practices are collectively usedto meet the requirements.Although WQv is a volumetric standard, in some cases it may be necessary to calculate peak flow ratesor generate runoff hydrographs for this event. For example, bioswales are designed to pass the peakflow rate at a limited velocity for a certain length of time. Another example of this design problem issizing structures to divert the WQv peak flow rate to an off-line practice. Adjusted curve numbers (CN)need be used to calculate runoff hydrographs for the WQv. Methods to calculate these adjusted CNsand develop hydrographs and peak flow rates for the WQv event are explained in detail within Section3.02 (Small Storm Hydrology).7NOTECNs used to model the WQv eventshould be different than thoseused for larger storm events. Oneeffective strategy is to createa watershed modeling usingstandard curve numbers, then savea copy of the model and enter theCNs for use in modeling the WQvevent only.
CHAPTER 3.01 UNIFIED SIZING CRITERIAIOWA STORM WATER MANAGEMENT MANUAL3. Channel Protection Standard (CPv)As watersheds develop into urban land uses, the largest increases in flow rates and volumes (bypercentage) are expected during the smallest storm events. Under natural conditions, very little rainfallbecomes surface runoff. Soil compaction and placement of impervious surfaces makes it much morelikely that runoff is created by small rain events. Without practices to mitigate this effect, urban streamcorridors will experience much higher flow rates for longer periods than would naturally occur. Thisincrease in flow leads to higher velocities and erosive forces over an extended period of time. Channeland streambank instability is often observed as a result.NOTETables 3.01-2.3-A and -Bdemonstrate that changes in runoffvolume and peak rate above thenatural baseline are greatest (byproportion) during the smaller, mostfrequently occurring storm events.In this single-family developmentexample, post-development flowvolumes during a 1-year stormevent are more similar to whatwould have been expected froma 10-year event under naturalconditions.TABLE 3.01-2.3-A. Examples of Hydrology Changes - VolumeStorm Event1-year (CPv), 2.63”If SQR was not implemented forthis example, the peak flow ratefor the 1-year event would beprojected to increase to 36 cfs,which would be more similar to the100-year peak flows for naturalconditions.AgricultureVolume (cf)Volume (cf)12,10050,500IncreaseOver NaturalConditionPostdevelopedIncreaseOver NaturalConditionVolume (cf)317%54,800353%2-year, 3.04”21,00069,000229%73,800251%5-year, 3.78”41,600106,100155%111,300168%10-year, 4.48”65,600144,600120%149,600128%25-year, 5.56”109,200208,30091%212,60095%50-year, 6.48”151,200265,50076%268,80078%100-year, 7.48”200,900329,80064%331,80065%NOTEIn the same example, postdevelopment flow rates duringa 1-year storm event are moresimilar to what would have beenexpected from a 25-year eventunder natural conditions.NaturalConditionTABLE 3.01-2.3-B. Examples of Hydrology Changes - Peak RateIncreaseOver NaturalConditionAgriculturePeak Flow(cfs)Peak Flow(cfs)1-year (CPv), 2.63”0.79131,546%182,229%2-year, 3.04”1.919874%251,223%5-year, 3.78”5.330460%39637%10-year, 4.48”9.841320%53442%25-year, 5.56”1960225%76310%50-year, 6.48”2777185%96255%100-year, 7.48”3796158%118218%Storm EventPostdevelopedIncreaseOver NaturalConditionNaturalConditionPeak Flow(cfs)Basis of Example Above:Study Area 20 acresNatural Conditions: Prairie, CN 58, Tc 41.7 minutesAgricultural Conditions: CN 74, Tc 22.4 minutesPost-Developed: 18 acres single family (40% impervious, HSG B soil, CN 76*), 2 acres park (CN 61*),Tc 16.1 minutes*Assumes 8” SQR established on open spacesNRCS TR-55 model based on the conditions above8
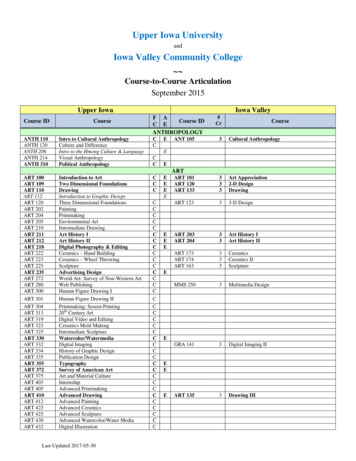
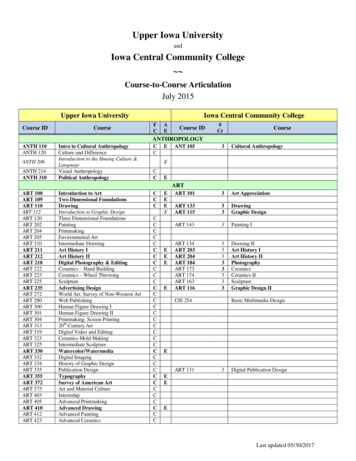
IOWA STORM WATER MANAGEMENT MANUALCHAPTER 3.01 UNIFIED SIZING CRITERIAFigure 3.01-2.2 -- Graph of Hydrology ChangesNOTEThe rainfall depth value for the CPvevent varies across the state. SeeSection 2.02 (Rainfall and RunoffAnalysis) for values.Figure 3.01-2.3, 2.4 -- INSERT Photos (Channel Instability Examples)[TO COME]Figures 3.01-2.3 -- Tall vertical, bank erosion is undercutting trees along a creek in a urban watershed9
CHAPTER 3.01 UNIFIED SIZING CRITERIAIOWA STORM WATER MANAGEMENT MANUALFigure 3.01-2.4: City staff noted that the small urban stream in this area was 2 feet wide and 1 feet deep when the area was platted about 30 years before this photo wastaken. In this photo, the stream had a top width of around 40 feet and a depth of 15 feet.NOTEAlternatively, CPv may beaddressed by increasing the sizeof water quality BMPs. In thiscase, the CPv volume would beused in place of the WQv volumein the sizing calculations for suchpractices.Practices designed to meet this standard, will better mimic natural site hydrology for small storm events.Management of this condition is typically addressed by providing extended detention of the 1-year, 24hour storm event (CPv event). Extended detention greatly reduces allowable outflow from this event,providing a drawdown period of no less than 24 hours. To meet this criteria, a BMP with sufficienttemporary storage volume is needed to capture runoff from the rainfall event, while not exceeding thecalculated allowable release rate.Section 3.02 (Small Storm Hydrology) details a step-by-step approach to design practices to provideextended detention meet the CPv criteria.A few notes to reinforce when referring to that procedure in Section 3.02:NOTEBMPs also must meet anypractice-specific design criteriarelated to the CPv, such asallowable ponding depth. The initial steps of that procedure (steps 1-4) use software running TR-20 or TR-55 calculationmethods to calculate runoff hydrographs for pre- and post-developed site conditions. Step 5 computes the peak outflow discharge required to provide the extended drawdown period.This becomes the metric used later to measure compliance. Steps 6 and 7 are used to calculate a PRELIMINARY ESTIMATE of storage volume. This valueshould be used early in the design process, to get an initial idea of the volume and surface arearequired for the BMP. This is just an estimate of the storage that will be needed to meet therelease rate goals, this is NOT a storage volume to be used to show compliance with the CPvstandard. The remaining steps guide the final design of the BMP, including the outlet controls.To demonstrate compliance with the CPv criteria, the final design routing calculations will need to show that the release ratefrom the site does not exceed the allowable peak outflow discharge rate (from Step 5 in the procedure summarized above).10
IOWA STORM WATER MANAGEMENT MANUALCHAPTER 3.01 UNIFIED SIZING CRITERIAB. LARGE STORM CRITERIANOTEInstallation of BMPs to address Water Quality, will likely also lead to reductions in the quantity of runoff.However, the following criteria are grouped under this heading as they primarily relate to the design ofpractices that control the rate and volume of surface runoff during larger storm events.1. Overbank Flood Protection (Qp)This criteria is primarily intended to address the following issues:a.b.Reduce the potential overbank flooding in small urban watersheds.Runoff from development sites should not increase the likelihood of out of bank floodingduring these moderate storm events.Practices designed to meet this standard, should better mimic natural site hydrology for these types ofevents. Management to meet this standard requires BMPs with sufficient temporary storage volumeto limit runoff rates from the site area to not exceed maximum allowable rates.To demonstrate compliance with the Qp criteria, the final design routing calculations will need to show that the release rate fromthe site does not exceed the rate based on natural conditions for an event of the same type (or local jurisdictional requirements).Natural conditions shall be defined as a land use of “meadow in good condition” with time ofconcentration calculated based on characteristics consistent with that land use and local HydrologicSoil Group (refer to margin at right for more information).For reference, existing conditions shall be defined as land uses and site conditions as they existimmediately prior to the proposed development.Advisory: The modified rational method should not be used for preliminary OR final design of stormwater detentionstorage BMPs.TABLE 3.01-2.4: OVERBANK FLOOD PROTECTION CRITERIA SUMMARYallowable release rate2-year storm2-year peak rate, based on natural conditions5-year storm5-year peak rate, based on natural conditions10-year storm10-year peak rate, based on natural conditions*Section 2.02(Rainfall and Runoff Analysis)Section 2.03(Time of Concentration)Prevent local flash flooding due to surcharge of downstream storm sewer networks.Most jurisdictions require new developments to size storm sewer systems to be designedto convey runoff from either the 5- or 10-year storm event without surcharge of the system.Some older systems may have been designed to a lesser standard (i.e. convey the 2-yearstorm). There is a need to control runoff rates from development sites so that they do notexceed the capacity of downstream storm sewer networks during these types of events.storm eventFor additional details, refer to thefollowing sections:* Some jurisdictions may require to check that release rate from this event also does not exceed 5-year peak rate, based onexisting conditions.When calculating the CN to be used for natural conditions, determine the proportion of the site areathat falls into each HSG category. Then use those ratios to calculate the weighted average of CNs formeadow in good condition, based on the local soil properties. However, if the calculated value exceedsthe maximum value set by the local jurisdiction, then the maximum value allowed should be used whenmodeling “natural” conditions.11Section 2.05(NRCS TR-55 Methodology)Section 2.06(Runoff HydrographDetermination)Sections 9.01-9.12(Detention BMP sections)NOTERegardless of local soil types,a maximum value of CN 71should be used to represent“natural” conditions. This wouldlimit runoff rates to levels similarto what would occur from HSGC soils.Jurisdictions may decide toadopt standards with a morerestrictive maximum value. Forexample, setting a maximumvalue of CN 58 for “natural”conditions would set releaserates to be
The Unified Sizing Criteria (USC) are a set of measurement standards used throughout this manual to evaluate management of the quality and quantity of stormwater runoff. . IOWA STORM WATER MANAGEMENT MANUAL TE 3.01 UNIFIED SIZING CRITERIA The Recharge Volume is defined as: . if appropriate liners are installed and the system is configured .