Transcription
Covid EconomicsIssue 44, 25 August 2020Did the COVID-19 Pandemic triggernostalgia? Evidence of MusicConsumption on SpotifyTimothy Yu-Cheong Yeung1Date submitted: 21 August 2020; Date accepted: 22 August 2020Covid Economics 44, 25 August 2020: 154-185By scraping data of almost 17 trillion plays of songs on Spotify in sixEuropean countries, this work provides evidence that the lockdown imposedin the midst of the COVID-19 pandemic significantly changed the musicconsumption in terms of nostalgia. This work constructs a binary measureof nostalgia consumption of music and employs country-specific logisticregressions in which lockdown is taken as a treatment that interacts with aquadratic trend. The lockdown altered the trend of nostalgia consumptionupward, which peaked roughly 60 days after the lockdown. A placebotest shows that the upward turn of slope is not an annual pattern. On theother hand, COVID incidence rate does not provide significant additionalexplanatory power to the model. This work shows that Spotify's users reactto the lockdown even when COVID incidence rate is low and the impactstays high even the incidence rate has peaked, suggesting that demand fornostalgia tends to respond to the drastic and lasting change caused by thelockdown rather than to the fluctuations in the viral infection.1Postdoctoral Research Fellow, Faculty of Law, KU Leuven, Leuven, BelgiumCopyright: Timothy Yu-Cheong Yeung154COVID ECONOMICSVETTED AND REAL-TIME PAPERS
1IntroductionA comment on Radiohead’s 1995 classic Fake Plastic Trees YouTube video by an user LuizaMartins:“Who is listening to this song in quarantine against covid-19? :D”attracted more than 2600 likes in four months time since April 2020. Many other examplescould be found in other music videos.Covid Economics 44, 25 August 2020: 154-185Did the COVID-19 pandemic trigger widespread nostalgia? Nostalgia was considered as aform of melancholia or depression (McCann, 1941; Rosen, 1975). Gradually researchers move onto recognize the causes and the positive aspects of nostalgia. Researchers found that negativemoods trigger nostalgia and nostalgia induces positive affects (Wildschut et al., 2006), whilesadness predicts nostalgia (Barrett et al., 2010). Given its scale and the adverse socio-economicimpact caused (Martin et al., 2020), it is natural to hypothesize that the COVID-19 pandemicinduced a widespread nostalgic feeling.A crisis, either personal, national or global, certainly changes human behaviors and inparticular consumption pattern. Women tend to consume more on beauty products duringrecessions, known as lipstick effect in consumer psychology that could be explained by matingand professional motives (Hill et al., 2012; Netchaeva and Rees, 2016). Unemployment is foundto correlate with heavier alcohol and drug consumption (Layne and Whitehead, 1985; Janlertand Hammarström, 1992; Power and Estaugh, 1990; Henkel, 2011), though Catalano et al.(2011) challenged and claimed that the answer remains mixed. Although music is often discussed and consumed alongside alcohol, the academic literature is silent on the change in musicconsumption during a time of difficulty. If alcohol consumption is considered as a remedy, musiccould also take this role. Drinking is arguably an effective way to forget the present difficulties,to avoid dealing with current problems and to keep one’s world isolated from others. Musiccould also achieve partially these goals. Music of the past can in addition bring in nostalgiaor reminiscence that contributes to certain healing effects (Barrett et al., 2010; Lazar et al.,2014). Music therapy aiming at evoking nostalgia has been shown effective towards patients ofdementia (Glynn, 1992; Mills and Coleman, 1994; Beard, 2012).155COVID ECONOMICSVETTED AND REAL-TIME PAPERS
Nostalgia has long been a research topic in consumer psychology (Holbrook, 1993; Holbrookand Schindler, 2003; Sierra and McQuitty, 2007; Holak et al., 2007) and marketing strategiesbased on nostalgic feelings have been widely adopted (Unger et al., 1991; Russell, 2008; Cuiet al., 2015). Hirsch (1992) suggested that by defining nostalgia as a yearning for an idealizedpast, nostalgia marketing induces displacement of idealized past emotions onto objects. Difficult times are thus the successful times for nostalgia marketing that alludes to a better past(Spaid, 2013).The COVID-19 pandemic has undoubtedly altered consumers’ consumption patterns (HallCovid Economics 44, 25 August 2020: 154-185et al., 2020; Baker et al., 2020) and affected heavily the consumption on cultural goods. Simet al. (2020) studied the music consumption on Spotify of 60 countries and found that musicconsumption online had declined during the COVID-19 pandemic. Weed (2020) discussed thecancellation of sport events had led TV channels to replay matches in the past and discussedthe potential restorative nature of such a form of lockdown nostalgia in supporting well-beingduring the lockdown. Gammon and Ramshaw (2020) discussed the role of nostalgia consumption during the COVID-19 pandemic. The current work is, to the best of the author’s research,the first quantitative study of nostalgia consumption of music during the COVID-19 pandemic.The pandemic manifests itself in many dimensions of our daily life. The viral infection isonly the surface layer and in fact does not impact directly most of the population. Instead, thethreat of the virus and the resulting distress has substantially changed the costs and benefits ofour behaviors. Since some people were reluctant or not willing to comply to orders or to keepsocial distance, governments took actions to impose exceptional measures and even “lockeddown” a whole nation. Under a lockdown or a quarantine, people’s freedom is heavily limitedand physical interactions among people outside their close families are almost non-existent. Forexample, under the Belgian national lockdown order, citizens were required to stay at homeand to go out of doors only for reasons deemed “essential”.1 Outdoor exercise was still allowed,provided that social distancing guidelines were upheld. Temporary police check points were setup to ensure that citizens complied with the rules. The measures adopted by Belgian authorities were, in several respects, less restraining than those enacted by neighboring countries. InFrance, citizens were required to sign a document attesting the reason for going out of doors1Details of the measures can be found at https://www.belgium.be/en/news/2020/coronavirus reinforced measures.156COVID ECONOMICSVETTED AND REAL-TIME PAPERS
and were only permitted to roam within one kilometer of their home for an hour each day.Children in Spain were barred from leaving home for nearly two months. The scale of thelockdown is unprecedented. The lockdown and the viral infection should not be consideredequivalent in determining human behaviors and estimations of their respective effects are thefocus of the current work.To quantify nostalgia seems to be a prohibitive challenge. This work measures nostalgia byan individual’s music consumption on a popular music streaming platform Spotify. Spotify publishes daily charts of top 200 songs of different countries and, through its API, users can scrapCovid Economics 44, 25 August 2020: 154-185the information of the tracks. Each song is associated with its release information on whichthis work arbitrarily classifies a song as a nostalgia consumption if the number of days sincerelease is more than 1095 days (3 years).2 Using COVID incidence rate and taking lockdownas a treatment that interacts with a quadratic trend, a logistic regression weighted by numberof plays is employed to explain nostalgia consumption of music based on the information of thedaily top 200 tracks over a period of seven months.The current work finds that nostalgia consumption took a sharp upward change in thebeginning of the lockdown and fell when time went on and COVID incidence rate does notsignificantly improve the model’s explanatory power. This work aims to discover individuals’consumption preference on cultural goods, music in this particular case, and to provide evidenceof nostalgic consumption during a time of widespread difficulty. Last but not least, this workpoints to a possible and relatively low-cost remedy in the time of the pandemic.2DataSpotify is a Swedish music streaming platform, publicly traded in the NYSE through the holding company Spotify Technology S.A. Since 2008, Spotify has provided access to over 60 millionsongs on which users enjoy free service with advertisements. Paying subscribers, like Netflixusers, pay a fixed monthly subscription fee and thus enjoy offline and advertisement-free listening. The company announced in July 2020 that active users reached 299 million whereas 1382Results based on different definitions of nostalgia consumption, e.g. five years instead of three years, multiplelevels of nostalgia, etc., are similar.157COVID ECONOMICSVETTED AND REAL-TIME PAPERS
million users are paying subscribers.34 Number of plays is massive. Top 200 songs in the UK intotal were played 20 million times on an average day in 2020.5 Along with its rise in popularity, Spotify has increasingly drawn attention from the academia (Vonderau, 2019; Mähler andVonderau, 2017; Meier and Manzerolle, 2019), thanks to its easy-to-use API data query system.This work fixes the sample period between 1 January and 31 July 2020. The COVID-19pandemic hit hard most of the European countries in March 2020 and in succession they wentinto certain forms of lockdown (or a less dramatic term: confinement). The peak of the firstwave passed roughly in May and the situation improved significantly towards July. By the endCovid Economics 44, 25 August 2020: 154-185of July, there were signs of a second wave.6 The sample period is arguably sufficiently long tocapture the initial shock and the subsequent adjustment back to the norm. This research relieson data of six European countries, namely, Belgium, France, Italy, Spain, Sweden and UnitedKingdom, involving almost 17 trillion of plays. These countries, except Sweden, had been undersome forms of national lockdown from March to May. Some brief information on the lockdownis provided in Table 1. Although scraping data of some more countries is not a difficult or timeconsuming task, this work limits itself to these six countries for two reasons. First, as readerswill see in later sections, countries experienced very different music consumption patterns, notonly in quantity but also in quality in terms of nostalgia level. Pooling countries into one singlesample may not be an appropriate approach, though gathering more information and workingwith a panel of countries are possible. Second, big nations, for examples, the US, Canada andAustralia, had experienced multiple outbreaks of COVID infection at different points of timewithin the nation and thus lockdown measures were not uniform across the nation. Spotify, onthe other hand, does not provide regional consumption information. The misalignment of dataaggregation level casts doubt on the validity of such an analysis. The six countries chosen include two heavily affected countries that went into lockdown relatively earlier, Italy and Spain,two less severely affected countries but also went into tight lockdown, France and Belgium, theUK, who reacted relatively later than others, and Sweden, who had not been into restrictivelockdown. Sweden is chosen in the hope that it could serve as a control 7085Author’s own showing-in-europe158COVID ECONOMICSVETTED AND REAL-TIME PAPERS
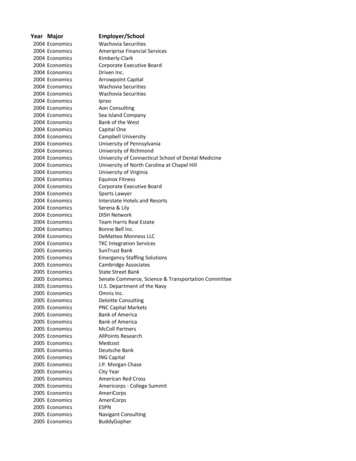
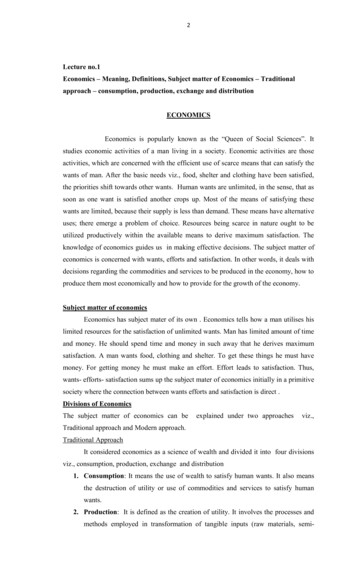
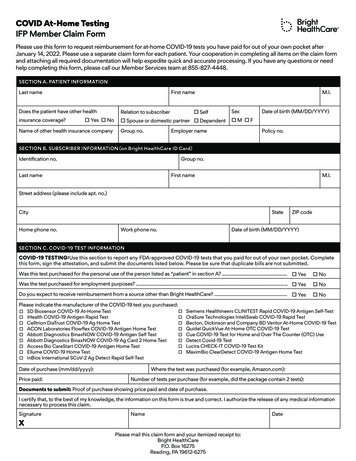
Spotify publishes daily the top 200 mostly played songs of different countries along withtheir numbers of plays. Through its API, information on songs’ release date is available. Asong is defined as a nostalgia consumption if the number of days since release is larger than1,095 (three years). Figure 1 illustrates the average nostalgia level of the daily top 200 songsof the six countries from 1 August 2018 to 31 July 2020, along with a red vertical line corresponding to the first lockdown day.7 The average nostalgia level surges in Christmas time andrises gradually after the lockdown. Sweden sees another annual spike in nostalgia consumptionof music on the Midsummer Day. To check if the rise during the lockdown is not a annualpattern, Figure 2 matches the average nostalgia level of 2020 and 2019 to the January-JulyCovid Economics 44, 25 August 2020: 154-185period and shows that, while the case in Sweden is unclear, other countries recorded a higheraverage nostalgia level in the same period of 2020.A very first challenge to any correlation between the pandemic and nostalgia consumptionis that music companies may publish fewer songs during the pandemic because advertising mayheavily be affected. If no hit new songs are supplied to the market, users may revisit oldersongs to satisfy their demand for music. Figure 3 illustrates the numbers of new tracks amongthe top 200, defined as released within 30 days before the day of observation, from January2020 to July 2020, overlaid with the 7-day moving-average of daily new COVID-19 cases permillion of population (incidence rate). Counts of daily new COVID-19 cases are collected fromEU Open Data Portal.8 Any fall in the number of new tracks among the top 200 does notperfectly reflect fewer releases of new songs as the chart is certainly endogenously determined.However, the three-year threshold that defines nostalgia consumption is sufficiently far fromthe day of the observation, any correlation between the pandemic and nostalgia consumptionis thus not directly driven by number of new releases. Imagine a hypothetical day having noadditional new release. Users’ preference may remain unchanged and listen to the same songsso that the overall nostalgia level is the same. Only when people switch to older songs (morethan 1,095 days) the overall average nostalgia level would go up. Still, fewer new releases mayinduce an indirect effect on nostalgia consumption because new songs occupy users’ time thatwould have been consumed on nostalgic songs. Although number of new releases arguably felltogether with a rise in COVID infection, whether it is causal is far from clear. Number ofnew releases seems to be low in the beginning of the year and gradually increases over the78The red line of Sweden corresponds to the date of travel advice within the nation on 24 /covid-19-coronavirus-data159COVID ECONOMICSVETTED AND REAL-TIME PAPERS
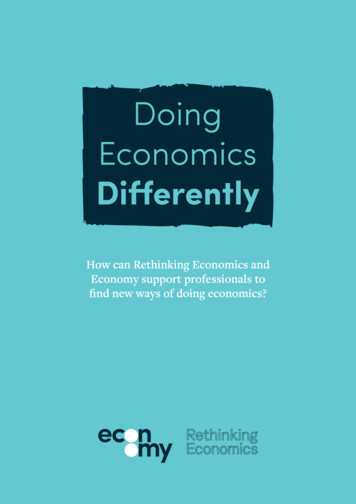
first quarter. A subsequent adjustment possibly follows in the second quarter, coinciding withthe rise in COVID infection. In the following regression analysis, the number of new tracksamong the top 200 released within the past 30 days will always be included as a control variable.Covid Economics 44, 25 August 2020: 154-185Table 1: Lockdown InformationCountryImplementation DateBelgium18 MarchFrance17 MarchItaly10 MarchSpain14 MarchSweden*18 MarchUnited Kingdom24 MarchFirst Relaxation DateMeasures11 MayRestrictive Quarantine11 MayRestrictive Quarantine4 MayRestrictive Quarantine11 MayRestrictive QuarantineNAMild and Voluntary10 MayRestrictive Quarantine*Sweden had no tight lockdown measures but social distancing and travel advices.Another concern is about the compositions of users pre-lockdown and in-lockdown are different. Lockdown may draw new users to the platform, perhaps due to having more abundantfree time, who tend to listen to older songs. While it is impossible to identify users, data, asshown in Figure 4, suggest that the pandemic caused music consumption to fall, consistent withthe finding by Sim et al. (2020). While Belgium saw the number being stable, France, Italyand Spain recorded a dip in the beginning of the lockdown. In the meantime, Sweden and theUK followed their pre-lockdown downward trend. Spikes of plays during the Christmas time inBelgium, Sweden and the UK coincide with spikes in nostalgia consumption. Holiday effectsseem to be present, which may then affect the average nostalgia consumption.Based on the discussion above, any valid regression analysis should take into account seasonal patterns, issues of new tracks and total number of plays. Moreover, any effects of lockdownmay not show up right at the beginning of the lockdown period, but gradually reflected by anupward trend.33.1Empirical AnalysisEmpirical StrategyThe empirical analysis will rely on country-specific logistic regressions. Each play is a choicebetween a set of nostalgic songs (released more than 1,095 days before the day of observation,160COVID ECONOMICSVETTED AND REAL-TIME PAPERS
Covid Economics 44, 25 August 2020: 154-185Figure 1: Nostalgia Level August 2018 - July 2020t) and a set of new songs (released within 1,095 days before day t). The actual implementationis a logistic regression in which the dependent variable (nostalgia consumption 1) weightedby number of plays. The main explanatory variable is the lockdown indicator (equals 1 if thelockdown implementation day tL t, and 0 otherwise). Note that the no ending date of thelockdown has been coded. The very first reason is that lockdown was gradually relaxed and161COVID ECONOMICSVETTED AND REAL-TIME PAPERS
Covid Economics 44, 25 August 2020: 154-185Figure 2: Nostalgia Level January 2020 - July 2020 compared to the same period of 2019the degress of relaxation varies across countries. Secondly, lockdown was announced only a daybefore the actual implementation because the governments wanted to minimize choatic trafficas much as possible, but the relaxation in phases was announced a week or some weeks beforethe implementation. One would expect the lockdown induced a shock but the relaxation wouldonly lead to gradual adjustment. As our model allows a quadratic trend during the in-lockdown162COVID ECONOMICSVETTED AND REAL-TIME PAPERS
Covid Economics 44, 25 August 2020: 154-185Figure 3: Numbers of New Tracks and COVID Infection, January 2020 - July 2020period, it should be able to capture the non-linear variation from the beginning of the lockdownto the gradual relaxation towards June and July. Another explanatory variable of interest is theCOVID incidence rate, which is precisely the natural logarithmic transformation of the 7-daymoving-average of the number of daily new COVID cases per million of population.9 This work9The 7-day MA is computed by averaging the numbers of new COVID cases per million of the past six daysand that of day t.163COVID ECONOMICSVETTED AND REAL-TIME PAPERS
Covid Economics 44, 25 August 2020: 154-185Figure 4: Daily (ln) Total Numbers of Plays, August 2018 - July 2020employs equal-weighted 7-day moving average to measure daily COVID infection because itgives a better measure of how people perceive the pandemic and also corrects the reportingbias of weekends, holidays and some exceptional negative values (ex-post adjustments). Theaim of the regression is to check if the lockdown causes the time trend to change its direction andcheck if on top of the trend component COVID infection provides additional explanatory power.164COVID ECONOMICSVETTED AND REAL-TIME PAPERS
To validate the result, this work proposes the following checks. First, we conduct 10-foldcross-validations to compare five different specifications (Zhang and Yang, 2015). Next, wecheck if the break of the slope of the trend at the first lockdown day could be defended as thetrue structural break. Point estimates and confidence intervals of the change in slope at 21different supposed break points are compared side-by-side. The final check is a placebo testthat imposes a hypothetical pandemic on the same period in 2019. The aim is to verify ifthe sharp change of trend at the break date is not merely an annual pattern. A no-result isthus a piece of evidence supporting that the pandemic indeed changed individuals’ nostalgiaCovid Economics 44, 25 August 2020: 154-185consumption preference.3.2Logistic RegressionThe empirical analysis relies on a logistic regression with standard errors clustered in days. Themodel employs a difference-in-difference approach where lockdown is considered as a treatmentand the period since the lockdown is the treated sample. The main focus of the analysis iswhether lockdown led to a change in nostalgia consumption preference revealed by changes inconstant and slope. Denote the probability of an event Y 1 (a nostalgia song being played)by p. The log-odds is thus: p logit(p) ln1 pWe assume that the log-odds of Y 1 is explained by a set of explanatory variables thatincludes a lockdown indicator and its interaction with a quadratic trend and 7-day movingaverage of COVID incidence rate. The time variable t is centered at the first lockdown day.The log-odds is modelled as the following:logit(p) α1 α2 Lockdownt β1 t β2 t2 β3 Lockdownt t β4 Lockdownt t2 β5 COV IDt x0 γ(1)where the vector x includes the number of newly released songs, the log of total plays of theday, the average nostalgia level of the same day of 2019, the day of the week (Monday, Tuesday and so on), and five relatively more distinctive track features (acousticness, danceability,energy, liveness and valence). The inclusion of track features controls for the music trend of165COVID ECONOMICSVETTED AND REAL-TIME PAPERS
the day. For instance, users may have a preference of more acoustic music to other genres andthey might only find the desired mood in old songs.The logistic regression maximizes the following log-likelihood function:N hiXl(β) Yi ln(pi ) (1 Yi )ln(1 pi )iThis research proposes the following hypotheses:Covid Economics 44, 25 August 2020: 154-1851. β3 0. Lockdown sharply increased the slope.2. β1 β3 0 and β2 β4 0. Nostalgia consumption increased in the beginning of thelockdown and fell when time went on.3. β5 0. Higher incidence rate induces more nostalgia consumption.Hypotheses 2 and 3 may be valid simultaneously but may instead exclude one another.Lockdown period covers the days of severe infection, and thus two hypotheses may compete forsignificance.Table 2 reports the coefficients of selected variables of the regression results of the six countries. Nostalgia consumption followed a general downward trend before the lockdown in allcountries except the UK. A significant β3 implies that the trend took a sharp turn at thelockdown implementation. Overall, we find support of Hypothesis 1. To better illustrate theevidence, Figure 5 shows the prediction of nostalgia consumption against numbers of days after lockdown. No incremental increase in nostalgia consumption right in the beginning of thelockdown, but it gradually rises and then falls towards the end of the sample period, consistentwith Hypothesis 2. The peak is found roughly 80-100 days after the first day of the lockdown,coinciding roughly with the intermediate phase of relaxation in June. It also shows a starkdifference from the counterfactual supposing that nostalgia consumption has followed the prelockdown trend. The UK actually exhibits a similar pattern. The relatively flat in-lockdowntrend is a result of the impreciseness of the pre-lockdown trend that diminishes the scale. Besides, we find no evidence supporting an upward adjustment of the constant term (α2 ), exceptin Spain.166COVID ECONOMICSVETTED AND REAL-TIME PAPERS
Table 2: Logit Regression: Baseline ResultsCovid Economics 44, 25 August 2020: 154-185Pre-Lockdowntime (β1 )time-sq (β2 )in-Lockdowntime (β3 )time-sq (β4 )β1 β3β2 β4LockdownCOVIDTotal playsNew tracksNostalgia 2019Weekday FETrack featuresNPseudo 06)(0.0002)0.0158***0.0616***-0.0009*** )-0.0163*** 730)YesYesYesYes554123431 33736103490.13800.1305-94216643 -1.363e 852-1.739e 08Standard errors clustered in days in parentheses167 9*** -0.0269**** 48 1713501823 41660405250.07220.24730.2068-2.315e 08 -1.819e 08 -8.551e 08p .1, p .05, p .01COVID ECONOMICSVETTED AND REAL-TIME PAPERS
As any significant (and insignificant) results could be driven by outliners, Figure 6 plots dailyaverage values of residuals of a model that excludes the time trend and COVID indicence rateagainst time. The distribution of residuals across time shows what would be explained by theexcluded time component and COVID. Roughly speaking, those residuals follow a downwardtrend before the lockdown and an upward trend after the lockdown, consistent with Hypothesis2. Figure 7 zooms to the period between 1 February to 31 May to verify if the slope tooka sharp change at around the lockdown date. While the case of Spain is unclear, other fivecountries tend to show some upward shift in slope.Covid Economics 44, 25 August 2020: 154-185COVID incidence rate is insignificant for Belgium, France, Italy and Spain in the baselineregressions. Its impact may well be absorbed by the change in trend due to the lockdown.10 InSweden where no hard lockdown has been imposed, COVID incidence rate is highly significant.One percentage point increase in the incidence rate is associated with an increase in the oddsof nostalgia consumption by a factor of 1.5. Note that even Sweden had no tight lockdownmeasures, it was reported that mobility had decreased significantly within Sweden.11 Despitethat, further checks are necessary before pinning down the effect on nostalgia consumption ofmusic.Total number of plays are positive and significant in Belgium and Sweden, while negativeand significant in France and Italy. These mixed evidence give no answer to the expectationthat newly-joined users, may be drawn to Spotify due to the lockdown, tend to listen to oldersongs.As shown in Figure 8, the peak of COVID incidence rate predates the peak of nostalgiaconsumption, except in Sweden. Lockdown broke the trend but the effect became full-blownafter the peak had passed. Evidence so far suggest that users tend to react to the lockdownonly gradually but COVID incidence fails to explain the rise and fall of nostalgia consumption.This conclusion is intuitive as people may not pay attention to the ups and downs of incidencerate while lockdown is a drastic, encompassing and exceptional measure that produced a lastingeffect regardless the incidence rate.10Regressions (not shown) removing any trend components show that COVID incidence rate is positive andsignificant for all six COVID ECONOMICSVETTED AND REAL-TIME PAPERS
Covid Economics 44, 25 August 2020: 154-185Figure 5: Prediction of Nostalgia Consumption with 95% CI: Illustrating Changes in Slopebefore and after Lockdown169COVID ECONOMICSVETTED AND REAL-TIME PAPERS
Covid Economics 44, 25 August 2020: 154-185Figure 6: Residual Plots: Illustrating Nostalgia Level over time170COVID ECONOMICSVETTED AND REAL-TIME PAPERS
Covid Economics 44, 25 August 2020: 154-185Figure 7: Zoomed Residual Plots: Illustrating Nostalgia Level over time3.3Lockdown and COVID Infection: Which one is more shocking?The baseline regressions show that COVID incidence rate is not a robust and significant factorin explaining nostalgia consumption, given a quadratic trend is modelled. This result seems tosuggest that users react to the lockdown but less so to the actual COVID infection figures. How-171COVID ECONOMICSVETTED AND REAL-TIME PAPERS
ever, as mentioned, these two factors are certainly competing for significance as both of themmeasure two different dimensions of the pandemic. Readers may have already noticed that theCOVID-19 pandemic appears coinciding the trend of the nostalgia consumption with a delayedpeak of the latter. While the baseline model assumes a linear relationship between COVIDincidence rate and the log-odds as Equation (1) indicates, this section attempts to explore anynon-linear effects of COVID. People might have been negligent when the pandemic first hit thecountry but then shocked by the incapacity of hospitals to cope with patients. When time wenton, people got used to the shock and reverted back to their normal consumption preference.As a result, the effect of COVID incidence is non-linear in time. This hypothesis suggests thatCovid Economics 44, 25 August 2020: 154-185people do react to current COVID infection level but such an effect depends on time, perhapsproducing an inverted-U shaped curve of nostalgia consumption during the lockdown, as shownby Figure 8.To test this hypothesis, we modify the logistic regression model by dropping lockdown butinteracting the (natural log of) COVID incidence rate with the quadratic trend. The idea isto allow the effect of COVID infection to be non-linear over the time dimensi
The COVID-19 pandemic has undoubtedly altered consumers' consumption patterns (Hall et al., 2020; Baker et al., 2020) and a ected heavily the consumption on cultural goods. Sim et al. (2020) studied the music consumption on Spotify of 60 countries and found that music consumption online had declined during the COVID-19 pandemic.