Transcription
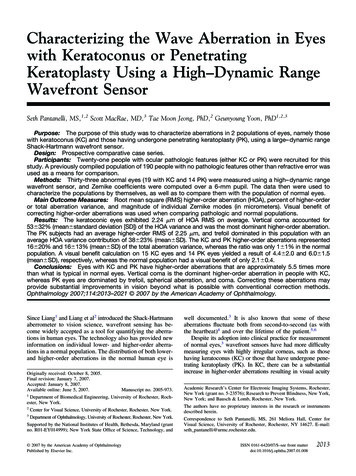
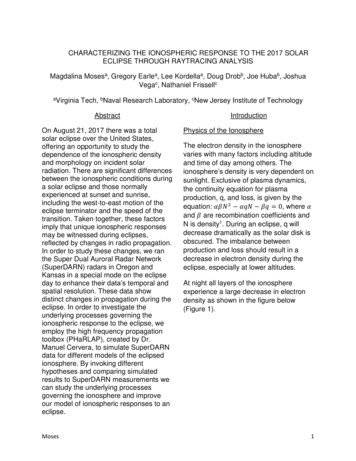
CHARACTERIZING THE IONOSPHERIC RESPONSE TO THE 2017 SOLARECLIPSE THROUGH RAYTRACING ANALYSISMagdalina Mosesa, Gregory Earlea, Lee Kordellaa, Doug Drobb, Joe Hubab, JoshuaVegac, Nathaniel FrissellcaVirginiaTech, bNaval Research Laboratory, cNew Jersey Institute of TechnologyAbstractOn August 21, 2017 there was a totalsolar eclipse over the United States,offering an opportunity to study thedependence of the ionospheric densityand morphology on incident solarradiation. There are significant differencesbetween the ionospheric conditions duringa solar eclipse and those normallyexperienced at sunset and sunrise,including the west-to-east motion of theeclipse terminator and the speed of thetransition. Taken together, these factorsimply that unique ionospheric responsesmay be witnessed during eclipses,reflected by changes in radio propagation.In order to study these changes, we ranthe Super Dual Auroral Radar Network(SuperDARN) radars in Oregon andKansas in a special mode on the eclipseday to enhance their data’s temporal andspatial resolution. These data showdistinct changes in propagation during theeclipse. In order to investigate theunderlying processes governing theionospheric response to the eclipse, weemploy the high frequency propagationtoolbox (PHaRLAP), created by Dr.Manuel Cervera, to simulate SuperDARNdata for different models of the eclipsedionosphere. By invoking differenthypotheses and comparing simulatedresults to SuperDARN measurements wecan study the underlying processesgoverning the ionosphere and improveour model of ionospheric responses to aneclipse.MosesIntroductionPhysics of the IonosphereThe electron density in the ionospherevaries with many factors including altitudeand time of day among others. Theionosphere’s density is very dependent onsunlight. Exclusive of plasma dynamics,the continuity equation for plasmaproduction, q, and loss, is given by theequation: 𝛼𝛽𝑁 2 𝛼𝑞𝑁 𝛽𝑞 0, where 𝛼and 𝛽 are recombination coefficients andN is density1. During an eclipse, q willdecrease dramatically as the solar disk isobscured. The imbalance betweenproduction and loss should result in adecrease in electron density during theeclipse, especially at lower altitudes.At night all layers of the ionosphereexperience a large decrease in electrondensity as shown in the figure below(Figure 1).1
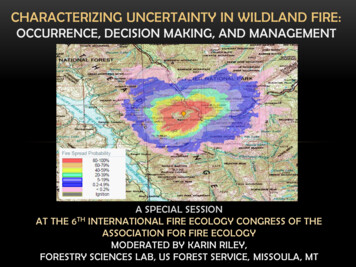
Figure 1. Day vs. Night Electron Density Profiles. During aneclipse, the ionosphere will evolve toward a nighttime densityover a much shorter timescale.The time scale at which the eclipse blocksmost of the sunlight is much shorter thannight and the corona is still visible duringan eclipse. This suggests that theionosphere will not experience the samemagnitude decrease in electron density asat night. However, a decrease in densityin the eclipsed region can be expected.Additionally, since the magnitude of theeclipse varies with location, someinstabilities in the ionosphere could begenerated due to variations in density.Both changes in density and onset ofplasma instabilities associated witheclipses may be detectable by monitoringchanges in radio frequency (RF)propagation by ground-based systems.Radio Wave PropagationRadio waves propagation is governed bythe medium in which the wave is travelingand the frequency of the wave. In theionosphere, the density of the plasmadetermines the frequency threshold forpropagation through the plasma. Thecritical frequency (fp) in MHz and theMosesplasma number density (𝑁) inparticles/cm3 is approximately given by𝑓𝑝 9𝑥103 𝑁. If the frequency of aradio wave is greater than the criticalfrequency, then the wave will propagatethrough the region and escape theionosphere, otherwise it will be refracted.The radio waves that are most impactedby the ionosphere are those in the highfrequency (HF) band, approximately 3MHz - 30 MHz. Additionally, the angle ofincidence of a RF wave on a plasma layeralso determines how a wave is refractedby the layer. Radio waves with a smallerangle of incidence are more likely to bebent back to Earth, when they encountera layer of sufficiently dense plasma.Propagation of radio waves can bemodeled by ray-tracing where the radiowave is treated as a ray propagatingthrough some region. The HF propagationtoolbox (PHaRLAP)2, created by Dr.Manuel Cervera, is a widely usedraytracing tool that models propagationthrough a user-defined model ionosphere.Figure 2, generated with PHaRLAP,illustrates the changes in propagation thata variation in plasma density induces. Thetop panel shows the paths associated with14 MHz signals propagation at differentinitial elevation angles in a nominal midday ionosphere and the bottom plotshows the paths taken by the same raysthrough an ionosphere with a region ofdepleted plasma, or a hole in the plasma.As illustrated in the plots, rays with asufficiently high angle of incidence areslightly refracted, but manage to escapethe ionosphere. In the top plot, rays with asmaller angle of incidence, or lower initialelevation angle, are refracted backtowards Earth. In the bottom plot, thelower initial elevation rays that passthrough the depleted region are bent in2
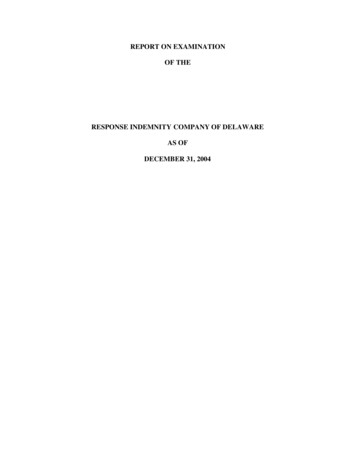
such a way that they travel parallel to theground through the depleted region over agreat distance. In other words, these raysare ducted through the depleted region.The plot of Britain’s Chilton ionosonde’sfoF2 data during the August 1999 eclipse(Figure 3) shows a significant decrease infoF2 at the onset of the eclipse (withtotality at about 1000LT). This decrease isa distinct deviation from the IRI model forthat date.Figure 2. Ray-trace on 14MHz ray through unperturbedionosphere (top) and through perturbed ionosphere with aregion of depleted plasma density (bottom)Thus, PHaRLAP is a useful tool in theprediction and analysis of eclipse-inducedpropagation effects.Radar SystemsRadar is one of the most common methodfor measuring radio wave propagationthrough the ionosphere and extractinginformation on the ionospheric profile fromthese measurements. Ionospheric radarsystems such as ionosondes typicallysend out a RF pulse signal and measurethe time it takes for the signal to return.The distance the pulse traveled is thencalculated from this time and the speed oflight.Historical ObservationsFigure 3. Effect of the August 11, 1999 eclipse on foF23. Thedecrease in the observed foF2 (green) from the IRI model(blue) over a long period coincides with partial obscuration ofthe solar disk.Results from other eclipses haveindicated that there is also a large spatialeffect on the ionosphere extendingoutside the eclipse’s region of totality. Forexample, the Special Sensor UltravioletSpectrographic Imager (SSUSI)instrument observed a depleted airglowregion roughly 1,000 km in diameterduring a solar eclipse over western Africa.A survey of past eclipse observationsshow some inconsistent results. It is likelythat eclipses may be affected by magneticlatitude and other geophysical effects.Since the early-to-mid 1900s, researchershave conducted experiments to observeionospheric phenomena that arise aseffects of an eclipse. These resultsconfirm the expectation that there is asignificant decrease in the ionosphericelectron density due to an eclipse.Moses3
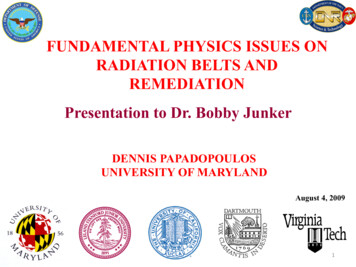
2017 Eclipse Experiment OverviewThe August 21, 2017 total solar eclipsecovered a very long longitudinal path overthe US, unmatched by any eclipse overthe US in the past 60 and in the next 30years. The development of observationalnetworks across the US, such as theContinuously Operating Reference Station(CORS) network, the Super Dual AuroralRadar Network (SuperDARN) and variousamateur radio reporting networks, haveenhanced the potential spatial andtemporal resolution relative to previousstudies.Figure 4. SuperDARN radars' fields of view (magenta andgreen) and Ionospheric sounders' locations (red triangles)relative to the eclipse's path of totality (blue).Our research group established fourtemporary field stations using softwaredefined radios (SDRs) with three stationsalong the path of totality and one stationoutside of totality as illustrated in Figure 4.These stations were vertical incidencesounders. Additionally, our experimentrelied on two SuperDARN radars inOregon and Kansas that had the eclipsepath in their field-of-view as shown inFigure 4.SuperDARN Eclipse ObservationsSuperDARN slant range data gives therange (d) in kilometers (km) that theradar’s signal traveled based on the timeit took for the signal to return to thereceiver ( t) according to the equation𝑑 𝑐/Δ𝑡, where c is the speed of light ina vacuum. The slant range data from theChristmas Valley West (CVW)SuperDARN radar shows a distincteclipse effect illustrated in the Figure 5.Figure 5. SuperDARN Christmas Valley West radar RangeTime-Intensity plot for the eclipse day.Figure 5 shows that as the eclipseprogresses, the radar signals go furtherout before they are reflected back towardsthe radar. Under normal conditions, thisincrease in slant range is often asignature of an upward motion in theionospheric plasma. However, through raytracing we were able to show that this isactually likely due to ducting effects asshown in Figure 6.The focus of the research presented hereis the analysis of the changes in RFpropagation observed by the SuperDARNradar at Christmas Valley, Oregon overthe course of the eclipse.Moses4
Figure 6. Ray-trace of a 10MHz ray through unperturbedionosphere (top) and through eclipsed ionosphere (bottom)Data AnalysisWe developed a PHaRLAP-based 2D raytrace model of SuperDARN so that wecould compare SuperDARN data to theoutput of the ray trace for different modelsof the eclipsed ionosphere. Models of theeclipsed ionosphere were generated byimposing different conditions on the NavelResearch Lab’s (NRL’s) two-dimensional(SAMI2) and three-dimensional (SAMI3)SAMI (Sami is Another Model Ionosphere)models.Figure 7. SuperDARN Christmas Valley West radar measuredrange data (upper) and ray-trace model data (lower).During an internship at NRL, one of ourgroup’s members made improvements tothe previous model, including an improvedeclipse shadow function. As shown inFigure 8 below, simulated SuperDARNdata using this new model agree betterwith measured data than those of the firstSAMI3 model; however, the recovery timepredicted by the model is still a too long.This suggests that some feature of theionospheric response is not accuratelyrepresented.SAMI3 ModelsWe imported the output electron densitiesfrom our NRL collaborators’ first SAMI3model of the eclipsed ionosphere4 into ourSuperDARN simulation algorithm andgenerated the comparison of theSuperDARN measurement and the raytrace simulated data shown in Figure 7.Although the modeled data agrees verywell with the measured data on the onsetphase of the eclipse, model data differsdrastically from measured data during therecovery phase.Figure 8. SuperDARN Christmas Valley West radar measuredrange data (upper) and ray-trace model data generated withnew SAMI3 model (lower).Moses5
There are many parameters that could bemodified in the SAMI3 eclipse model. AsSAMI3 is computationally intensive, itwould be time consuming to run multiplecase studies in order to determine whichcase fits these measured eclipse databest. In order to expedite this selection,we examined the impacts of imposingcertain conditions in the eclipsed 2Dmodel of SAMI (SAMI2) on the ray-trace.SAMI2 Wind StudyOne of SAMI’s input parameters that ismost likely to be set to an inaccurateeclipse value is the neutral wind’s velocity.SAMI takes neutral wind speed anddirection values from NRL’s HorizontalWind Model (HWM), an empirical modelof the upper atmosphere. However, theeclipsed atmosphere’s wind velocityprobably differed from that given by HWMfor a normal day. As winds can have animpact on plasma motion, different valuesof wind speeds and directions in SAMIproduce different ionospheric electrondensity models.MethodologyFor a preliminary study, we ran SAMI2 forfour cases: no wind, default wind valuesfrom HWM, East/West wind values fromHWM with no North/South wind, andNorth/South wind values from HWM withno East/West wind. The ray-trace profilesfrom the default HWM case for controland maximum eclipse conditions areshown in Figure 9.MosesFigure 9. Ray-trace of a 10.5 MHz ray through unperturbedionosphere (top) and through eclipsed ionosphere (bottom)at maximum eclipse.Although ray-trace profile plots are a goodway of comparing the propagation pathsthrough the eclipsed and uneclipsedmodels at a single time, it is difficult tovisualize the behavior of the model andray-paths over time in this representation.In order to do this, we took the rays withthe longest and shortest path lengths andfound the midpoint value of the profile’s𝑙 𝑙path lengths by 𝑙𝑚𝑖𝑑𝑝𝑜𝑖𝑛𝑡 𝑙𝑜𝑛𝑔 2 𝑠ℎ𝑜𝑟𝑡,where llong is the largest path length, lshortis the smallest path length and lmidpoint isthe midpoint value. These midpoint valuesare plotted as circles in Figure 10 bellow,with the minimum and maximum pathlengths indicated by the bars.6
plot does not appear to be significantlydifferent from the “no wind” plot in eitherthe eclipse or control cases. In contrast,the “only north/south wind” plot and the“only east/west wind” plot with the “nowind” plot appear to differ significantly inthe eclipse case and to differ slightly inthe control case. This suggests that theionosphere may be more sensitive toeclipse-induced variations in the northwest wind rather than the east/west wind.Figure 10. Midpoint and bounds of ray-path profile from raytrace through output of SAMI2 model initialized with defaultHWM values.From this, we can see that the pathlengths of the rays generally increasearound the time of the eclipse, but thenquickly return to the path lengths of thecontrol case after the eclipse is over, witha few deviations hours after the eclipse.Preliminary ResultsFigure 11. Plots of midpoint and bounds of ray-path profilefrom ray-trace through output of SAMI2 models initializedwith four different wind models.The bounds and midpoint values of thepath lengths generated by ray-tracesthrough the models generated by each ofthe four cases are shown in the subplotsof Figure 11. The “only east/west wind”MosesConclusion and Future WorkThe study of the ionospheric response tothe 2017 total solar eclipse incorporatesdata from several radio instrumentsincluding SuperDARN and temporaryradio sounder sites. The focus of theresearch presented here is theionospheric response observed by theCVW SuperDARN radar in Oregon. CVWobserved a distinct increase in the rangeof radio signals over the course of theeclipse, peaking around totality.Raytracing models indicate thisphenomena is due to ducting of the radiowaves in the eclipse-induced, plasmadepleted region of the ionosphere.Analysis of the underlying ionosphericphysics consists of comparison ofSuperDARN data with simulatedSuperDARN data, obtained by raytracing.Initial models showed good agreementbetween measured and modeled dataduring the onset phase of the eclipse.However, there is significantdisagreement between simulated andmeasured data during the recoveryphase. One possible reason for thisdiscrepancy could be incorrect values forthe neutral wind’s magnitude and directionduring the eclipse. In order to investigatethe neutral wind’s effects on the eclipsemodel, we implemented several cases inSAMI2 and ray-traced through the output.Preliminary results indicate that the7
North/South wind probably has a largerimpact on the modeled eclipse responsethan does the East/West wind; however,more case studies are necessary toconfirm this result. Future work willinclude further case studies on the impactof the direction of the wind as well as theimpact of changing the magnitude of thewind’s speed.References1.Rishbeth, H.; Garriott, O. K., Introductionto Ionospheric Physics. Academic Press Inc. : NewYork; San Francisco; London, 1969.2.Cervera, M. A.; Harris, T. J. In Modellingthe effects of ionospheric disturbances on quasivertically incident ionograms using 3D magnetoionic raytracing, 2011 XXXth URSI GeneralAssembly and Scientific Symposium, 13-20 Aug.2011; 2011; pp 1-4.3.Afraimovich, E. L.; Kosogorov, E. A.;Lesyuta, O. S., Effects of the August 11, 1999 totalsolar eclipse as deduced from total electroncontent measurements at the GPS network.Journal of Atmospheric and Solar-TerrestrialPhysics 2002, 64 (18), 1933-1941.4.Huba, J. D.; Drob, D., SAMI3 prediction ofthe impact of the 21 August 2017 total solareclipse on the ionosphere/plasmasphere system.Geophysical Research Letters 2017, 44 (12), 59285935.The ray tracing results presented in this paperwere obtained using the HF propagationtoolbox, PHaRLAP, created by Dr. ManuelCervera, Defence Science and TechnologyOrganisation, Australia(manuel.cervera@dsto.defenc e.gov.au). Thistoolbox is available by request from its author.Moses8
effects of an eclipse. These results confirm the expectation that there is a significant decrease in the ionospheric electron density due to an eclipse. The plot of Britain's Chilton ionosonde's foF2 data during the August 1999 eclipse (Figure 3) shows a significant decrease in foF2 at the onset of the eclipse (with totality at about 1000LT).