Transcription
LEARNING FROMTHE LESSONSOF TIMEINVESTMENT PRODUCTS: NOT FDIC INSURED NO BANK GUARANTEE MAY LOSE VALUE
THE ISSUES THATWORRY INVESTORSTODAY AREN’T NEWStaying focused despite the day-to-day distractions of the marketis never easy, especially during periods of economic uncertainty.However, investors who seek the guidance of a trusted FinancialProfessional and remain committed to their investment plans,even when it’s tempting to head to the sidelines, are betterpositioned to realize their short- and long-term goals.A few “history lessons” to considerFor every bear, there’s a bull and for every bull, there’s a bearThe chart below shows how dramatically the stock market (as represented by the S&P 500) bounced backfrom its lowest point during four bear markets over the last few decades. Of course, investors during theseperiods couldn’t possibly have known their investment would grow so dramatically but they could haveremained fully invested, confident in the knowledge that markets recover over time.Cumulative total returns of the S&P 5001 (%)Peak to trough (market high to market low)5001973–1974 Bear market1-year after end1987 Bear market5-years after end2000–2002 Bear market10-years after end2007–2009 Bear market456.10400300267.23200205.841000-100125.99 74.66-48.2023.33-33.51122.0924.40-49.15105.12 120.8270.58N/A-54.89Source: Standard & Poor’s, a division of the McGraw-Hill Companies, Inc., GPW (Legg Mason internal system) and Morningstar Direct.Past performance is no guarantee of future results.This chart is for illustrative purposes only and is not indicative of performance of any specific investment. All investments involve risks, including loss of principal. Please note that an investor cannot investdirectly in an index. Unmanaged index returns do not reflect any fees, expenses or sales charges. This chart illustrates the historical performance of the Standard & Poor’s 500 Index (S&P 500) before andafter the bear market bottoms of October 3, 1974, December 4, 1987, October 9, 2002 and March 9, 2009. Cumulative total returns include reinvestment of dividends and capital gains. The S&P 500 Indexis an unmanaged index of 500 stocks that is generally a representation of the performance of larger companies in the U.S.
Don’t let emotions drive your decisionsEmotions can lead to irrational decision making and impulsivedecisions that compromise the realization of stated goals.Before you react impulsively, make a list of your concerns,revisit your goals and review your strategy. If your goalsand/or priorities have changed, or if you believe your strategyis no longer appropriate given the economic environment,contact your Financial Professional. When there is fear anduncertainty in the air, when there is scary news that makesyou question what you should do, that’s when it’s mostimportant to talk to your Financial Professional. He or shecan provide the perspective you need to understand thesituation at hand and how it relates to your individualgoals and strategy.Be diversified2Despite the best efforts of investment professionals, it’svirtually impossible to guess in advance which asset classwill have the best return in any given year. Spreadingyour investment dollars between different asset classesis an important tool to manage investment risk, especiallyduring periods of market volatility.Understand your tolerance for riskRisk is part of investing. You can limit it, you can defendagainst it, but you can’t eliminate it. The important thingis to have a well-informed understanding of how much riskyou can tolerate by working closely with your FinancialProfessional. By having a well-informed understandingof your tolerance for risk, your Financial Professionalcan construct a long-term investment strategy suitedto your needs.Work closely with a trusted Financial ProfessionalA trusted Financial Professional works with you to identifyyour goals, needs and aspirations to align your short- andlong-term goals with your own risk tolerance. A FinancialProfessional also offers much-needed perspective by helpingto identify the consequences of impulsive and irrationaldecisions. Most importantly, your Financial Professional,backed by the resources of his/her own firm, helpsyou achieve your goals by providing valuable insightand guidance on economic issues, the markets, specificinvestments and strategies.Stay investedInvestors who stay the course have historically beenrewarded for their patience. When you look at marketperformance over decades rather than just a year or two,you find that while it may contract, it also expands — withthe gains often concentrated in a handful of trading days.Market returns (%)S&P 500 Index from January 2, 1997–December 30, 20163Price-only performance5.88Fully invested2.15Missed the top 10 daysMissed the top 20 days-0.31Missed the top 30 days-2.43-4.38Missed the top 40 daysMissed the top 50 daysMissed the top 100 days23-6.16-13.33Diversification does not assure a profit or protection against market loss.Source: Morningstar Direct.All investments involve risks, including loss of principal. The chart provided is for illustrative purposes only and represents an unmanaged index in which investors cannot directly invest.Past performance is no guarantee of future results.
Brandywine GlobalClarion PartnersClearBridge InvestmentsEnTrustPermalMartin CurrieQS InvestorsLegg Mason is a leading global investment company committed to helping clients reachtheir financial goals through long-term, actively managed investment strategies. A broad mix of equities,fixed-income, alternativesand cash strategiesinvested worldwideRARE Infrastructure A diverse family ofspecialized investmentmanagers, each withits own independentapproach to researchand analysis Over a century ofexperience in identifyingopportunities anddelivering astuteinvestment solutionsto clientsRoyce & AssociatesWestern Assetleggmason.com1-800-822-5544Any information, statement or opinion set forth herein is general in nature, is not directed to or based on the financial situation or needs of anyparticular investor, and does not constitute, and should not be construed as, investment advice, forecast of future events, a guarantee of futureresults, or a recommendation with respect to any particular security or investment strategy or type of retirement account. Investors seeking financialadvice regarding the appropriateness of investing in any securities or investment strategies should consult their financial professional.Legg Mason, Inc., its affiliates and its employees are not in the business of providing tax or legal advice to taxpayers. These materials andany tax-related statements are not intended or written to be used, and cannot be used or relied upon, by any such taxpayer for the purposeof avoiding tax penalties or complying with any applicable tax laws or regulations. Tax-related statements, if any, may have been writtenin connection with the “promotion or marketing” of the transactions(s) or matter(s) addressed by these materials, to the extent allowed byapplicable law. Any such taxpayer should seek advice based on the taxpayer’s particular circumstances from an independent tax advisor. 2017 Legg Mason Investor Services, LLC. Member FINRA, SIPC. Legg Mason Investor Services, LLC and all entities mentioned above aresubsidiaries of Legg Mason, Inc. 685458 TAPX011501 3/17
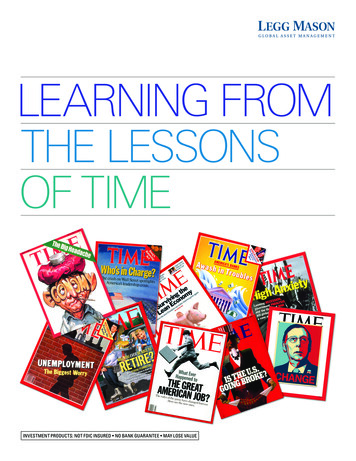
THE DATESMAY CHANGE,BUT THEHEADLINESSTAY THESAMEIt’s human nature to be concerned about thefuture, and doom-and-gloom headlines commandattention in both good and bad times. Yet a lookback at history shows that neither bull or bearmarkets last forever — and that short-termworries may not be a good indicator to wherethe market is going.What matters is keeping a clear head — and recognizingthat markets will go both up and down, and at times mayeven move in opposite directions. When in doubt, talk toyour Financial Professional. Revisiting your long-term goalsand the logic behind your investment decisions can providemuch-needed perspective and help avoid impulsive movesthat may work against you in the future.Source: FactSet and Morningstar Direct.Past performance is no guarantee of future results. This chart is for illustrative purposesonly and is not indicative of performance of any specific investment. An investor cannot investdirectly in an index. Unmanaged index returns do not reflect any fees, expenses or sales charges.The Dow Jones Industrial Average (DJIA) is a widely followed measurement of the stock market.The average is comprised of 30 stocks that represent leading companies in major industries.These stocks, widely held by both individual and institutional investors, are considered to be allblue-chip companies.Time magazine and Time Inc. are not affiliated with, and do not endorse products or services of,Legg Mason, Inc.The magazine covers in this brochure are all from Time Magazine. Date of Issue and PublicationYear are listed under each cover. 2017 Time Inc., used under license.4“Unemployment On the Rise,” by James Kelly, Time, February 8, 1982.5“Banking Takes A Beating,” by William Blaylock, Adam Zagorin, Stephen Koepp,Time, December 3, 1984.6“Who’s in Charge?,” Time cover image, November 9, 1987.7“All Shook Up,” by John Greenwald, Time, October 15, 1990.8”Jobs in the Age of Insecurity,” by George J. Church, Time, November 22, 1993.9“Everyone, Back in the Labor Pool,” by Daniel Kadlec, Time, July 29, 2002.10“The New President’s Economy Problem,” by Justin Fox, Time, May 26, 2008.11“It’s Only Going to Get Worse in Washington,” by Michael Scherer; Alex Altman,Time, October 14, 2013.12“Make America Solvent Again,” by James Grant, Time, April, 25, 2016.Feb. 23, 1976JAN1976Sep. 30, 1977JAN1977JAN1978Oct. 22, 1979JAN1979Feb. 8, 1982JAN1980JAN1981Dec. 3, 1984JAN1982Nov. 2, 1987Nov. 10, 1986JAN1983JAN1984JAN1985Oct. 15, 1990Nov. 9, 1987JAN1986JAN1987JAN1988JAN1989Sep. 28, 1992JAN1990JAN1991Nov. 22, 1993JAN1992Mar. 20, 1995JAN1993JAN1994Sep. 14, 1998JAN1995Mar. 26, 2001JAN1996JAN1997Feb. 4, 2002JAN1998Jul. 29, 2002JAN1999JAN2000May 26, 2008JAN2001JAN2002Oct. 13, 2008JAN2003Nov. 9, 2009JAN2004JAN2005Aug. 15, 2011Mar. 29, 2010JAN2006JAN2007JAN2008Nov. 19, 2012JAN2009JAN2010Oct. 14, 2013JAN2011Nov. 17, 2014JAN2012JAN2013Feb. 2, 2015JAN2014JAN2015Apr. 25, 2016JAN2016DEC2016APRIL 25, 201630,000You owe42,998.12 That’s what every American man,woman and child would need to payto erase the 13.9 trillion U.S. debt25,000Make America Solvent AgainBy James Granttime.com“But Americans have a newmenu of economic woes —among them a real estatecrash, a credit crisis, a brokenhealth-care system andnagging job insecurity.”1020,00015,00010,000“Bankers now facetheir most strenuoussurvival test since theGreat Depression.”5“It is doubly trouble-somethat the ranks of thejobless are growing at atime when many of thecushions softening thepain of unemploymenthave been deflated.”4“All sorts of peoplewho never thoughtthey would be on thejobless lines . arelooking for jobs andnot finding them.”8“Banks and insurancefirms are totteringbeneath huge portfoliosof bad real estatemortgages.”7“The crash on WallStreet spotlightsAmerica’sLeadership Crisis.”6“Americans are moreworried about theirfinancial future than atany other time sincethe turbulent 70s.”9Iraq invades Kuwait5,000Exxon Valdezoil disasterPresident Reagan shotIran hostage crisisLTCM collapse;Russian debtdefaultAsian currencycrisis emerges0JAN1976“We owe more than we caneasily repay. We spend toomuch and borrow too much.”12“The nation has beencarved up into echochambers; increasingly,we hear only the soundof our own passionsand fears 95JAN1996JAN1997JAN1998JAN1999Techbubble burstsJAN2000JAN2001Housing/Creditmarket turmoil9/11 downS&P downgradesU.S. 016DEC2016
investment solutions to clients. APRIL 25, 2016 . to erase the 13.9 trillion U.S. debt U.S. debt U.S. debt Make America Solvent Again By James Grant You owe JAN 2012 JAN 2011 JAN 2010 JAN 2009 JAN 2008 JAN 2007 . 10 "The New President's Economy Problem," by Justin Fox, Time, May 26, 2008. 11 "It's Only Going to Get Worse in .


