Transcription
GRADUATION SURVEY 2018Each year the UMKC Office of Institutional Research conducts a survey of seniors preparing tograduate. Results of this survey provide valuable insights into the effectiveness of UMKC’scurricular and co-curricular programs and support effective institutional decision-making.University of Missouri – Kansas CityMAY 2019
TABLE OF CONTENTSINTRODUCTIONSUMMARY OF FINDINGSGENERAL EDUCATION ASSESSMENTHIGH IMPACT EXPERIENCESSTUDENT SATISFACTION AT UMKCPOST-GRADUATION DESTINATIONCONCLUSIONSAPPENDIX A: TABLES234678910Table 1: Student Characteristics11Table 2: Goals for College Experience12Table 3: High Impact Experiences13Table 4: Internship/Practicum Experience Detail14Table 5: Evaluation of UMKC15Table 6: Satisfaction with UMKC Services and Programs16Table 7: Destination for Undergraduate Degree Recipients at Six Months Out18APPENDIX B: GRADUATION SURVEY AY 2018191Graduation Survey Summary Report 2018
INTRODUCTIONEach year the University of Missouri – Kansas City conducts a survey of graduating seniorstudents regarding their experiences at the university. The results of this survey providevaluable insights into the effectiveness of UMKC’s curricular and co-curricular programs andassist the university in preparing to meet the needs of future students.MethodologyStudents applying to graduate in Fall 2017 or Spring 2018 received an electronic survey and ahold on transcript requests and diploma distribution, pending completion of the survey. Of the1,542 baccalaureate graduates surveyed in Fall 2017 and Spring 2018, 1,359 completed theGraduation Survey for a response rate of 88.1%. See Table 1 in Appendix A for respondentcharacteristics. Refer to Appendix B for the survey items.FindingsA summary of the survey findings are detailed in the following sections. Tables outlining theresults of the Graduation Survey are located in Appendix A.The Graduation Survey 2018 Report may also be referenced at:http://data.umkc.edu/reports/Comments or questions regarding this report should be directed to:Amy PrettejohnOffice of Institutional Researchprettejohna@umkc.eduNote: Survey collection method and questionnaire items were updated for Fall 2017. Due to this change, and lack ofconsistent data collection across the entire academic year, Summer 2017 has been excluded from the analysis (withthe exception of the post-graduation destination analysis).2Graduation Survey Summary Report 2018
SUMMARY OF FINDINGSGeneral Education Assessment Roughly 90% agreed that UMKC had helped them improve their critical thinking skills,expand their understanding of different people and ideas, improve their writtencommunication skills, and increase their overall ability to make cross-curricularconnections.High Impact Educational Experiences A majority (approximately 91%) of students who engaged in volunteering,internship/practicum, and/or a job related to their degree agreed that theseexperiences enriched their undergraduate experience.Overall Experience at UMKC 75% of respondents rated their overall experience at UMKC as either good or excellentand approximately 80% would recommend UMKC to friends or family.Approximately half of the respondents indicated UMKC was not their first choice whenthey decided to attend college; however, 77% noted they would choose UMKC again.Satisfaction with UMKC Services and Programs Academic related services: Most respondents indicated they were satisfied with theavailability of faculty, the admissions process, and the content of courses.Approximately 34% of students were dissatisfied with the availability of courses, 28%were dissatisfied with career preparation, and about 24% were dissatisfied withacademic advising services.Non-academic related services: A strong majority (80% or higher) indicated that theywere satisfied with the Miller Nichols library, the Bookstore, availability of computerservices, personal safety on campus, Swinney Recreation Center, Career Services, theregistration process, and athletic facilities. Conversely, approximately one-quarterreported dissatisfaction with the financial aid and cashier’s office, and about 40%indicated dissatisfaction with parking services. Between 30-40% of students reported noexperience with Swinney Recreation Center, Career Services & Roo Career Network, andAthletic Facilities.Post-Baccalaureate Destination A majority (85%) of baccalaureate awardees had successful outcomes reported sixmonths post-graduation. Through an enhanced process of data collection, the percentof known outcomes for graduates increased (to 94%).3Graduation Survey Summary Report 2018
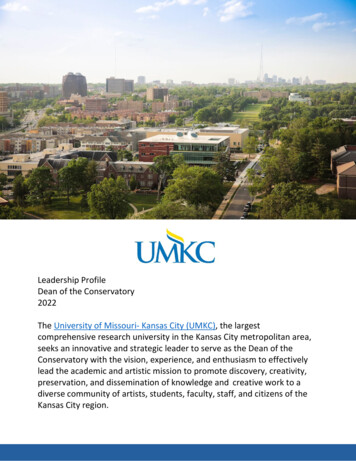
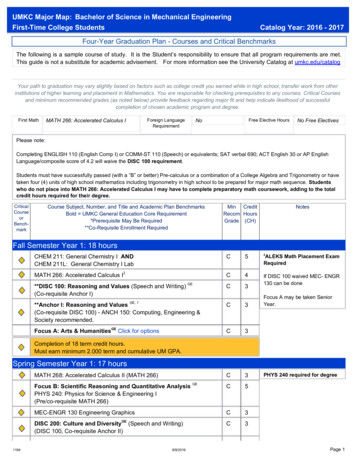
GENERAL EDUCATION ASSESSMENTIn an effort to provide evidence of student growth on university-wide learning objectives,students were asked to indicate how much they agreed that the university had helped themaccomplish a variety of ‘typical’ goals students have for their college experience. Overall,respondents believed their experiences at UMKC facilitated development in several domains asevidenced in Table 2 (see Appendix A).As indicated in Figure 1, most students agreed that to some degree attending college at UMKChelped them in achieving several goals, the most frequently endorsed being: improved criticalthinking (92%), expanded appreciation of different people and ideas (91%), improved oralcommunication (90%), and increased ability to make cross-curricular connections (89%).FIGURE 1: GOALS FOR COLLEGE EXPERIENCESDisagreeAgreeCRITICAL THINKING8.3%91.7%DIFFERENT PEOPLE & IDEAS9.1%90.9%ORAL COMMUNICATION10.0%90.0%CROSS-CURRICULAR CONNECTIONS10.7%89.3%WRITTEN COMMUNICATION10.8%89.2%CONTRIBUTE TO COMMUNITY13.5%86.5%ARTS & HUMANITIES14.1%85.9%TECHNOLOGY USE14.3%85.7%ETHICAL DECISIONS14.9%85.1%CLARIFY VALUES & GOALS16.3%83.7%MATHEMATICAL/SCIENTIFIC e: “Disagree” Total of strongly, moderately, and slightly disagree. “Agree” Total of strongly, moderately, and slightlyagree.4Graduation Survey Summary Report 2018
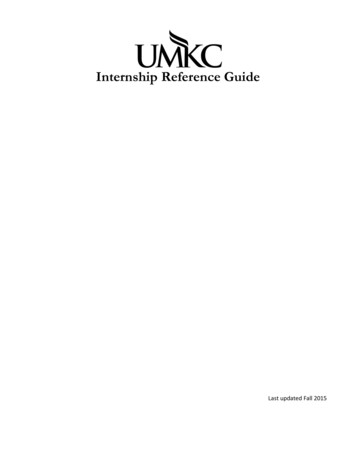
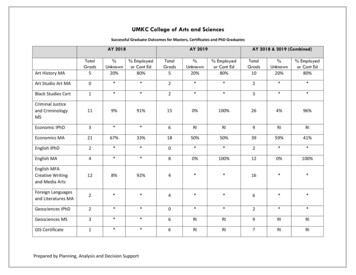
In addition to rating these general education factors, students were asked to identify the areain which they had the greatest development (Figure 2). Similar to the goals for collegeexperience, respondents indicated increased critical thinking ability and expanded appreciationof different people/ideas as their primary growth areas.FIGURE 2: PRIMARY GROWTH AREASCRITICAL THINKING214DIFFERENT PEOPLE & IDEAS190MATHEMATICAL/SCIENTIFIC METHODS171WRITTEN COMMUNICATION167ORAL COMMUNICATION132ARTS & HUMANITIES124CLARIFY VALUES & GOALS101CONTRIBUTE TO COMMUNITY88CROSS-CURRICULAR CONNECTIONS69TECHNOLOGY USE63ETHICAL DECISIONS40050100150200# Students Selecting Primary Goal5Graduation Survey Summary Report 2018
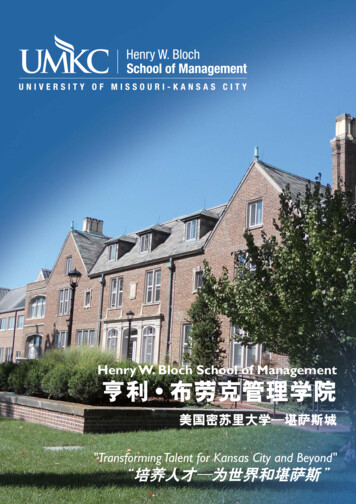
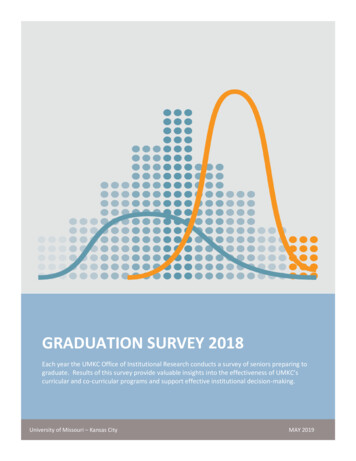
HIGH IMPACT EXPERIENCESThe Graduation Survey measured several experiences connected to educational enrichment.Table 3 (see Appendix A) details responses regarding these high impact practices. Participationrates in activities varied from a low of 15% for study abroad to 56% for participating incommunity volunteering. Approximately 45% of the students reported participation in a jobrelated to degree (45.2%), undergraduate research (44.9%), or internship/practicum (44%).Students also rated their experiences in these high impact practices, when relevant. As shownin Table 3, students rated their experiences with volunteering, work related to their degree, andinternship/practicum particularly high.Figure 3 presents data on student participation in high impact practices (HIPs) and theirassessment of the HIP as an enhancement to their college experience.FIGURE 3: HIGH IMPACT EXPERIENCES - PARTICIPATION AND ASSESSMENT100.0%80.0%60.0%40.0%20.0%0.0%% Participating% Agreeing HIP Enhanced College ExperienceBeginning in Fall 2017, respondents were asked to reflect on their internship/practicumexperiences during their tenure at UMKC. Table 4 (see Appendix A) details these data includingpay status, term of experience, time commitment per week, and the types of tasks undertakenfor those participating (N 598). Just under half (43%) participated in paid internships and morethan two-thirds worked 15 hours per week. On average, the largest percent of their time wasspent on communication tasks (30%) and almost all interns gained this experience (96%). Onequarter of their time was focused on analytical/problem solving tasks, and less than 10% onnon-essential tasks (e.g., running errands).6Graduation Survey Summary Report 2018
STUDENT SATISFACTION AT UMKCSeveral indicators of general satisfaction are included in the Graduation Survey. Table 5 (seeAppendix A) contains the complete results. Figure 4 highlights overall satisfaction items focusedon retrospective reflection – selecting UMKC, recommending UMKC, and selecting the samedegree program.FIGURE 4: GENERAL LD RECOMMEND UMKC TOOTHERSWOULD SELECT UMKC AGAINWOULD SELECT DEGREEPROGRAM AGAINStudents in these programs were not only likely to recommend UMKC to others, but also wouldattend UMKC and enroll in their respective degree program. Additionally, 75% rated the overallexperience at UMKC as “good” or “excellent.” Over three-fourths (82.2%) agreed that UMKCwas “student-centered” and 90% felt UMKC provided a welcoming environment.In addition to general satisfaction, students were asked to assess their satisfaction with specificservices and programs provided university-wide. Table 6 (see Appendix A) presents thecomplete results for satisfaction with university-wide services and programs. In general,average satisfaction with academic-related services was between slightly satisfied andmoderately satisfied (between 4.0 and 5.0 on a 6-point scale). The highest satisfaction wasexpressed for the availability of faculty outside of class (4.75) and the admissions process(4.71). Satisfaction for non-academic related services also averaged between slightly andmoderately satisfied, with the highest average rating for the Miller Nichols library (5.13) andthe availability of computer services (4.82). Satisfaction with parking services (2.80) was lower,on average.7Graduation Survey Summary Report 2018
POST-GRADUATION DESTINATIONAn important goal of the Graduation Survey is to understand the post-graduation plans of ourstudents. Table 7 (Appendix A) includes follow-up data on post-baccalaureate destinationoutcomes six months after graduation. In an effort to standardize these data and allow forbenchmarking to national norms, destination information is provided in a formatcomplementary to the National Association of Colleges and Employers (NACE) First-DestinationSurvey. This format includes reporting on individual destination categories such as employmentand continued education, but also provides a ‘Career Outcomes Rate’ combining employment,acceptance/enrollment in a program of continued education, military service, and voluntaryservice.Methodology Students were asked to identify their post-baccalaureate plans at the time of thesurvey. In addition, a number of other techniques were utilized to collect data on studentdestination at six months after graduation. Destination research approaches included LinkedInsearches, referencing alumni and departmental employment data, and matching to NationalStudent Clearinghouse for continued education enrollment. These data sources were crossreferenced to provide a graduation outcomes database for the undergraduate degree awardeesin AY 2018, including graduates from the Summer 2017, Fall 2017, and Spring 2018 terms.Findings Of the 1,717 undergraduates awarded a baccalaureate degree in Academic Year 2018,UMKC obtained destination information for over 90% of these graduates. The Career OutcomesRate for AY 2018, was 85.4%. Over 60% of those with a known post-baccalaureate outcomewere employed within six months, and approximately 20% continued their postsecondaryeducation. Of those reporting employment and providing a salary figure, the median and meansalary values were 45,000 and 47,035, respectively.8Graduation Survey Summary Report 2018
CONCLUSIONSThe Graduation Survey serves as an opportunity for graduating seniors to express thoughts andopinions regarding their educational experience at UMKC. Furthermore, the survey gaugesstudent satisfaction with the University as a whole, in addition to specific programs and servicesprovided on campus. Taken together, this information can be used to inform policy decisionsmeant to enhance student success on campus.General Education A majority of seniors recognized improvements in their critical thinkingskills, understanding of different people and ideas, and their written communication skills, andan increase in their overall ability to make cross-curricular connections. Similar to last year’sGraduation Survey, the least endorsed areas were improvement in ability to usemathematical/scientific methods and clarification of values and goals. The university shouldcontinue to monitor these areas of general education to ensure all graduates develop in thesetargeted outcomes.High Impact Experiences Students noted several experiences as having a positive impact ontheir learning at UMKC, the top three being participating in an internship/practicum, holding ajob related to degree program, and volunteering. Living in a residence hall and study abroadwere rated the lowest of all provided experiences, with a negative response fromapproximately one-third of participants. This finding was also observed in previous GraduationSurvey findings. It may be beneficial to investigate the qualitative experiences of studentstaking part in residence hall life and study abroad activities and enhance these for futurestudents.Overall Satisfaction Approximately 75% of respondents rated their overall experience at UMKCas either good or excellent. Additionally over three-fourths indicated that, if given the chance,they would choose UMKC again. Both of these findings are relatively consistent with responsesfrom previous administrations of the Graduation Survey. In terms of satisfaction with UMKCservices and programs, the highest areas of satisfaction were observed in the availability offaculty outside of class, the admissions process, and the Miller Nichols library. Parking services,a non-academic service, remained the area of greatest student dissatisfaction across time.Destination A majority (85%) of baccalaureate awardees had successful outcomes reported sixmonths post-graduation. Through an enhanced process of data collection, the percent ofknown outcomes for graduates increased (to 94%). These findings are positive and align withreported NACE outcomes rates for baccalaureate awardees across the U.S. It is essential tocommunicate these findings on campus and utilize UMKC’s successful outcomes rate topromote programs and support recruitment and retention of students.9Graduation Survey Summary Report 2018
APPENDIX AGraduation Survey: Tables10Graduation Survey Summary Report 2018
Table 1Student Characteristics (N 1,359)N%80155858.9%41.1%Race/EthnicityAmerican Indian/Alaska NativeAsianBlack/African AmericanHispanicNonresident InternationalTwo or more Race/EthnicityWhiteNot .9%60.6%3.8%School (Respondents may be represented in more than one school.)Bloch School of ManagementCollege of Arts & SciencesConservatory of Music & DanceSchool of Biological SciencesSchool of Computing & EngineeringSchool of DentistrySchool of EducationSchool of Nursing and Health 2.1%2.1%15.7%SexFemaleMale11Graduation Survey Summary Report 2018
Table 2Goals for College Experience (General Education Assessment) (N onglyAgree6Broadened my knowledge of arts and humanities14.1%29.8%33.4%22.7%Improved my ability to communicate orally10.0%23.1%35.0%31.9%Improved my ability to communicate in writing10.8%22.4%33.9%32.9%Improved my ability to make ethical 1%27.9%25.2%26.8%My experience at UMKC Expanded my understanding of people andideas that are different from meAssisted me in clarifying the values and goals ofmy lifeImproved my critical thinking abilityImproved my ability to use technology in order toobtain information and solve problemsIncreased my ability to see how ideas fromdifferent areas study are related to one anotherEnhanced my desire to contribute to the local andglobal communityImproved my ability to use mathematical andscientific 1.19)4.69(1.30)4.43(1.38)Note: “Disagree” Total of strongly, moderately, and slightly disagree as one item. Data were originally collected on a 6-point scale from “strongly disagree”to “strongly agree”. Mean and standard deviation (SD) are representative of original data on 6-point scale.12Graduation Survey Summary Report 2018
Table 3High Impact ExperiencesExperiences that enhanced my time atUMKC Agree6N/AUndergraduate research135955.1%15.3%27.2%25.9%31.6%Study abroad135984.6%31.6%16.7%7.7%44.0%Service ving in a residence hall135967.8%28.1%21.5%24.5%25.9%Job related to degree135954.8%8.8%19.9%25.4%45.9%Student e: “Disagree” Total of strongly, moderately, and slightly disagree as one item. Data were originally collected on a 6-point scale from “strongly disagree”to “strongly agree”. Percent indicating disagree/agree is based upon those providing rating data, excluding N/A responses. Mean and standard deviation (SD)are representative of original data on 6-point scale.*Responses restricted to students in the School of Education.13Graduation Survey Summary Report 2018
Table 4Internship/Practicum Experience Detail (N 598)Paid internship/practicumYesNoTerm of participation (most recent)FallSpringSummerNumber of hours per weekLess than 5 hours5-10 hours11-15 hours16-20 hours21-30 hours31 or more hoursParticipated in following activities during experienceAdministrative/clericalCommunications (verbal, written)Organizing (schedules, tasks, etc.)Analytical/problem solving (critical thinking, research)Project management (overseeing part/all of project)Non-essential functions (running errands, etc.)Average percent of time spent in task during anizingAnalytical/problem solvingProject managementNon-essential 348852843633370.9%95.8%81.6%88.3%72.9%55.7%AVG %13.0%30.4%12.5%23.1%13.5%7.5%14Graduation Survey Summary Report 2018
Table 5Evaluation of UMKC (N 1,359)UMKC was first choice to attendYesNoWould choose to select same degree program againYesNoWould choose to attend UMKC againYesNoWould recommend UMKC to friends and familyYesNoEvaluation of overall experience at UMKCExcellentGoodFairPoorUMKC provided a welcoming environmentStrongly DisagreeModerately DisagreeSlightly DisagreeSlightly AgreeModerately AgreeStrongly AgreeMean (SD)UMKC is student-centeredStrongly DisagreeModerately DisagreeSlightly DisagreeSlightly AgreeModerately AgreeStrongly AgreeMean .8%3733703444434322.7%2.4%5.2%25.3%32.6%31.8%4.78 .52 (1.31)15Graduation Survey Summary Report 2018
Table 6Satisfaction with UMKC Services and Programs (N 1,359)DisagreeAcademic-Related ServicesDuring my time at UMKC, I was satisfied with The admissions process2.0%13.3%24.2%30.0%32.5%Availability of faculty outside of class5.7%11.4%22.2%37.5%28.9%The quality of instruction0.9%14.8%21.8%36.9%26.6%The content of courses1.0%16.1%24.1%35.8%24.0%The variety of courses2.0%20.2%25.3%31.5%23.0%Career preparation16.5%28.0%25.1%28.1%18.8%Academic advising services1.8%24.1%19.5%24.9%31.5%Availability of courses when you wantto take (1.57)3.97(1.51)Note: “Disagree” Total of strongly, moderately, and slightly disagree as one item. Data were originally collected on a 6-point scale from “strongly disagree”to “strongly agree”. Percent indicating disagree/agree is based upon those providing rating data, excluding N/A responses. Mean and standard deviation (SD)are representative of original data on 6-point scale.16Graduation Survey Summary Report 2018
Table 6 (continued)Satisfaction with UMKC Services and Programs (N 1,359)DisagreeNon-Academic Related ServicesDuring my time at UMKC, I was satisfied with The registration process2.2%16.4%27.8%31.4%24.4%Miller Nichols Library8.2%6.2%15.0%33.3%45.5%The Bookstore5.9%16.1%26.2%31.9%25.8%Availability of computer services10.4%11.3%22.3%31.4%35.0%Personal safety on campus8.3%15.0%18.2%32.1%34.7%Cashier’s Office6.4%25.8%28.3%25.6%20.3%Financial Aid Office13.3%27.2%26.9%24.2%21.7%Swinney Recreation Center30.5%13.8%23.1%31.0%32.1%Career Services & Roo Career Network30.2%19.2%29.4%28.2%23.2%Athletic facilities40.7%18.9%26.9%28.5%25.7%Parking ote: “Disagree” Total of strongly, moderately, and slightly disagree as one item. Data were originally collected on a 6-point scale from “strongly disagree” to“strongly agree”. Percent indicating disagree/agree is based upon those providing rating data, excluding N/A responses. Mean and standard deviation (SD) arerepresentative of original data on 6-point scale.17Graduation Survey Summary Report 2018
Table 7Destination for Undergraduate Degree Recipients at Six Months OutAcademic Year 2018 (SU17, FS17, SP18 Baccalaureate Awardees)CAREER OUTCOMES RATE (employed, service, military, & furthering education)Total Undergraduate Degree RecipientsKnowledge Rate (at 6 months out)Total Undergraduate Degree Recipients with Known DestinationPercent Employed Overall Percent Employed Full-time Percent Employed Part-timePercent ServicePercent MilitaryPercent Furthering EducationPercent Seeking EmploymentPercent Seeking Furthered EducationNot Seeking/Not EngagedMean Starting Salary (full-time)Median Starting Salary (full-time)85.4%1,71793.8%1,61163.6%59.0%4.6% 1% 1%20.8%8.4%4.7%1.6% 47,035 45,00018Graduation Survey Summary Report 2018
APPENDIX BGraduation Survey Items: Fall 2017, Spring 201819Graduation Survey Summary Report 2018
UMKC Graduation Survey 2017-18First Administered Fall 2017We would like to hear about your experiences at UMKC. Please take a few minutes to complete thissurvey as fully and honestly as possible. All responses will be kept strictly confidential and reported asgroup data only. Thank you for your help.Items with (*) indicate required response.Items with ( ) indicate required response subset and feeder item noted.*1. Was UMKC your first choice when you decided to attend college?YesNo*2. Below are several goals that "typical" students have for their college experiences. Please indicate howmuch you agree that your experiences at UMKC helped you to accomplish these goals.1 Strongly Disagree2 Moderately Disagree3 Slightly Disagree4 Slightly Agree5 Moderately Agree6 Strongly Agree"My experiences at UMKC."Broadened my knowledge of arts and humanitiesImproved my ability to communicate orallyImproved my ability to communicate in writingImproved my ability to make ethical decisionsExpanded my understanding of people and ideas that are different from meAssisted me in clarifying the values and goals of my lifeImproved my critical thinking abilityImproved my ability to use technology in order to obtain information and solve problemsIncreased my ability to see how ideas from different areas of study are related to one anotherEnhanced my desire to contribute to the local and global communityImproved my ability to use mathematical and scientific methods*3. In which of these areas do you think you have developed the most during your time at UMKC? (Dropdown item—select one)Broadened my knowledge of arts and humanitiesImproved my ability to communicate orallyImproved my ability to communicate in writingImproved my ability to make ethical decisionsExpanded my understanding of people and ideas that are different from meAssisted me in clarifying the values and goals of my lifeImproved my critical thinking abilityImproved my ability to use technology in order to obtain information and solve problemsIncreased my ability to see how ideas from different areas of study are related to one anotherEnhanced my desire to contribute to the local and global communityImproved my ability to use mathematical and scientific methods20Graduation Survey Summary Report 2018
*4. Below are several learning opportunities students may have during their college experiences. Pleaseindicate how much you agree that these experiences at UMKC enhanced your college experience. Foractivities in which you did not participate, selected "N/A."1 Strongly Disagree2 Moderately Disagree3 Slightly Disagree4 Slightly Agree5 Moderately Agree6 Strongly Agree0 N/Aa. Participating in undergraduate researchb. Participating in study abroadc. Participating in service learning associated with a classd. Participating in an internship/practicum – receive items 4d cont., if selectede. Participating in community volunteering on my own or with a student organization – receiveitems 4e cont., if selectedf. Completing student teaching requirement for degreeg. Living in a residence hallh. Working part-time in a professional position related to my degree 4d cont. Please provide the following information about your internship/practicum:(if 4d rated 1-6 – all items in subset required)Company or Organization:Company or Organization Location:Was this a paid internship/practicum?YesNoWhen did you participate in your most recent internship/practicum experience?Term & Year – Fall, Spring, Summer with corresponding pull-down menuwith year options next to each term – at least one term selectedWhat was the time commitment for this internship/practicum?Hours – pull-down menu with hours – Less than 5, 5-10, 11-15, 16-20, 21-30, 31-40, etc.Unit – pull-down menu with ‘week’, ‘month’, ‘semester’, etc.Estimate the percentage of time spent on each of the following activities during your most recentinternship/practicum experience (must add to 100%):% Administrative/clerical (e.g. filing, copying, etc.):% Communications (verbal/written communication with customers, patients, staffmembers, etc.):% Organizing (schedules, tasks, meetings, etc.):% Analytical/problem solving (critical thinking, research design, diagnosing, etc.):% Project management (overseeing all/part of a project from start to finish):% Non-essential functions (e.g. running errands, etc.): 4e cont. Please provide the following information about your community volunteering experience:(if 4e rated 1-6 – all items in subset required)Organization:Organization Location:What was the time commitment for this community volunteering experience?Hours – pull-down menu with hours – Less than 5, 5-10, 11-15, 16-20, 21-30, 31-40, etc.21Graduation Survey Summary Report 2018
Unit – pull-down menu with ‘week’, ‘month’, ‘semester’, etc.Briefly describe your role at the organization and your contribution:*5. Please indicate how satisfied you are with each of the following aspects of UMKC. Please respond interms of the university as a whole, not in terms of your experience in your major department."During my time at UMKC, I was satisfied with."1 Strongly Disagree2 Moderately Disagree3 Slightly Disagree4 Slightly Agree5 Moderately Agree6 Strongly Agree0 N/AThe admissions processAcademic advising servicesThe registration processThe Financial Aid OfficeCashier’s and CollectionsParking ServicesAthletic facilitiesThe Swinney Recreation CenterThe bookstoreThe variety of coursesThe content of coursesThe quality of instructionThe Miller Nichols LibraryPersonal safety on campusCareer Services and Roo Career NetworkCareer preparationAvailability of faculty outside of classAvailability of courses when you want to take themAvailability of computer servicesIf you would like explain your response to any of the items above, please provide your commentsbelow: (Open field, NOT required)*6. Please indicate how much you agree with the following statements about your college experience.1 Strongly Disagree2 Moderately Disagree3 Slightly Disagree4 Slightly Agree5 Moderately Agree6 Strongly AgreeI feel that UMKC provided a welcoming/supportive environment for me as a student.I feel that UMKC is student-centered.22Graduation Survey Summary Report 2018
*7. If you could go back, knowing what you know now, would you still choose to attend UMKC? (Dropdown item—select one)YesNo*8. Would you recommend UMKC to a friend or family member? (Drop down item—select one)YesNo*9. How would you evaluate your overall experience at UMKC? (Drop down item—select one)1 Poor2 Fair3 Good4 Excellent*10. The previous section asked you to describe your opinion of various services and programs provideduniversity-wide at UMKC. Some departments also provide these same services. Please mark the responsethat best describes your level of satisfaction with your experience within your department."During my time within my department, I was satisfied with.
Each year the University of Missouri - Kansas City conducts a survey of graduating senior students regarding their experiences at the university. The results of this survey provide valuable insights into the effectiveness of UMKC's curricular and co-curricular programs and assist the university in preparing to meet the needs of future students.