Transcription
OCS ReportBOEM 2017-082U.S. Outer Continental ShelfGulf of Mexico RegionOil and Gas Production Forecast:2018-2027U.S. Department of the InteriorBureau of Ocean Energy ManagementGulf of Mexico OCS Region
Cover: Shell’s Olympus tension leg platform (TLP) is part of the Mars B development(forefront), located in 3,100 feet of water (945 m), installed in 2013 and designed with aproduction capacity to exceed over 100,000 BOE per day. Other owners include BP. Photofrom Offshore magazine (accessed on 10/25/2017): html
OCS ReportBOEM 2017-082U.S. Outer Continental ShelfGulf of Mexico RegionOil and Gas Production Forecast:2018 - 2027Principle ContributorsBlake A. ZeringueChee W. YuThomas J. Riches Jr.Thierry M. De CortDonald M. MaclayMatthew G. WilsonU.S. Department of the InteriorBureau of Ocean Energy ManagementGulf of Mexico OCS RegionOffice of Resource EvaluationNew OrleansDecember 2017ii
A MESSAGE FROM THE REGIONAL DIRECTORThe Gulf of Mexico (GOM) remains an important basin for the exploration and development ofoil and gas resources necessary to meet our Nation’s energy needs. Oil production, in the GOM,is at an all-time high and I remain positive about the future production potential which isprojected to continue to rise over the coming years. As of December 2017, 17% of U.S. oilproduction and 5% of natural gas production comes from federal Outer Continental Shelf (OCS)leases in the GOM with more resources yet to be discovered. Estimates of undiscoveredtechnical recoverable resources for the GOM range from 39.48 billion barrels of oil (Bbo) at theP95 percentile to 58.53 Bbo at the P5, with a mean of 48.46 Bbo. Similarly, gas estimates rangefrom 124.01 trillion cubic feet of gas (Tcfg) to 159.63 Tcfg, with a mean of 141.76 Tcfg (BOEM,2017).The Bureau of Ocean Energy Management’s (BOEM), Gulf of Mexico Region is charged withmanaging the development of U.S., Gulf of Mexico, Outer Continental Shelf energy and mineralresources in an environmentally and economically responsible way. Proper stewardship of theOCS requires knowledge of our resources based on the best available science.As directed by the Outer Continental Shelf Lands Act (OSCLA), BOEM strives to share thisknowledge by developing important technical information regarding hydrocarbons on the OCSthat may be useful to industry, federal and state agencies, and the general public for policy andplanning decisions related to the management of OCS resources. In fulfillment of thisrequirement, I am pleased to present the U.S. Outer Continental Shelf Gulf of Mexico Oil andGas Production Forecast: 2018-2027.Michael A. CelataRegional DirectorGulf of Mexico RegionBureau of Ocean Energy Managementiii
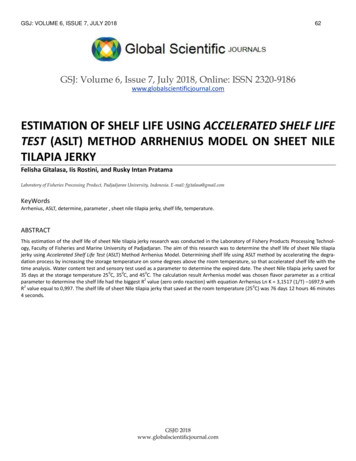
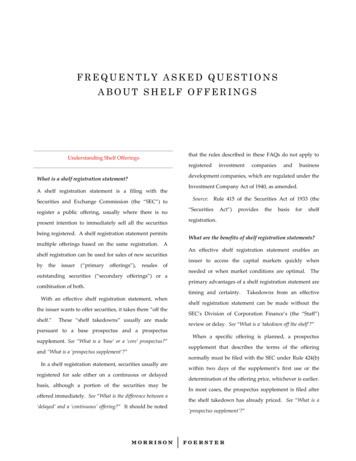
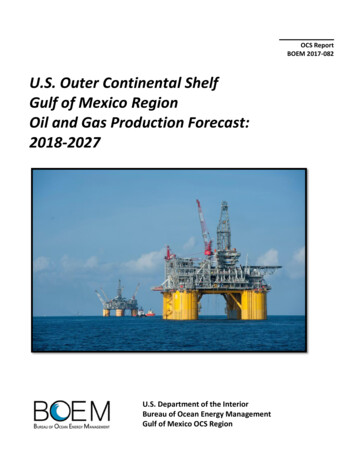
FORECAST HIGHLIGHTSThe Bureau of Ocean Energy Management (BOEM), Gulf of Mexico Region (GOMR) forecasts annualoil production from the U.S. Outer Continental Shelf (OCS), Gulf of Mexico (GOM) in 2018 will set a newrecord high, extending the trend of increased annual production volumes to five consecutive years(2014-2018). BOEM forecasts total annual oil production from the GOM in 2018 will be 606.9 millionbarrels (MMbbls), an increase of more than 3.7 MMbbls from expected 2017 annual oil productionvolumes (Figure 2, Table 2). BOEM also anticipates the trend of increased annual oil production willcontinue through 2024, based on the expectation that the contribution of oil production volumes fromnew and existing fields situated in water depths greater than 400 meters will increase at a rate of 1 to 10MMbbls per year higher than the expected decline in oil production from existing fields and newdiscoveries in less than 400 meters of water (Figure 4 and 6, Table 4 and 6).BOEM’s forecast of total annual natural gas production from the GOM in 2018 is estimated to be1,121 billion cubic feet of gas (BCFG), a decline of 3.8% from expected 2017 gas production volumes.Throughout the forecast period, 2018 - 2027, BOEM anticipates that annual gas production volumes willcontinue to decline but at a lesser rate than the historical annual decline rates recorded for the Regionsince 1990. BOEM anticipates annual gas production volumes from 2018 to 2027 will remain relativelyconsistent, ranging between 1,065 and 1,121 BCF per year and forecasts the average rate of decline forgas production during the period will be less than 1% annually (Figure 3, Table 3). The improvement inthe forecast annual rate of decline for gas production from the GOM is based on the expectation thatthe production of associated-gas from fields in water depths greater than 400 meters will offset theanticipated decline of gas production from fields situated in less than 400 meters of water (Figures 5 and7, Tables 5 and 7).iv
TABLE OF CONTENTSA MESSAGE FROM THE REGIONAL DIRECTOR . iiiFORECAST HIGHLIGHTS . ivTABLE OF CONTENTS. vFIGURES. vTABLES. vABBREVIATIONS AND ACRONYMS . viINTRODUCTION . 1FORECAST FRAMEWORK. 2RISK AND UNCERTAINTY . 5METHODOLOGY . 5Reserves . 6Contingent Resources . 6Undiscovered Resources. 7CONCLUSIONS . 8REFERENCES . 23GLOSSARY. 23FIGURESFigure 1. OCS, Gulf of Mexico Deepwater and Shallow Water Areas Considered in this Report. . 2Figure 2. Gulf of Mexico, Annual Oil Production (bbls/year). 11Figure 3. Gulf of Mexico, Annual Gas Production (Mcf/year). . 13Figure 4. Gulf of Mexico, Shallow Water, Daily Oil Production Rate (bbls/day). . 15Figure 5. Gulf of Mexico, Shallow Water, Daily Gas Production Rate (Mcf/day). . 17Figure 6. Gulf of Mexico, Deepwater, Daily Oil Production Rate (bbls/day). . 19Figure 7. Gulf of Mexico, Deepwater, Daily Gas Production (Mcf/day). . 21TABLESTable 1. BOEM Classification Framework. Modified from Burgess et al. (2016). . 3Table 2. Gulf of Mexico, Annual Oil Production (bbls/year). . 12Table 3. Gulf of Mexico, Annual Gas Production (Mcf/year). 14Table 4. Gulf of Mexico, Shallow Water, Daily Oil Production Rate (bbls/day). 16Table 5. Gulf of Mexico, Shallow Water, Daily Gas Production Rate (Mcf/day) . 18Table 6. Gulf of Mexico, Deepwater, Daily Oil Production Rate (bbls/day). . 20Table 7. Gulf of Mexico, Deepwater, Daily Gas Production (Mcf/day). . 22v
ABBREVIATIONS AND ion barrelsbarrelsbillion barrels of oilbillion cubic feetbillion cubic feet of gasbillion cubic feet per daybarrels of oil equivalentBureau of Ocean Energy ManagementFair Market ValuefeetGulf of Mexicometersthousand cubic feetmillion barrelsmillion barrels of oil equivalentMinerals Management ServiceOuter Continental ShelfOuter Continental Shelf Lands ActPetroleum Resource Management SystemOffice of Resource EvaluationSociety of Petroleum Engineerstrillion cubic feet of gasundiscovered economically recoverable resourcesUnited Statesundiscovered technically recoverable resourcesvi
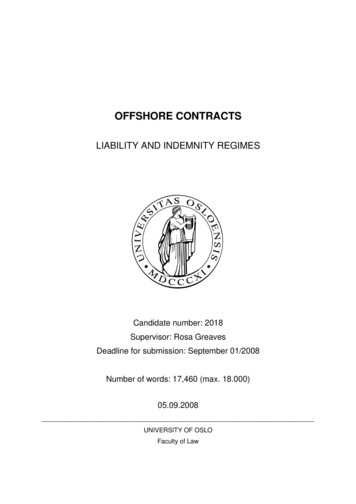
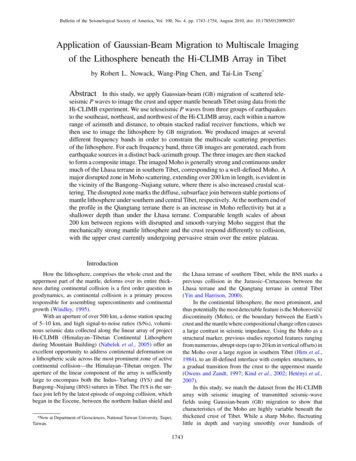
INTRODUCTIONThe U.S. Outer Continental Shelf Gulf of Mexico Region Oil and Gas Production Forecast: 2018 – 2027provides the public with the Bureau of Ocean Energy Management’s 10-year annual oil and gasproduction outlook for the U.S. Outer Continental Shelf (OCS), Gulf of Mexico (GOM). The OCS of theGOM comprises all areas of the submerged seabed in the Gulf of Mexico where the mineral estate issubject to U.S. Federal Government jurisdiction; however, the forecasts provided in this report arelimited to oil and gas volumes produced from the Central and Western planning areas and a smallportion of the Eastern planning area that is available for leasing under BOEM’s 2017-2022 National OCSOil and Gas Leasing Program. (Figure 1).This forecast provides estimates of annual oil and gas production volumes and average daily oil andgas production rates. Production estimates are provided for both shallow water and deepwater. In thisreport, shallow water is defined by water depths less than 400 meters (1312 ft.) and deepwater isgreater than or equal to 400 meters (Figure 1). The water depth category of an oil and gas field isdefined by the deepest water depth found on a lease within that field.The petroleum commodities assessed and reported in this forecast are crude oil, natural gas liquids(condensate), and natural gas that exist in conventional reservoirs and are producible with conventionalrecovery techniques. Crude oil and condensate are reported jointly as oil; associated and non-associatedgas are reported jointly as gas. Oil volumes are reported as stock tank barrels (bbl) and gas as athousand cubic feet (Mcf).The U.S. Outer Continental Shelf Gulf of Mexico Region Oil and Gas Production Forecast: 2018 – 2027is the first production forecast report published by BOEM and the first report of its kind published by theGulf of Mexico Region since 2009 (MMS, 2009).1
Figure 1. OCS, Gulf of Mexico Deepwater and Shallow Water Areas Considered in this Report.FORECAST FRAMEWORKThere have been significant changes to the production forecast framework and methodology sincethe 2009 report. Starting with the December 31, 2008 Estimated Oil and Gas Reserves Report publishedin 2012, BOEM revised its resource and reserve classification system (Table 1) to closely align to theSociety of Petroleum Engineers (SPE) Petroleum Resources Management System (PRMS).2
BOEM Classification FrameworkClassesSub-ClassesReservesDeveloped ProducingDeveloped Non-ProducingUndevelopedReserves Justified for DevelopmentContingent ResourcesUnrecoverableUndiscovered ResourcesUERR estimates for leased prospects,unleased prospects, and resourcesyet to be identified are forecast inthis report.Increasing Chance of CommercialityCumulative ProductionUnrecoverableTable 1. BOEM Classification Framework. Modified from Burgess et al. (2016).Consistent with this framework, this report forecasts production by Reserves, Contingent Resources, andUndiscovered Resources. In contrast, the Gulf of Mexico Oil and Gas Production Forecast: 2009-2018included a committed scenario, full potential scenario, and undiscovered resources. These categoriesroughly align with Reserves, Contingent Resources, and Undiscovered Resources respectively; however,there are differences in the data sets and methodologies relied upon to develop the forecast.This report relies solely on independent estimates of oil and gas reserves and resources derived bygeologists, geophysicists, and engineers within the BOEM, Gulf of Mexico, Office of Resource Evaluation(RE). BOEM, GOMR has production data, reservoir data, and reserves estimates on over 1300 fieldscomprised of 36,000 reservoirs in the GOM. A complete discussion of the terminology and methodsused to estimate reserves is provided in the BOEM report, Estimated Oil and Gas Reserves Gulf ofMexico OCS Region, December 31, 2015.3
Estimates of Contingent Resources are derived using similar methodologies to those used to estimateReserves. Previous production forecast reports relied on industry surveys to provide estimates of newlydiscovered fields or projects as the basis for the full potential scenario. BOEM, GOMR does utilizeindustry announcements and plan submittals to determine when a project or field may come online(begin production); however, all volumetric estimates are independently derived.Forecasts of production from Undiscovered Resources were developed by considering riskedUndiscovered Economically Recoverable Resources (UERR) that include oil or gas prospects identified onleased acreage, prospects or leads identified on unleased acreage, and yet to be identified oil and gasresources on unleased acreage. BOEM, GOMR maintains an extensive database of leased and unleasedprospects identified and evaluated for the purpose of determining the Fair Market Value (FMV) of tractsbid upon during GOM OCS Lease Sales. Prospects on leased acreage are assumed to begin productionearlier than prospects on unleased acreage.Both contribute to the production forecast moresignificantly in later years. UERRs resulting from the BOEM, Assessment of Technically and EconomicallyRecoverable Hydrocarbon Resources of the Nation’s Outer Continental Shelf as of January 1, 2014 (i.e.yet to be identified oil and gas resources) are the final category of resources considered for this report.These UERRs are a portion of the assessed Undiscovered Technically Recoverable Resources (UTRR)considered to be economically recoverable at a price of 40/bbl and 2.14/Mcf.Estimates aredeveloped using complex computer models that incorporate specific geologic information,mathematical and statistical analyses, risk and probability, and assumptions pertaining to economicscenarios, petroleum engineering data, and technical assumptions (BOEM, 2017). Given the extendedtime period needed to take a prospect from discovery to production, prospective resources that havenot been identified have the least amount of impact initially on the production forecast.4
RISK AND UNCERTAINTYThis report contains forward looking statements concerning exploration, development, productionactivity, and operations of a wide range of private businesses that are directly or indirectly involved inthe development of oil and gas resources on the OCS of the U.S. Gulf of Mexico. All text, figures, tables,charts, and graphs other than those that state or represent historical fact are forward-lookingstatements. Forward-looking statements in this report reflect BOEM, GOMR’s current expectations foroil and gas production from the GOM, OCS and include known and unknown risks and uncertainties thatmay cause actual results to differ materially from those expressed or implied.There are numerous factors which may alter the results of the forecasts. Production volumes fromundiscovered oil and gas accumulations, anticipated new projects, expected volumes from new in-fielddrilling, and re-completions in existing fields represent the most critical elements of risk in the latteryears of the forecast, more-so than in the early years, when the production profiles are basedpredominantly on oil and gas production volumes derived from active completions in existing fields.Uncertainty exists throughout the forecast period; it is initially introduced to the production profilesthrough the decline analysis performed on active completions, and later compounded by variablesassociated with initial production, peak rate, decline rate, recoverable volume, activity scheduling, andmarket volatility.METHODOLOGYThe oil and gas production forecasts were developed using oil and gas reservoir analysis software andspreadsheet-based data analysis tools. Historical data and forward-looking information were used inthe analyses conducted to develop the forecasts. Historical data used includes oil and gas leasing,exploration, development, production, infrastructure fabrication and installation activity, and activitytrends. Forward looking information used in the analyses was gathered from proprietary and publically5
available oil and gas activity plans, company reports, press releases, professional journals and industrypublications.RESERVESThe Reserves portion of the production forecast is comprised of hydrocarbons that are discovered,recoverable, commercial, and remaining.Reserves are divided into four sub-classes: DevelopedProducing, Developed Non-Producing, Undeveloped, and Reserves Justified for Development (Table 1).For forecasting purposes, Reserves subclasses were combined into two main categories; Developed andUndeveloped Reserves. Developed Reserves include both Developed Producing and Developed NonProducing Reserves whereas the Undeveloped Reserves category includes Undeveloped Reserves andReserves Justified for Development.The expected production from Developed Reserves was forecast by performing exponential declinecurve analysis on each producing reservoir. The Undeveloped Reserves are the remaining volumes of oiland gas that would not be produced from the currently producing completions. The production fromUndeveloped Reserves was forecast using a spreadsheet-based data analysis tool to estimate theannualized oil and gas production volumes.Historical field production profiles, individual wellperformance, and exploration and development activities were analyzed and used in the model toschedule out future production.CONTINGENT RESOURCESThe Contingent Resources contain reservoirs that are in developed fields and in Contingent Resourcefields that are yet to be developed. Production from Contingent Resource reservoir volumes that are indeveloped fields is forecast using the same spreadsheet-based data analysis tool as the UndevelopedReserves.The production forecast of the Contingent Resource fields that are yet to be developed is based onthe following assumptions:6
1.) Ultimate recoverable volumes are taken from independent, proprietary BOEM assessments.2.) During the first year of production, each project is assumed to produce at half its peak rate.3.) Projects with discovered resource volumes over 200 MMBOE are assumed to reach peakproduction in their second year, sustain that peak rate for a total of 4 years, then decline at aneffective annual 12 percent rate from that time forward.4.) The estimated peak production rate for each project is based on the estimated recoverablereserves as follows: Peak Rate (0.0003)*(ult rec rsvs) 11025The peak rate is in barrels of oil equivalent (BOE) per day and the ultimate recoverable reserves (ultrec rsvs) are in BOE. This relationship was derived by plotting maximum production rates of knownfields against the ultimate recoverable reserves of those fields and performing a linear regression.BOE production rates were separated to oil and gas streams based on the anticipated gas oil ratiosfor each field. Note that BOEM reserve estimates are on a field basis, so we assume that thisrelationship, based on historic field trends, can be applied on a project basis.5.) The year when each discovery is expected to begin production is estimated by using availableinformation from exploration and development plans as well as press releases.UNDISCOVERED RESOURCESThe Undiscovered Resources section of the forecast is represented by oil and gas production volumesthat exist in yet-to-be discovered fields that are anticipated to commence production during theforecast period. There are three categories that we evaluated for Undiscovered Resources. The first isleased identified, which is primarily made up of leased prospects that BOEM evaluated during the FairMarket Value determination process on tracts bid upon in GOM lease sales. The next component isunleased identified resources, which is comprised of prospects that were evaluated during a lease sale,but are not leased. The third category is unleased, unidentified resources, which are portions of7
assessed resource volumes from the BOEM, Assessment of Technically and Economically RecoverableHydrocarbon Resources of the Gulf of Mexico Outer Continental Shelf as of January 1, 2014.The forecast methodology for the Undiscovered Resources is very similar to that of the ContingentResources in undeveloped fields as explained in the previous section. The historical annual data for pastfield discoveries, development activities, and production are used to predict how the identifiedresources will be developed during the forecast timeline. BOEM assumes that the leased identifiedresources will begin producing before the unleased identified resources. The unleased unidentifiedresources are; last to contribute to the forecast, most uncertain category of undiscovered resources,and not expected to contribute greatly to the production forecast until the very last few years.CONCLUSIONSHistoric oil production in the Gulf of Mexico increased steadily from 1990 through 2002, leveled off in2003, and declined dramatically in 2004 and 2005 (Figure 2, Table 2). The sharp decline seen was causedin large part by Hurricane Ivan in 2004 and hurricanes Katrina and Rita in 2005. During 2006 and 2007,oil production remained steady, but had not reached pre-hurricane Katrina production volumes. The2008 oil production volumes again show a sharp decline, due in large part to damage from hurricanesGustav and Ike. In 2009 and 2010, oil production increased to 2002 levels; however, following the 2010Deepwater Horizon incident, production dropped back down to 2005 levels. Hurricane Isaac in 2012may have also had some impact in this time period. In 2014, oil production started to increase and isexpected to reach a record high in 2017. Although shallow water oil production declined steadily since1997 (Figure 4, Table 4), increasing deepwater oil production offset most of these losses during thatperiod (Figure 6, Table 6).Historic gas production in the GOM was fairly level from 1990 through 2001 when the Gulf OCScontributed between 4,750 to 5,260 BCFG to the total annual volume of U.S. domestic natural gasproduction (Figure 3, Table 3). From 2002 to 2012, total annual gas production declined 66% from 4,5398
billion cubic feet (BCF) in 2002 to 1,542 BCF in 2012, an average annual decline rate of just over 10%.Since 2013, annual gas production volumes from the GOM have continued to decline from 1,334 BCF in2013 to 1,166 BCF in 2017 (forecast) but the annual rate of decline over the five-year period has slowedto an average annual rate near 5% due, in part, to a modest increase of 2.3% in 2015 from 2014 annualvolumes. The significant shallow water gas production decline since 2002 (Figure 5, Table 5), was notoffset by deepwater gas production during that period (Figure 7, Table 7).Total annual oil production from the GOM, OCS in 2017 is expected to exceed 603 MMbbls, making itthe fourth consecutive year of increased annual oil production since 2013 when total annual oilproduction was just under 459.3 MMbbls (Figure 2, Table 2). BOEM forecasts total annual oil productionfrom the OCS, GOM, in 2018 will again set a new record high at 606.9 MMbbls, exceeding the totalvolume produced in 2017 by more than 3.7 MMbbls. BOEM expects the trend of annual increased oilproduction volumes to continue adding between 1 and 10 MMbbls per year, setting new record highs ineach successive year through 2024 when 642 MMbbls are expected to be produced from the Region.BOEM’s forecast identifies 2026 as the peak year for total annual oil production during the 10-yearforecast period when total annual oil production is forecast to reach 644.7 MMbbls, an increase of 41.6MMbbls from the expected 2017 annual oil production volumes. The anticipated increase in oilproduction reflects the addition of volumes associated with Undeveloped Reserves, ContingentResource reservoirs, and Undiscovered Resources that are expected to be developed. Although shallowwater oil production is expected to decline slightly (Figure 4, Table 4), deepwater oil production isexpected to more than offset the shallow water production decline (Figure 6, Table 6).The forecast of total annual natural gas production from the GOM in 2018 is estimated to be 1,121billion cubic feet of gas (BCFG), a decline of 3.8% from expected 2017 gas production volumes but aslight improvement in the annual rate of decline since 2015 (Figure 3, Table 3). During the forecastperiod 2018 - 2027, the BOEM, GOMR anticipates that the average annual rate of decline for gas9
production will be less than 1%, holding annual gas production volumes relatively consistent, rangingbetween 1,045 and 1,121 BCF per year. The improvement in the forecast annual rate of decline for gasproduction from the GOM is based on the expectation that the production of associated-gas from fieldsin water depths greater than 400 meters will offset the anticipated decline of gas production from fieldssituated in less than 400 meters of water (Figures 5 and 7, Tables 5 and 7).Each component described in this report (Reserves, Contingent Resources, and UndiscoveredResources) adds potential GOM oil production to the forecast and maintains GOM gas production duringthe forecast period; however, uncertainty increases with each subsequent component. The data fromeach component used in this report are presented in Figures 2 and 3, and Tables 2 and 3 on a totalannual basis, and in Figures 4 through 7, and Tables 4 through 7 on a daily basis for shallow water anddeepwater. GOM oil production is expected to increase within the forecast period and GOM gasproduction is expected to remain somewhat flat. The contributions from Undiscovered Resources in thelater years of the forecast period show the importance of BOEM, GOM Region’s mission to support thecontinued exploration and development of the nation’s offshore hydrocarbon resources.10
Figure 2. Gulf of Mexico, Annual Oil Production (bbls/year).11
8553,112,427585,361,9592017 ndiscoveredResourcesTotal Annual lume in bbls/yearTable 2. Gulf of Mexico, Annual Oil Production (bbls/year).12
Figure 3. Gulf of Mexico, Annual Gas Production (Mcf/year).13
51,311,675,1171,221,892,6692017 ndiscoveredResourcesTotal Annual 65,360,6291,165,960,926Volume in Mcf/yearTable 3. Gulf of Mexico, Annual Gas Production (Mcf/year).14
Figure 4. Gulf of Mexico, Shallow Water, Daily Oil Production Rate (bbls/day).15
01200220032004200520062007200
The U.S. Outer Continental Shelf Gulf of Mexico Region Oil and Gas Production Forecast: 2018 2027 - provides the public with the Bureau of Ocean Energy Management's 10-year annual oil and gas production outlook for the U.S. Outer Continental Shelf (OCS), Gulf of Mexico (GOM). The OCS of the