Transcription
“Two truths and a lie” as a class-participation activity Andrew Gelman†20 Mar 2022AbstractWe adapt the social game “Two truths and a lie” to a classroom setting to give an activity thatintroduces principles of statistical measurement, uncertainty, prediction, and calibration, whilegiving students an opportunity to meet each other. We discuss how this activity can be used ina range of different statistics courses.1.BackgroundClass-participation activities are useful in many settings, but especially so at the beginning of thesemester, where they can help build community and set up a norm of active student involvement.Here we describe an statistics-based activity that has the additional benefit of allowing studentsget to know each other on a social level.There is a large literature on the benefits of active learning—classroom interactions that involvestudents doing things, talking with each other, and solving problems together; see, for example,Bligh (2000) regarding college teaching in general, and Cobb (1992), Magel (1998), Nolan and Speed(2000), and Rossman and Chance (2001) on statistics education more specifically. As Mazur andWatkins (2009) discuss in the context of physics instruction, active learning provides a “structuredenvironment” that facilitates collaboration and awareness of learning strategies, and can work insmall or large classrooms. It is recommended that each class-participation activity directly involvesthe students while being tied to a particular topic being covered in the course, and this has ledto efforts such as Gnanadesikan et al. (1997) and Rossman and Chance (2008) to integrate activelearning within introductory statistics courses. In the present article, we describe an activity that isdesigned to get students involved in class and with each other and which relates to several differentareas of statistics. We designed and tested the activity in a class on applied regression for socialscientists, but we think it should work in a wide variety of statistics courses.2.The “Two truths and a lie” activity: Data gathering and analysisThis activity can be performed during the first week of class or later on during the semester if thatseems to better fit with the sequence of topics in the course.We start the activity by dividing students into groups of four—it’s fine if some groups have threeor five students in them—to play “two truths and a lie.” We display the instructions in Figure 1onto the screen and explain the procedure. In this game, one person makes three statements abouthim or herself; two of these statements should be true and one should be false. The other studentsin the group should then briefly confer and together guess which statement is the lie. They shouldjointly construct a numerical statement of their certainty about their guess, on a 0–10 scale, where0 represents pure guessing and 10 corresponds to complete certainty. The true statement is thenrevealed so that the students know if they guessed correctly. Each group of students then rotates To appear in The American Statistician. We thank the students in our class for their participation and threeanonymous reviewers for helpful comments.†Department of Statistics and Department of Political Science, Columbia University, New York.
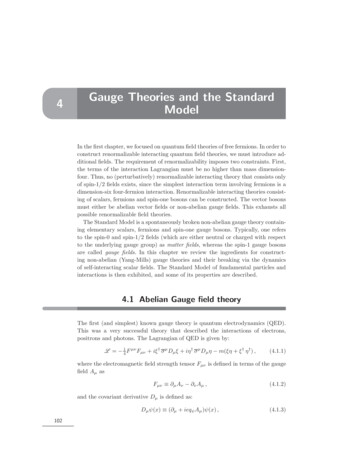
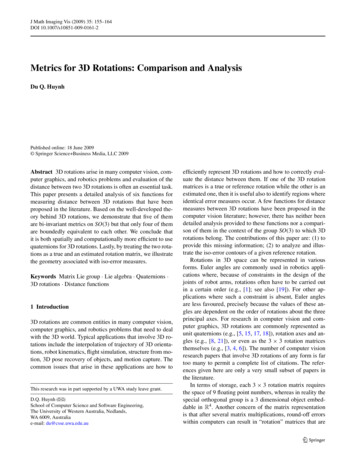
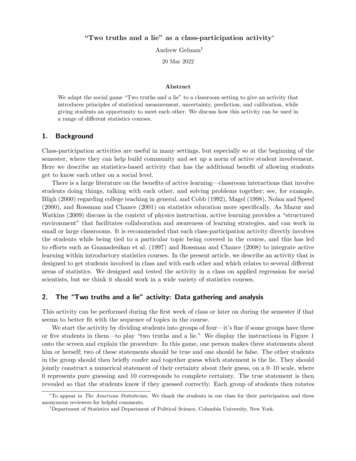
Within your group:1. One person tells three personal statements, one of which is a lie.2. Others discuss and guess which statement is the lie, and theyjointly construct a numerical statement of their certainty in theguess (on a 0–10 scale).3. The storyteller reveals which was the lie.4. Enter the certainty number and the outcome (success or failure)and submit in the Google form.Rotate through everyone in your group so that each person plays thestoryteller role once.Figure 1: Instructions for the “two truths and a lie” activity, to project onto the screen for students.through, with each student playing the role of storyteller, so that when the activity is over, eachgroup of four students has produced four certainty numbers, each corresponding to a success orfailure. Figure 2 shows an example.We then give students the url of a Google form where they can enter their data using theirphone or laptop. The form is set up to take one response at a time, so each group should enterfour responses corresponding to their four guesses. Alternatively we could set up a longer Googleform allowing a group to enter all four responses together, but that would require additional dataprocessing on the analysis end, so we go with this simpler approach that does not keep track of theclustering of the responses.We download the data from the Google form as a csv file, read it into our statistical software, andannounce that we will display the data (a scatterplot of the success/failure outcome vs. certaintyscore) along with a fitted curve showing probability of the guess being correct as a function ofcertainty score. If the class is sufficiently advanced, we explain that the fitted curve will be alogistic regression; otherwise we simply say we will fit a curve.Before making the plot and displaying the data and fit, we we ask students in their groups tosketch what they think the scatterplot and fitted curve for the class will look like, and then we leadthe class in discussion. Some possible prompts include: What do you think the range of certaintyscores will look like: will there be any 0’s or 10’s? Will there be a positive relation between x andy: are guesses with higher certainty be more accurate, on average? How strong will the relation bebetween x and y: what will the curve look like? If students have seen logistic regression, we askthem to give approximate numerical values for the intercept and slope coefficients correspondingto their sketched curves.After this discussion, we display the data and fitted curve and conduct a follow-up discussionof what has been learned. Figure 3 shows an example of real data from an applied regression class.In this case, there is essentially no relation between the certainty score and the outcome (coded as1 for a successful guess and 0 for an error). In fact, the estimated logistic regression coefficient isnegative: higher certainty scores correspond to slightly lower rates of accuracy! It’s hard to see thisin the plot of raw responses; in general, scatterplots are not so helpful for displaying discrete data.The standard error from the regression gives a sense of the uncertainty in the fit; in this case, theright panel of Figure 3 shows an estimated slope of 0.08 with standard error 0.15, indicating that2
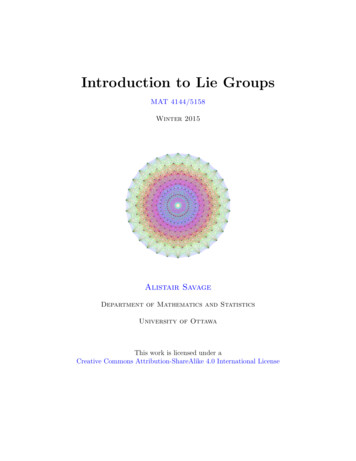
tcome0.51.0Figure 2: (a) Example of data produced by a group of four students playing the “two truths anda lie” game. Each number is a group consensus: here, the group of students B, C, D assigned acertainty of 8 to their guess of student A’s lie, and they were correct; students A, C, D assigneda certainty of 4 to their guess of student B’s lie, and they happened to be correct, and so on. (b)Students play the game in groups and then enter the data one at a time into a Google form, so thatthe instructor can analyze all the results together.CoefficientInterceptSlopeEstimate (s.e.)0.23 (0.77) 0.08 (0.15)0.0Pr(y 1) invlogit(0.23 0.08*x)05Certainty score10Figure 3: (a) Scatterplot from the “two truths and a lie” activity performed in a class of 49 students,along with a curve showing a fitted model predicting correctness given the certainty scores (whichhave been jittered to avoid points overlapping on the graph); (b) Coefficient estimates and standarderrors from the fitted logistic regression. The instructor can perform these steps in real time on thedata that students entered in their Google forms.3
the sign of the underlying relationship is unclear from the data. For this class, the students’ statedcertainty scores do not form a useful predictor of their actual knowledge.In the discussion that followed in our class, students conjectured why their guesses were sobad (23 our 49 correct, not much better than the 1/3 success rate that would come from randomguessing) and why their certainty judgments were not predictive of their accuracy. In many ways,the class discussion before seeing the data was better than the post-data followup, which illustratesa general point that concepts can sometimes be clearer in theory, with real data providing a usefulcheck on speculation.For any particular class, the interpretation of the “two truths and a lie” experiment will dependon the data that come in, and you should be prepared for anything. In the class discussion beforethe scatterplot and fitted model are revealed, it is natural for students to expect the certainty scoreto be a strong predictor of empirical accuracy. If this occurs, great; if not, this is an excellentopportunity to discuss the challenges of measurement and the value of statistical evaluation of ameasurement protocol.3.Adapting the activity to courses at different levelsThe “Two truths and a lie” game should be fun for any group of students, but the relevant statistical lesson will depend on the level of the course being taught. This activity connects to severalimportant topics, including measurement, uncertainty, prediction, calibration, and logistic regression. Because of its social aspect, it makes sense to do this during the first or second week of thesemester, but it is also always important to explicitly connect classroom activities to the materialbeing covered that week, as well as to the course as whole. We give some details about how thiscould go for a few different courses at different levels.3.1.Introductory statisticsFor an introductory course, the focus can be on probability and uncertainty. Before the activitybegins, ask students to speculate on how accurate their guesses will be? On average, will they beable to guess the lie every time? 90% of the time? 50%? More than 33%, we hope, right? This canbe an opportunity to introduce the concept of a null hypothesis: from pure random guessing, thenumber of correct guesses would have the binomial distribution with probability 1/3. Dependingon when during the semester this activity is done, we can follow up with an estimate of averagesuccess probability with standard error, a confidence interval, and a hypothesis test. At the sametime it is important to keep the larger perspective of the sampling distribution, so when presentingthese results we should engage the students in discussion of how these numbers would all changeif the data were different: with the given n, how many successful guesses would be needed for thenull hypothesis to be rejected at the 5% level or the 95% interval for the success rate to exclude1/3, and so forth.We can connect this to other problems of probability estimation such as weather forecasting,election forecasting, and so on. We can display the fitted curve without going into detail on logisticregression, just giving this as an example of an advanced statistical method. For an exampleduring the first weeks of an introductory class, the lesson here is not any particular technique, butrather the way that statistical analysis can be used to learn information from subjective certaintystatements. Statistical modeling is playing an important role as a bridge between the qualitativeand quantitative worlds.4
3.2.Bayesian statisticsFor a course on Bayesian statistics, the activity can be used to demonstrate the principle of calibration. In this activity, the certainty judgments represent prior information but not prior distributions,and the step of fitting a model to predict accuracy of guesses y given certainty judgments x canbe seen as a data-based construction of a prior distribution. For example, suppose the model isPr(y 1) logit 1 ( 0.6 0.3x); this corresponds to a probability of correct guess ranging from0.35 when x 0 to 0.92 when x 10, and for a new guess with certainty judgment x, the valuelogit 1 ( 0.6 0.3x) can be taken as the prior probability that this guess is correct. The point hereis that priors for real problems can be calibrated based on the accuracy of past guesses; this is, forexample, how point spreads for sporting events can be translated into betting odds (Stern, 1997).These points can be placed in the context of a class discussion via a series of prompts. Asalways, it is best to start the discussion before the data have been revealed. To start, studentscan consider in pairs what is their prior probability that a particular guess is correct: at whatodds would they be willing to bet that they actually caught the lie? The next question is howthis prior probability varies with x. From this they can see the certainty judgments as a device forconstructing an empirical prior distribution. We can then ask how large a dataset might be neededfor this prior to be useful in practice. It is easiest to get a sense of this using simulation, startingwith some assumption about the function E(y x), trying out a sample size, simulating data, andseeing what the plot of E(y) vs. x looks like. The connection of all this to the class-participationactivity is that, by giving the certainty statements and guesses themselves, students should get apicture of the challenges of constructing empirically-based priors.3.3.Generalized linear models or machine learningFor a class on generalized linear models or machine learning, you can use this as an introduction tologistic regression, showing the details of fitting and graphing the model, interpreting the coefficientestimates and standard errors, and using the prediction from the model to make probabilisticforecasts for new cases. Here the activity ties directly into the material taught in the class, andafter the model has been fit, graphed, and explained, there is a sequence of logical followups.Students can discuss the range of predicted probabilities: will they always fall between 0 and 1?(Yes.) Will they always fall between 1/3 and 1? (Not necessarily.) How many measurements wouldbe necessary for the slope of the curve to be estimated with some desired level of accuracy? (We can approximately figure this out using the rule that the standard error scales like 1/ n and canalso check by simulating fake data.)Depending on the course material, this activity can be followed up in different ways. Forexample, a simulation can be performed to assess the statistical power of the study given samplesize n, the distribution of observed certainty scores x in the observed data, and assumed values ofthe intercept a and slope b of the logistic regression; in R:n loop - 1000slope est - rep(NA, n loop)slope se - rep(NA, n loop)for (i in 1:n loop){x sim - sample(x, n, replace TRUE)y sim - rbinom(n, 1, invlogit(a b*x sim))sim - data.frame(x sim, y sim)fit - glm(y sim x sim, family binomial(link "logit"), data sim)5
slope est[i] - coef(fit)["x sim"]slope se[i] - se.coef(fit)["x sim"]}power - mean(abs(slope est)/slope se 2)Here we have computed the power following the conventional rule that the estimated slope isstatistically significant if it is more than two standard errors from zero. There is no need toperform this particular calculation; we are just illustrating how the data collected in this activitycan be used as a starting point for relevant lessons.3.4.Psychometrics and multilevel modelingAnother direction is to turn this into a lesson on reliability and validity of measurement. What ismeant by that certainty score? How useful would we expect the certainty score to be in making aprobabilistic forecast? This sort of calibration problem arises in many areas of science and policy.For example, consider a hiring setting where interviewers give numerical ratings for the candidates,and then later when there is data on job performance, the ratings can be retrospectively calibrated.One direction is to set up some comparison points, for example by asking respondents to givecertainty scores for other outcomes such as weather or sporting events. There is a large literatureon the difficulty of assessing accuracy of subjective guesses; see for example Nisbett and Wilson(1977) and Vredeveldt and Sauer (2014).For a class on psychometrics or multilevel modeling, this discussion of measurement can serveas an entry point to the design and analysis of repeated measures data. What if the confidence ofthe guess is highly predictive of accuracy at the individual level, but with an effect that disappearswhen aggregated across guessers? Students can discuss in pairs how such a pattern can arise, ifless accurate guessers tend also to be overconfident. To learn this pattern we would need to gathermultiple measurements on each guesser, for example by having students make guesses and certaintystatements individually rather than via consultation, and then the resulting data could be fit usinga multilevel model with intercept and perhaps slope that vary by guesser.4.DiscussionA key part of any class-participation activity is how things go after the data have been collectedand analyzed.We do not want to just dump the data and analysis (as in Figure 3) onto the screen and stopthere. It is fun when an activity has a twist, but it is not a magic trick; the point is not to amazestudents but to bring them closer to the material being taught. We want the activity not to mystifybut to de-mystify. So it is important to follow up the activity with explicit discussion, both of itsconnection to the material being taught in the class and its relevance to real-world applications ofstatistics in areas such as education, business, politics, or health, depending on the interests of thestudents.We can also consider what lessons students might take away from this activity. “Statistics isfun”: that’s a good memory. “I got fooled by Jason’s lie: he’s not really adopted”: that’s fine too,as it serves the goal of students getting to know each other. “You can use logistic regression toconvert a certainty score into a predicted probability”: that’s good because it’s a vivification ofa general mathematical lesson. “The estimated slope was smaller than the standard error so wecouldn’t distinguish it from zero”: that’s not a bad lesson either. Think about what memories youwant to create, and keep the discussion focused. For example, the details of the truths and lies are6
fun, and there could be a temptation to share some of the most successful lies with the class—butfor a class on statistics or research methods, those sorts of details could be counterproductive,eliciting memories that would distract from the statistical lessons. We want the activity to be vividand memorable but for the right reasons.In our experience we have seen three sorts of positive outcomes associated with this sort ofactivity, especially when performed near the beginning of the semester. The first is that studentsget used to the idea that attendance is active, not passive, and we hope the alertness required toperform these activities translates into better participation throughout the class period. The secondis that people typically find data more interesting and relatable when they can see themselves inthe scatterplot. The third valuable outcome is that the “Two truths and a lie” activity is a socialicebreaker. That said, we do not have direct empirical evidence of the effectiveness of this activityon student learning. It is our hope that in laying out this activity—not just the general concepts butalso the details of implementation, including instructions, Google form, sample data and analysis,and post-analysis discussion points—we have lowered the barrier of difficulty so that instructors ina wide range of statistics courses can try it out in their own classes, at minimal cost in classroomtime and with the potential to get students more involved in their learning of statistics.That said, we have not offered any formal evaluation of this activity. As is typically the casein education, it is easier to develop a new idea than it is to quantitatively evaluate its effects inthe classroom (Chance et al., 2008, Gelman and Loken, 2012). We can still learn from experience,but such learning tends to be qualitative, from observing student reactions and discussions. Thebiggest risk or opportunity cost we see in introducing a new class-participation activity is that timespent in the activity could be spent working on lecturing or problem solving. For this reason, it isimportant that the activity be closely tied to the course material (as discussed in Section 3) andthat it be performed efficiently, with instructions and Google form prepared ahead of time and withcode all set up to analyze the data when they come in. You can also use the present article as atemplate for designing and implementing your own class-participation activities.ReferencesBligh, D. A. (2000). What’s the Point in Discussion? Exeter, England: Intellect.Chance, B., Garfield, J., Medina, E., and Ben-Zvi, D. (2008). Assessment in statistics education.In Developing Students’ Statistical Reasoning: Connecting Research and Teaching Practice, ed.J. Garfield and D. Ben-Zvi. New York: Springer.Cobb, G. (1992). Teaching statistics. In Heeding the Call for Change: Suggestions for CurricularAction, ed. L. A. Steen, 3–34. Mathematical Association of America.Gelman, A., and Loken, E. (2012). Statisticians: When we teach, we don’t practice what we preach.Chance 25 (1), 47–48.Gnanadesikan, M., Scheaffer, R. L., Watkins, A. E., and Witmer, J. A. (1997). An activity-basedstatistics course. Journal of Statistics Education 5 (2).Magel, R. C. (1998). Using cooperative learning in a large introductory statistics class. Journal ofStatistics Education 6 (3).Mazur, E., and Watkins, J. (2009). Just-in-time teaching and peer instruction. In Just in TimeTeaching: Across the Disciplines, Across the Academy, ed. S. Simkins and M. H. Maier, 39–62.Sterling, Va.: Stylus Publishing.Nisbett, R. E., and Wilson, T. D. (1977). Telling more than we can know: Verbal reports on mentalprocesses. Psychological Review 84, 231–259.7
Nolan, D., and Speed, T. (2000). Stat Labs: Mathematical Statistics Through Applications. NewYork: Springer-Verlag.Rossman, A., and Chance, B. (2001). Teaching contemporary statistics through active Rossman, A. J., and Chance, B. L. (2008). Workshop Statistics: Discovery with Data, third edition.New York: Key College Publishing.Stern, H. S. (1997). How accurately can sports outcomes be predicted? Chance 10 (4), 19–23.Vredeveldt, A., and Sauer, J. D. (2015). Effects of eye-closure on confidence-accuracy relations ineyewitness testimony. Journal of Applied Research in Memory and Cognition 4, 51–58.8
Within your group: 1.One person tells three personal statements, one of which is a lie. 2.Others discuss and guess which statement is the lie, and they jointly construct a numerical statement of their certainty in the guess (on a 0{10 scale). 3.The storyteller reveals which was the lie. 4.Enter the certainty number and the outcome (success or fa.