Transcription
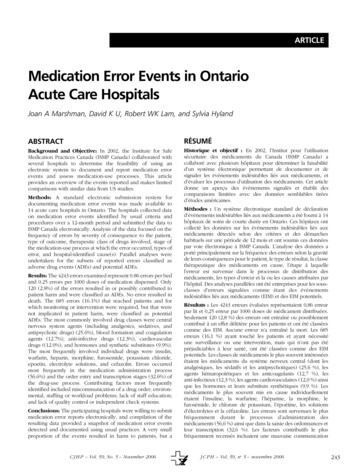
ARTICLEMedication Error Events in OntarioAcute Care HospitalsJoan A Marshman, David K U, Robert WK Lam, and Sylvia HylandABSTRACTRÉSUMÉBackground and Objective: In 2002, the Institute for SafeMedication Practices Canada (ISMP Canada) collaborated withseveral hospitals to determine the feasibility of using anelectronic system to document and report medication errorevents and assess medication-use processes. This articleprovides an overview of the events reported and makes limitedcomparisons with similar data from US studies.Historique et objectif : En 2002, l’Institut pour l’utilisationsécuritaire des médicaments du Canada (ISMP Canada) acollaboré avec plusieurs hôpitaux pour déterminer la faisabilitéd’un système électronique permettant de documenter et designaler les événements indésirables liés aux médicaments, etd’évaluer les processus d’utilisation des médicaments. Cet articledonne un aperçu des événements signalés et établit descomparaisons limitées avec des données semblables tiréesd’études américaines.Methods: A standard electronic submission system fordocumenting medication error events was made available to14 acute care hospitals in Ontario. The hospitals collected dataon medication error events identified by usual criteria andprocedures over a 12-month period and submitted the data toISMP Canada electronically. Analysis of the data focused on thefrequency of errors by severity of consequence to the patient,type of outcome, therapeutic class of drugs involved, stage ofthe medication-use process at which the error occurred, types oferror, and hospital-identified cause(s). Parallel analyses wereundertaken for the subsets of reported errors classified asadverse drug events (ADEs) and potential ADEs.Results: The 4243 errors examined represent 0.86 errors per bedand 0.25 errors per 1000 doses of medication dispensed. Only120 (2.8%) of the errors resulted in or possibly contributed topatient harm and were classified as ADEs. No error resulted indeath. The 685 errors (16.1%) that reached patients and forwhich monitoring or intervention were required, but that werenot implicated in patient harm, were classified as potentialADEs. The most commonly involved drug classes were centralnervous system agents (including analgesics, sedatives, andantipsychotic drugs) (25.6%), blood formation and coagulationagents (12.7%), anti-infective drugs (12.3%), cardiovasculardrugs ((12.0%), and hormones and synthetic substitutes (9.9%).The most frequently involved individual drugs were insulin,warfarin, heparin, morphine, furosemide, potassium chloride,epoetin, electrolyte solutions, and cefazolin. Errors occurredmost frequently in the medication administration process(56.6%) and the order entry and transcription stages (32.6%) ofthe drug-use process. Contributing factors most frequentlyidentified included miscommunication of a drug order; environmental, staffing or workload problems; lack of staff education;and lack of quality control or independent check systems.Conclusions: The participating hospitals were willing to submitmedication error reports electronically, and compilation of theresulting data provided a snapshot of medication error eventsdetected and documented using usual practices. A very smallproportion of the events resulted in harm to patients, but aC J H P – Vol. 59, No. 5 – November 2006Méthodes : Un système électronique standard de déclarationd’événements indésirables liés aux médicaments a été fourni à 14hôpitaux de soins de courte durée en Ontario. Ces hôpitaux ontcollecté les données sur les événements indésirables liés auxmédicaments détectés selon des critères et des démarcheshabituels sur une période de 12 mois et ont soumis ces donnéespar voie électronique à ISMP Canada. L’analyse des données aporté principalement sur la fréquence des erreurs selon la gravitéde leurs conséquences pour le patient, le type de résultat, la classethérapeutique des médicaments en cause, l’étape à laquellel’erreur est survenue dans le processus de distribution desmédicaments, les types d’erreur et la ou les causes attribuées parl’hôpital. Des analyses parallèles ont été entreprises pour les sousclasses d’erreurs signalées comme étant des événementsindésirables liés aux médicaments (EIM) et des EIM potentiels.Résultats : Les 4243 erreurs évaluées représentaient 0,86 erreurpar lit et 0,25 erreur par 1000 doses de médicament distribuées.Seulement 120 (2,8 %) des erreurs ont entraîné ou possiblementcontribué à un effet délétère pour les patients et ont été classéescomme des EIM. Aucune erreur n’a entraîné la mort. Les 685erreurs (16,1 %) ayant touché les patients et ayant nécessitéune surveillance ou une intervention, mais qui n’ont pas étépréjudiciables à leur santé, ont été classées comme des EIMpotentiels. Les classes de médicaments le plus souvent intéresséesétaient les médicaments du système nerveux central (dont lesanalgésiques, les sédatifs et les antipsychotiques) (25,6 %), lesagents hématopoïétiques et les anticoagulants (12,7 %), lesanti-infectieux (12,3 %), les agents cardiovasculaires (12,0 %) ainsique les hormones et leurs substituts synthétiques (9,9 %). Lesmédicaments le plus souvent mis en cause individuellementétaient l’insuline, la warfarine, l’héparine, la morphine, lefurosémide, le chlorure de potassium, l’époétine, les solutionsd’électrolytes et la céfazoline. Les erreurs sont survenues le plusfréquemment durant le processus d’administration desmédicaments (56,6 %) ainsi que dans la saisie des ordonnances etleur transcription (32,6 %). Les facteurs contributifs le plusfréquemment recensés incluaient une mauvaise communicationJ C P H – Vol. 59, no 5 – novembre 2006243
larger proportion had the potential to cause harm, and patientmonitoring or intervention was required to prevent injury.Strategies for reducing the incidence of medication errors mustrecognize the contribution of both human and system factors toerror events.Key words: medication errors, hospital errors, patient safety,voluntary reportingCan J Hosp Pharm 2006;59:243-50INTRODUCTIONMedication errors, which are monitored as acomponent of hospitals’ quality-of-care programs,were the focus of increased attention in the 1990s.1-4With the release of the US Institute of Medicine reportCrossing the Chasm: A New Health System for the 21stCentury,5 prevention of medication errors became anintegral part of broadened and intensified patient safetyinitiatives. In Canada, a workshop cohosted in 2000 bythe Canadian Society of Hospital Pharmacists and HealthCanada stimulated development of the Canadian Coalition on Medication Incident Reporting and Prevention,which in turn spearheaded development of a proposalfor the Canadian Medication Incident Reporting and Prevention System. In 2002, the report of the National Steering Committee on Patient Safety, Building a Safer System—A National Integrated Strategy for ImprovingPatient Safety in Canadian Health Care,6 recommendedadoption of nonpunitive reporting policies and thetracking of patient safety data. The importance of understanding and reducing medication errors in hospitals hasalso been emphasized by many Canadian researchers.7-12Various strategies have been used to detect anddocument medication errors in hospitals. Methods usedin previous research have included direct observation13;review of medical records, medication orders, and/ormedication administration records1,14; solicitation ofreports from staff (“stimulated self-reporting”) linkedwith records review2,14,15; and computer monitoring.16However, voluntary reporting programs for errors aregarnering more attention10 because they offer theprospect of sustainability. Voluntary reporting is consistent244C J H P – Vol. 59, No. 5 – November 2006de l’ordonnance; des problèmes d’environnement, de personnelou de charge de travail; un manque de formation du personnel;et un manque de contrôle de la qualité ou l’absence de systèmesde vérification indépendante.Conclusions : Les hôpitaux participants étaient disposés àsoumettre des rapports d’erreurs de médication par voieélectronique, et la compilation des données obtenues a permisde dresser un portrait des événements indésirables liés auxmédicaments détectés et documentés au moyen des méthodeshabituelles. Une très faible proportion des événements ontentraîné un effet délétère pour les patients, mais une plus grandeproportion des événements avaient un potentiel délétère et ontnécessité une surveillance ou une intervention afin d’éviter toutelésion. Les stratégies visant à diminuer les erreurs de médicationdoivent tenir compte des facteurs liés aux humains et auxsystèmes qui contribuent à leur survenue.Mots clés : erreurs de médication, erreurs durant l’hospitalisation,déclaration volontairewith the recent paradigm shift in patient safety, awayfrom a punitive focus on individual health careproviders and toward an institutional culture of safety,with a focus on systems factors that affect the manner inwhich providers function. Several national voluntaryreporting systems for medication errors operate in theUnited States17,18 and the United Kingdom.19In 2002, the Institute for Safe Medication PracticesCanada (ISMP Canada), an independent not-for-profitorganization, made its newly developed Analyze-ERRversion 1 software package20 available to a sample ofacute care hospitals in Ontario as part of a researchproject. This software package allows systematicdocumentation of medication errors* in health caresettings, and facilitates compilation and analysis of suchreports. The goal of the project was to assess thefeasibility for hospitals of using the software todocument medication error events detected by thehospitals’ usual criteria and procedures, voluntarilyreporting those errors electronically to an independentbody for shared learning, and assessing medication-useprocesses with a focus on patient safety. At a multicentrelevel, the compiled reports provided a first opportunityto examine the similarities and differences in profiles ofvoluntarily reported medication incidents betweenCanadian hospitals and those in the United States, wheredifferences in prescribing practices, hospitals’ incidentreporting systems, staffing practices, and medication*Increasingly the term “medication incident” is replacing the traditionalterm “medication error” in reference to a preventable potential or actualadverse drug event; however, the latter term has been retained in thisreport because it is the term used in the Analyze-ERR software.J C P H – Vol. 59, no 5 – novembre 2006
delivery technologies might affect the relevance of errorreports for Canadian health care.This report provides a descriptive overview of themedication error events identified and documented byparticipating hospitals and reported voluntarily in astandard format to ISMP Canada. Secondarily, the reportalso examines subsets of events characterized as adversedrug events2 (ADEs) and potential ADEs and makescomparisons with the results of selected US reports.METHODSThe Analyze-ERR software presents the user with aneasy-to-follow record format that can be completedlargely through the use of drop-down menus. The datafields include outcome or endpoint category of theerror, based on selected features of the taxonomy ofmedication errors of the US National CoordinatingCouncil for Medication Error Reporting and Prevention21;the type(s) of drug involved; the stage of the medicationuse process at which the error occurred; the type oferror; and the causal factors perceived by the reportingindividual to have contributed to the error event.Definitions of the report fields, menu options, andinstructions for use are provided in the software manual.20Some fields are mandatory, and electronic transmissionto ISMP Canada was prevented if a report lackedinformation for any mandatory field.Participating hospitals were recruited by broadcast email to the chief executive officers of all memberhospitals of the Ontario Hospital Association and a noticeposted on the ISMP Canada Web site.22 Anyhospital that volunteered, possessed an interdisciplinaryteam of health care professionals available to participatein the study’s self-assessment survey,23 and agreed to offerstaff members training on use of the softwareprogram was included. Of the 34 hospitals that volunteered, 17 were randomly selected to use the error analysis software within their organizations, according tostratification based on medication safety self-assessmentscores and blocks based on regional location.† Of the 17study hospitals, 14 agreed to submit reports electronicallyto ISMP Canada. The hospitals were instructed to usetheir usual processes for identifying, documenting, andinternally reporting medication errors during the studyperiod. The hospital-selected staff members usuallyresponsible for collecting event reports, typically pharmacists†The 34 volunteer hospitals were divided into intervention (i.e., softwareuse) and non-intervention groups for a broader study of hospitalmedication-use processes with a focus on patient safety. The results ofthat broader study have not yet been reported.C J H P – Vol. 59, No. 5 – November 2006but also risk managers in some cases, were trained toenter the reports into the electronic database according tothe existing taxonomy of medication errors.21 Each hospitalwas asked to designate one person to transmit thesereports in batch mode to ISMP Canada. All reportstransmitted to ISMP Canada were encrypted automatically,and information elements that might identify the reportinghospital or the patient were removed. Reports weresubsequently downloaded from the ISMP Canada Webserver to a secured central database, which served as thedata source for this report. The database was checked toidentify and eliminate duplicate reports (on the basis ofevent date and characteristics).Analysis of the resulting database, using theAnalyze-ERR software program and Microsoft Access 97,was based on the information domains and menuoptions provided to users, was guided by the goal ofproviding information that was thought to be informative to Canadian hospital personnel, and permits limitedcomparisons with US data. Errors that resulted in or possibly contributed to patient harm (categories E throughI in Table 1) were classified as ADEs. Errors that reachedthe patient and for which monitoring or interventionwas required, but that were not implicated in patientharm (category D in Table 1), were classified aspotential ADEs. The results of the analysis are expressedas frequencies and proportions of all reported events orspecific types of events.Approval for this project was obtained from theUniversity of Toronto Health Sciences Research EthicsBoard and from the ethics review boards of participating hospitals as required.RESULTSA total of 4243 medication error reports weretransmitted to ISMP Canada during the period May 2002to June 2003. Although each individual hospital reportederrors for a 12-month period, the start-up times werestaggered, and the time elapsed from first to last reportwas therefore 14 months. The participating hospitals, incommunities ranging in size from towns to metropolitancentres, had a total of 4938 beds and included 5 teachinghospitals, 6 community hospitals with fewer than 200beds, and 3 community hospitals with 200 beds ormore. There were approximately 241 000 admissions tothe study hospitals during the staggered 12-monthreporting periods, and roughly 16.8 million medicationdoses were dispensed. The majority of errors weredetected by nursing personnel (76.1%), with smallerproportions detected by pharmacy personnel (20.6%),physicians (1.3%), and patients (0.5%).J C P H – Vol. 59, no 5 – novembre 2006245
Table 1. Frequency of Error Events by Type of Outcome (Endpoint)EndpointNo. (%)A. Circumstances or events with the capacity to cause error410*B. An error or omission occurred but did not reach the patient.1203(28.4)C. An error occurred that did reach the patient but did not cause the patient harm.2205(52.0)D. An error occurred that reached the patient and required monitoring to confirmthat it resulted in no harm and/or required intervention to preclude harm.685(16.1)E. An error occurred that may have contributed to or resulted in temporary harmto the patient and required intervention.97(2.3)F. An error occurred that may have contributed to or resulted in temporary harmto the patient and required initial or prolonged hospitalization.20(0.5)G. An error occurred that may have contributed to or resulted in permanent harmto the patient.1( 0.1)H. An error occurred that required intervention necessary to sustain life.2( 0.1)I. An error occurred that may have contributed to or resulted in the patient's death.0(0)Outcome was not specified.30(0.7)Total4243100*This endpoint represents hazardous situations, rather than errors, and these events were not included in the totalnumber of error events.Only 120 (2.8%) of the reported error events(categories E through I in Table 1) were classified asADEs, and none of these events resulted in death. Ofthe remainder, 685 (16.1% of the total) (category D inTable 1) reached the patient and were classified aspotential ADEs.The predominant types of medication administrationerror that were reported (Table 4) were dose omissionand ordering or administration of an improper dose.The only other type of error accounting for more than10% of errors was ordering or administration of thewrong drug.Most Frequently Reported Drug ClassesUnderlying Causes of ErrorsThe therapeutic classes of drugs most frequentlyinvolved in reported events, as well as in the ADE andpotential ADE subsets, were central nervous systemagents (including analgesics, sedatives, and antipsychoticagents), blood formation and coagulation agents, antiinfective agents, cardiovascular drugs, and hormonesand synthetic substitutes (Table 2). Collectively, thesedrug classes were involved in more than two-thirds ofall reported events. Of the 16 events involving diagnostic agents (American Hospital Formulary Service code36), 11 were ADEs. Individual drugs most frequentlyinvolved were insulin (n 188), warfarin (n 173),heparin (n 138), morphine (n 132), furosemide(n 98), potassium chloride (n 95), epoetin (n 70),electrolyte solutions (n 69), and cefazolin (n 68).The reporting rate for underlying causes wasconsiderably lower than that for other data fields (Table5). Overall, the most frequently reported cause of errorswas miscommunication of the drug order. Other causesidentified in 10% or more of cause-specified errorreports included working environment, staffing, orworkflow problems; lack of staff education; and lack ofquality control or independent check systems. Problemswith drug name, labelling, or packaging accounted forslightly less than 10% of errors. However, events involvingan infusion device presented a markedly different causalprofile: a problem with the technology for drug deliverywas cited in 23 (64%) of 36 reports.Stages of the Medication-Use ProcessMore than half of the reported errors occurred at themedication administration stage (Table 3), with lowerfrequencies for errors in the categories of order entry andtranscription (i.e., order entry by the pharmacy andtranscription to the medication administration record) anddispensing and delivery. Errors involving physician orderingand monitoring were reported much less frequently.246C J H P – Vol. 59, No. 5 – November 2006DISCUSSIONThe reporting of medication errors is essential forassessing quality of care and identifying opportunities toenhance medication-related patient safety. In this study,the overall rates of hospital-reported medication errorsduring staggered 12-month reporting periods were 0.86per bed, 1.76 per 100 admissions, and 0.25 per 1000doses of medication dispensed. Only 2.8% of the reportedevents were perceived as possibly contributing topatient harm (either temporary or permanent) andJ C P H – Vol. 59, no 5 – novembre 2006
Table 2. Therapeutic Classes of Drugs Most Frequently Identified in Error Event ReportsType of Event; No. (%) of Events*Reported ErrorPotential ADEsADEsEvents (n 4243)(n 685)(n 120)Central nervous system drugs (28)1085 (25.6)151 (22.0)24 (20.0)Blood formation/coagulation agents (20)537 (12.7)123 (18.0)12 (10.0)Anti-infectives (08)522 (12.3)82 (12.0)17 (14.2)Cardiovascular drugs (24)510 (12.0)79 (11.5)21 (17.5)Hormones and synthetic substitutes (68)422 (9.9)111 (16.2)14 (11.7)Vitamins (88)274 (6.5)52 (7.6)11 (9.2)Gastrointestinal drugs (56)274 (6.5)31 (4.5)4 (3.3)Electrolytes, caloric, and water balance agents (40)235 (5.5)41 (6.0)10 (8.3)Autonomic drugs (12)136 (3.2)22 (3.2)2 (1.7)Other511 (12.0)61 (8.9)21 (17.5)AHFS American Hospital Formulary Service, ADE adverse drug event.*A single event may involve multiple drugs; therefore, the numbers of events for various drugs do not sumto the n value in the corresponding column heading.Therapeutic Class of Drug (AHFS Code)Table 3. Frequency of Errors by Stage of Medication-Use ProcessStage of Medication-Use ProcessType of Event; No. (%) of Events*Reported ErrorPotential ADEsADEsEvents (n 4243)(n 685)(n 120)2396 (56.6)559 (81.6)87 (72.5)1383 (32.6)95 (13.9)30 (25.0)771 (18.2)75 (10.9)8 (6.7)297 (7.0)35 (5.1)14 (11.7)167 (3.9)51 (7.4)10 (8.3)Administration of medicationOrder entry and transcriptionDispensing and deliveryPhysician orderingMonitoringADE adverse drug event.*A single event may involve errors at more than one stage.Table 4. Types of Process ErrorType of ErrorType of Event; No. (%) of Events*Reported ErrorPotential ADEsADEsEvents (n 4243)(n 685)(n 120)1216 (28.7)197 (28.8)41 (34.2)1092 (25.7)216 (31.5)37 (30.8)438 (10.3)86 (12.6)8 (6.7)240 (5.7)31 (4.5)2 (1.7)132 (3.1)25 (3.6)1 (0.8)129 (3.0)29 (4.2)2 (1.7)106 (2.5)22 (3.2)6 (5.0)67 (1.6)20 (2.9)4 (3.3)58 (1.4)4 (0.6)1 (0.8)55 (1.3)11 (1.6)1 (0.8)33 (0.8)3 (0.4)0 (0)16 (0.4)3 (0.4)0 (0)12 (0.3)4 (0.6)2 (1.7)649 (15.3)34 (5.0)15 (12.5)Dose omissionImproper doseWrong drugWrong timeWrong strength or concentrationWrong patientWrong rateMonitoring errorWrong dosage formWrong route of administrationWrong durationDeteriorated drug errorWrong techniqueOtherADE adverse drug event.* Percentages may not sum to 100 because of rounding.C J H P – Vol. 59, No. 5 – November 2006J C P H – Vol. 59, no 5 – novembre 2006247
Table 5. Underlying Causes* of ErrorsType of Event; No. (%) of Events‡All ReportedPotential ADEsADEsEvents (n 1796)(n 198)(n 61)Miscommunication of drug order693 (38.6)63 (31.8)23 (37.7)Environmental, staffing, or workflow problem394 (21.9)56 (28.3)17 (27.9)Lack of staff education343 (19.1)54 (27.3)15 (24.6)Lack of quality control or independent check systems 211 (11.7)33 (16.7)5 (8.2)Drug name, label, or packaging problem174 (9.7)18 (9.1)4 (6.6)Drug storage or delivery problem146 (8.1)12 (6.1)5 (8.2)Critical patient information missing90 (5.0)10 (5.1)2 (3.3)Drug delivery device problem64 (3.6)9 (4.5)5 (8.2)Patient education problem31 (1.7)13 (6.6)2 (3.3)Critical drug information missing30 (1.7)4 (2.0)1 (1.6)ADE adverse drug event.*As defined by Leape and others,3 page 37.†A single event may have multiple causes.‡Underlying cause was not reported for all error events. Therefore, the sample sizes for reports of underlyingcauses (total, potential ADEs, and ADEs) are smaller than the total numbers of reported error events.Underlying Cause†requiring monitoring and/or intervention (i.e., ADEs),and none of these events resulted in patient death.However, monitoring or intervention was instituted fora further 16.1% of errors (potential ADEs). More thanone-quarter of all reported error events (28.4%) wereidentified before they reached the patient. Most reportedevents involved commonly used medications.Errors occurred most frequently in the administrationand order entry or transcription stages of medication use.The most common types of error were omission of a doseand ordering or administration of an improper dose orthe wrong drug. The higher frequency of administrationerrors was expected because multiple administrationsoften flow from a single medication order or dispensingevent. Also, as noted by Hicks and others,24 “[as] medications. . . get closer to the patient, there is less opportunity tointercept and avert an error.” Five types of underlyingfactors dominated the reports: miscommunication of drugorders; environmental, staffing, or workflow problems;lack of staff education; lack of quality control or independent check systems; and problems with drug name,labelling, or packaging. In contrast, in events involvingan infusion device, problems with drug delivery technology predominated. Although the relative frequencies ofthese causes must be interpreted with caution (becauseof the low reporting rate and biases inherent in themethods), it is clear that multiple factors, both human andsystem, are perceived as contributors.The results of the current study showed bothsimilarities and differences in comparison with keymultihospital studies of medication errors from theUnited States, although the validity of these comparisons248C J H P – Vol. 59, No. 5 – November 2006is limited by differences in the methods used to detectand classify events and in the criteria for exclusion oferror data. The current study assessed errors that werereported voluntarily, and all error events identified anddocumented by the hospitals’ usual criteria and procedureswere included in the analysis. In these respects thestudy process was similar to the Medication ErrorReporting Program (sponsored by the Institute forSafe Medication Practices [US] and the United StatesPharmacopoeia) and the MEDMARX Program(sponsored by the United States Pharmacopoeia). Incontrast, in the study by the Adverse Drug Event PreventionStudy Group,2,3 error reports were solicited from staff,patient records were reviewed systematically to detectreportable events, and event reports were evaluatedindependently by physician reviewers, who excludederrors for which the potential for injury was judged tobe minimal. Not surprisingly, that study’s “active” seekingof errors resulted in a higher overall rate of error reportsthan in the present study (7.3 per 100 admissions and1.76 per 100 admissions, respectively) despite the exclusionof events deemed to have minimal potential for injury.Among the apparent similarities between the currentstudy and the MEDMARX analysis of 2002 error events24are the proportion of error events perceived as (possibly)contributing to patient harm (either temporary orpermanent) (2.8% and 1.98%, respectively). However, ahigher proportion of the errors reported in the currentstudy required monitoring and/or intervention (16.1%and 7.5%, respectively).In both the present study and that of the AdverseDrug Event Prevention Study Group2,3 reported errorsJ C P H – Vol. 59, no 5 – novembre 2006
frequently involved central nervous system drugs(analgesics, sedatives, and antipsychotic drugs),anti-infective agents, and cardiovascular drugs. Furthermore, in both the current study and the MEDMARXprogram,24 the 10 most frequently reported drugs includedinsulin, morphine, heparin, warfarin, cefazolin,furosemide, and potassium chloride, the first 4 of whichhave been flagged by MEDMARX as “high-alert”medications. A further similarity to the findings ofMEDMARX24 and others13 is the relatively high frequencyof errors in the categories of dose omission and wrongdose. A notable difference between the current studyand some key US studies is the much lower proportionof reported errors in physician prescribing: 5.9% of allerrors and 9.4% of errors (possibly) causing patientharm in the current study, compared with 56% ofpreventable ADEs reported by Bates and others2 and21% of all errors in the MEDMARX study.24 Thesedifferences may reflect different interpretations ofclassification criteria, differences in orientation of reportingpersonnel (process or outcomes), and/or inadequatecapture of errors at the physician ordering stage in thecurrent study.This study reflects existing error detection andinternal reporting practices of a convenience sample ofOntario hospitals with an interest in using a newsoftware package to systematically document medicationerror events. Undoubtedly, recruitment of volunteerhospitals biased the participant group in favour ofinstitutions with an active interest in improving theirmedication error detection, reporting, and analysiscapabilities, and openness to anonymously sharingevent reports with a neutral third party. However,rendering error event reports anonymous precludesdetermination of between-hospital variability in reportingrates based on number of admissions, patient days ofcare, or doses of medication dispensed. Spontaneous,informal feedback from participating hospitals indicatedthat the software was particularly beneficial to thoseinstitutions that had previously used paper-basedsystems; however, feedback was not systematicallycollected from all participating hospitals. Because theerror event data were reported voluntarily, theircompleteness and validity were limited by thecompleteness of hospitals’ internal event reports, theirtransformation to Analyze-ERR-based submissions, andany hospital policies that might have constrained thereporting of errors to a third party. The study designincluded 2 features to maximize validity and completeness:first, hospitals were provided with the software andemployees were trained in its use; second, the reportingC J H P – Vol. 59, No. 5 – November 2006system protected the anonymity of hospitals by strippingreports of any information identifying hospital or patient.Because these results are based on a small sample ofvolunteer hospitals, and because they represent eventsdetected by hospitals’ usual criteria and procedures,they cannot be used to estimate the total number ofpatients harmed by medication errors in Ontario hospitals.Furthermore, the 685 errors classified as potent
review of medical records, medication orders, and/or medication administration records1,14; solicitation of reports from staff ("stimulated self-reporting") linked with records review2,14,15; and computer monitoring.16 However, voluntary reporting programs for errors are garnering more attention10 because they offer the prospect of .
