Transcription
P.S./EARTH SCIENCEThe University of the State of New YorkREGENTS HIGH SCHOOL EXAMINATIONPHYSICAL SETTINGEARTH SCIENCEFriday, January 24, 2020 — 9:15 a.m. to 12:15 p.m., onlyThe possession or use of any communications device is strictly prohibited when takingthis examination. If you have or use any communications device, no matter how briefly, yourexamination will be invalidated and no score will be calculated for you.Use your knowledge of Earth science to answer all questions in this examination.Before you begin this examination, you must be provided with the 2011 EditionReference Tables for Physical Setting/Earth Science. You will need these referencetables to answer some of the questions.You are to answer all questions in all parts of this examination. You may use scrappaper to work out the answers to the questions, but be sure to record your answerson your answer sheet and in your answer booklet. A separate answer sheet for Part Aand Part B–1 has been provided to you. Follow the instructions from the proctor forcompleting the student information on your answer sheet. Record your answers to thePart A and Part B–1 multiple-choice questions on this separate answer sheet. Recordyour answers for the questions in Part B–2 and Part C in your separate answer booklet.Be sure to fill in the heading on the front of your answer booklet.All answers in your answer booklet should be written in pen, except for graphs anddrawings, which should be done in pencil.When you have completed the examination, you must sign the declaration printedon your separate answer sheet, indicating that you had no unlawful knowledge of thequestions or answers prior to the examination and that you have neither given norreceived assistance in answering any of the questions during the examination. Youranswer sheet and answer booklet cannot be accepted if you fail to sign this declaration.Notice A four-function or scientific calculator and a copy of the 2011 Edition Reference Tables forPhysical Setting/Earth Science must be available for you to use while taking this examination.DO NOT OPEN THIS EXAMINATION BOOKLET UNTIL THE SIGNAL IS GIVEN.P.S./EARTH SCIENCE
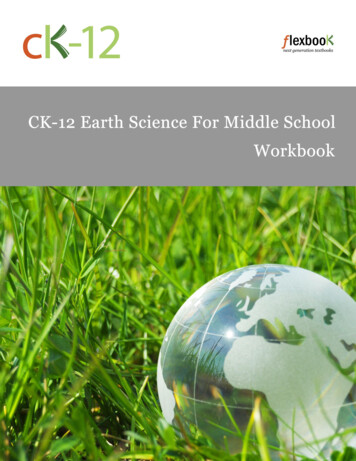
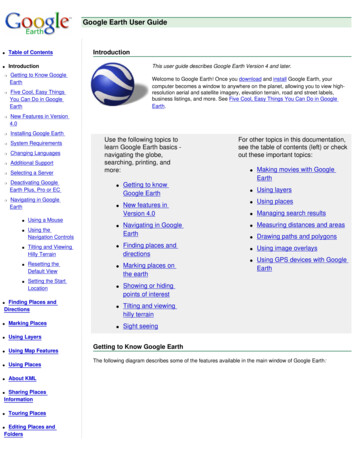
Part AAnswer all questions in this part.Directions (1–35): For each statement or question, choose the word or expression that, of those given, bestcompletes the statement or answers the question. Some questions may require the use of the 2011 EditionReference Tables for Physical Setting/Earth Science. Record your answers on your separate answer sheet.5 The diagram below represents the location ofgyres in the Pacific Ocean. A gyre is a circularpattern of flowing ocean currents.1 What are two pieces of evidence that support theBig Bang Theory?(1) red shift of light and cosmic backgroundradiation(2) red shift of light and the different shapes ofgalaxies(3) planetary motion and cosmic backgroundradiation(4) planetary motion and the different shapes ofgalaxiesGyreEquator2 The diagram below compares the relativediameters of two planets in our solar system.Planet Earth, Understanding Science and Nature, Time Life Inc.Which two planets have diameters that mostclosely resemble this comparison?(1) Uranus and Neptune(2) Jupiter and Saturn(3) Earth and Mars(4) Mercury and VenusThe clockwise direction of flow of thesecurrents in the Northern Hemisphere, andthe counterclockwise direction of flow in theSouthern Hemisphere are the result of(1) the Coriolis effect(2) the Doppler effect(3) Earth’s magnetism(4) the Moon’s magnetism3 The motion of a Foucault pendulum providesevidence that Earth(1) varies in distance from the Sun(2) spins on its axis(3) is tilted on its axis(4) travels around the Sun6 Which changes in surface water movement arelikely to occur when vegetation is removed fromthe side of a hill?(1) infiltration decreases and runoff decreases(2) infiltration decreases and runoff increases(3) infiltration increases and runoff decreases(4) infiltration increases and runoff increases4 Which factor is a primary cause of seasonalchanges on Earth?(1) change in Earth’s distance from the Sun(2) change in the rate of Earth’s rotation(3) wobble of Earth’s axis(4) tilt of Earth’s axisP.S./E. Sci.–Jan. ’207 During which phase change will two grams ofwater release 668 joules of heat energy?(1) melting(3) vaporization(2) freezing(4) condensation[2]
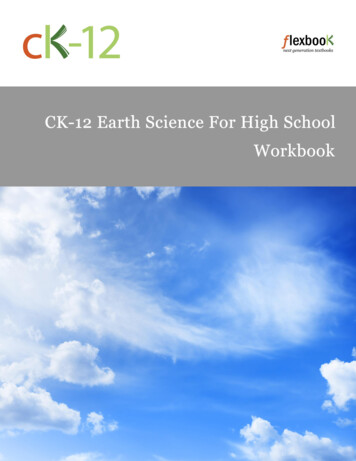
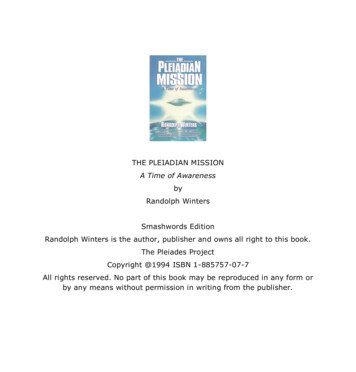
8 The chart below describes some components of the solar system.ObjectDescriptionXchunk of rock and ice orbiting from the outer solarsystem to near the SunYstreak of light seen when a space rock entersEarth’s atmosphere and starts burning upZrocky/metallic object orbiting the Sun betweenMars and JupiterLetters X, Y, and Z identify which components of our solar system?(1) X asteroid;Y meteor;Z comet(2) X asteroid;Y meteor;Z moon(3) X comet;Y meteor;Z asteroid(4) X comet;Y moon;Z meteor9 The time-exposure photograph shown below was taken by an observer in the Northern Hemisphere torecord the apparent paths of stars.http://dianajuncher.dk/The name of the bright star near the center that the other stars appear to be circling is(1) Polaris(3) Betelgeuse(2) Alpha Centauri(4) DenebP.S./E. Sci.–Jan. ’20[3][OVER]
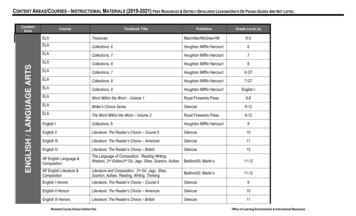
13 The map below shows two locations, labeledA and B, separated by a mountain range. Thelocations are at the same elevation. The arrowrepresents the direction of prevailing winds.10 The map below shows the average annualsnowfall, in inches, for western New York State.Average Season Snowfall in InchesOceanLake Ontario60A B10080100Key80Mountains60150Lake Erie100Compared to the climate at location A, theclimate at location B is most likely(1) warmer and drier(3) cooler and drier(2) warmer and wetter (4) cooler and wetter10020015010080New YorkPennsylvania14 Which important geologic event in New YorkState occurred just after the Grenville Mountainswere starting to erode?(1) Pangaea began to break up.(2) The Iapetus Ocean began to open.(3) The Catskill Delta formed.(4) The Taconic Mountains were eroded.According to the map, which of these citiesreceives the greatest average annual snowfall?(1) Buffalo(3) Niagara Falls(2) Jamestown(4) Elmira11 Which current has a warming effect on theclimate of the southeast coast of Africa?(1) Guinea Current(3) Benguela Current(2) Falkland Current(4) Agulhas Current15 Scientists infer that oxygen first began to enterEarth’s atmosphere after the appearance of(1) the earliest grasses(2) the earliest flowering plants(3) coal-forming forests(4) oceanic cyanobacteria12 Geologic history is divided into eras, periods, andepochs based on the(1) type of rock deposited at different timesthroughout history(2) half-life of radioactive isotopes found in rocks(3) inferred movements of Earth’s landmasses(4) fossil evidence found in bedrockP.S./E. Sci.–Jan. ’20N16 Which mantle hot spot is correctly matched to itsoverlying tectonic plate?(1) Tasman Hot Spot–Pacific Plate(2) Canary Island Hot Spot–Eurasian Plate(3) St. Helena Hot Spot–South American Plate(4) Yellowstone Hot Spot–North American Plate[4]
17 The weather map below shows air-pressure readings given in millibars. Points A, B, C, and D are locationson Earth’s surface.10160210 10241012AB10121008C10041000996D992At which location is surface wind speed the lowest?(1) A(3) C(2) B(4) D18 The diagram below shows a weather instrument used to determine relative humidity.200Wet bulb401030What is the relative humidity?(1) 40%(2) 36%P.S./E. Sci.–Jan. ’2050200Dry bulb C401030 C50(3) 8%(4) 4%[5][OVER]
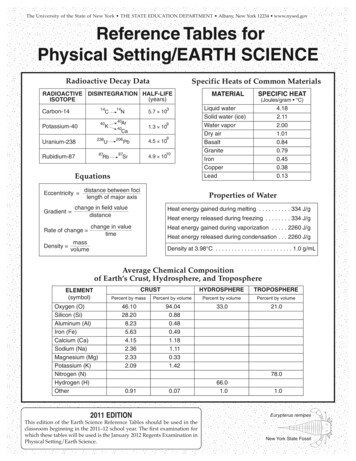
19 The diagram below shows the locations of the two major jet streams in Earth’s atmosphere.Subtropical jet streamPolar front jet streamTropopauseNorth Pole60 N30 NEquatorLatitude ( N)Compared to the subtropical jet stream, the polar front jet stream is at a(1) lower latitude and lower altitude(3) higher latitude and lower altitude(2) lower latitude and higher altitude(4) higher latitude and higher altitudeAverage Global AirTemperature Change (C )20 The graph below shows the average global temperature changes before and after Mount Pinatubo’s eruptionin the Philippines. Sulfur from volcanic eruptions, like Mount Pinatubo’s, forms sulfuric acid particles in theupper atmosphere. 0.4 0.3 0.2 0.10– 0.1– 0.2– 0.3– 0.4– 0.5MountPinatuboerupts19901991(normal)1992Adapted from: Aherns, C. Donald, Essentialsof Meteorology: An Invitation to the AtmosphereAccording to the graph, these atmospheric particles appear to have caused global air temperatures to(1) generally decrease for one year(2) decrease, but then increase to normal levels in one year(3) generally increase for one year(4) increase, but then decrease to normal levels in one yearP.S./E. Sci.–Jan. ’20[6]
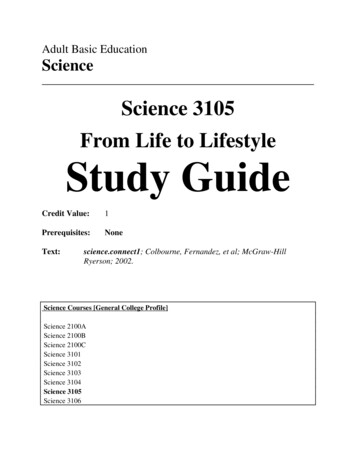
21 The map below shows the location of the Chicxulub crater, which was formed when a massive asteroidimpacted Earth 65.5 million years ago.UNITED STATESGulf of MexicoChicxulubCraterMEXICOScientists infer that this impact contributed to the extinction of(1) trilobites(3) many land plants(2) gastropods(4) placoderm fish22 The cross section below represents the boundaries of the Pacific Plate, the Juan de Fuca Plate, and theNorth American Plate. The numbers show the age of the sea floor, in millions of years, at locations on thePacific Plate. Letter X represents a location on the ocean floor surface.North American PlatePacificPlate1210864Juan deFuca Plate2XAdapted from: http://mountainculturegroup.com/What is the most probable age of the ocean floor at location X, if the Pacific Plate and the Juan de Fuca Plateare moving at the same rate?(1) 10 million years(3) 6 million years(2) 8 million years(4) 4 million yearsP.S./E. Sci.–Jan. ’20[7][OVER]
25 Why are P-waves received, but S-waves arenot received by seismic stations located onthe opposite side of Earth from an earthquakeepicenter?(1) S-waves travel slower than P-waves.(2) S-waves travel faster than P-waves.(3) Earth’s inner core absorbs S-waves.(4) Earth’s outer core absorbs S-waves.23 A cross section of Earth’s crust is representedbelow. Index fossils are present in some of therock layers.26 The Tug Hill region of New York State isgeologically classified as a plateau because thisregion has relatively(1) high elevation and deformed bedrock(2) low elevation and deformed bedrock(3) high elevation and horizontal bedrock(4) low elevation and horizontal bedrockThese rock layers indicate evidence of pastcrustal movement based on the principle of(1) down-warping(2) crosscutting(3) original horizontality(4) contact metamorphism27 What is the approximate minimum streamvelocity required to transport the smallestparticles of sand?(1) 1.0 cm/s(3) 0.3 cm/s(2) 0.7 cm/s(4) 0.1 cm/s24 The map below shows the continent of Australia.Letters A and B indicate locations on Earth’scrustal surface.28 Which agent of erosion is primarily responsiblefor the formation of the barrier islands along thesouth shoreline of Long Island, New York?(1) wave action(3) glacial ice(2) wind(4) mass movement29 A glacial moraine is best described as(1) unsorted sediment directly deposited by aglacier(2) sorted sediment deposited as the glaciermelts(3) a body of water formed by a retreating glacier(4) an elongated hill composed of sand andformed by a retreating glacierAustraliaABOceanCompared to the crust at A, the crust at B is(1) thinner and less dense(2) thinner and more dense(3) thicker and less dense(4) thicker and more denseP.S./E. Sci.–Jan. ’2030 Which medium-grain-sized metamorphic rockis composed mostly of the same mineral as thesedimentary rock limestone?(1) gneiss(3) quartzite(2) marble(4) schist[8]
31 Which diagram below best represents the surface features developed in a humid climate?(1)(3)(2)(4)32 The block diagram below represents a section of a meandering stream. The arrows show the direction ofstream flow.MeanderThe streambank on the outside of this meander is steeper than the streambank on the inside of this meanderbecause the water on the outside of this meander is moving(1) slower, causing more deposition(3) faster, causing more deposition(2) slower, causing more erosion(4) faster, causing more erosion33 What is the texture of an igneous rock formed from magma that cooled slowly deep underground?(1) nonvesicular and coarse(3) vesicular and fine(2) nonvesicular and glassy(4) vesicular and very coarseP.S./E. Sci.–Jan. ’20[9][OVER]
34 The photograph below shows a portion of a roadway in the mountains that was destroyed due to a landslide.http://fijisun.com.fjWhich two factors most likely caused this landslide?(1) wind action and meandering streams(3) gravity and sand blasting of bedrock(2) wind action and movement of glacial ice(4) gravity and saturated soil35 The two photographs below and the arrow between them show conglomerate and the processes that changedthe conglomerate to rock X.HeatandpressureConglomerateRock X is most likely(1) breccia(2) slateP.S./E. Sci.–Jan. ’20Rock X(3) metaconglomerate(4) vesicular basalt[10]
Part B–1Answer all questions in this part.Directions (36–50): For each statement or question, choose the word or expression that, of those given,best completes the statement or answers the question. Some questions may require the use of the 2011 EditionReference Tables for Physical Setting/Earth Science. Record your answers on your separate answer sheet.Base your answers to questions 36 through 38 on the passage and mineral table below and on your knowledgeof Earth science. The table shows some properties of four minerals that display fluorescence.Fluorescent MineralsAll minerals have the ability to reflect visible light. Only about 15% of minerals havean interesting physical property known as fluorescence. These minerals have the ability totemporarily absorb a small amount of electromagnetic energy and, an instant later, releasea small amount of energy of a different wavelength. This change in wavelength causesa temporary color change of the mineral in the eye of an observer. The color change offluorescent minerals is most spectacular when the minerals are placed in darkness andexposed to electromagnetic energy shorter than visible light.A former zinc mine in New Jersey is one of the most famous sources of fluorescentminerals in the entire world. Zincite and willemite were two of the zinc ores mined there.It was later discovered that more than 91 minerals in this region displayed fluorescenceunder shortwave electromagnetic energy.MineralHardnessColor Under Visible Light“Fluorescent” ColorCompositionCalcite3clear-white-variablebright orangeCaCO3Celestine3 to 3.5colorless-variableyellow and/or white/blueSrSO4Willemite5.5pink-tanbright greenZn2SiO4Zincite4yellow-orangeyellowZnO36 Which two forms of electromagnetic energy are used to produce the most spectacular fluorescence whenplaced in darkness?(1) microwaves and x rays(3) ultraviolet and x rays(2) microwaves and infrared(4) ultraviolet and infrared37 Which two minerals can have the same fluorescent color?(1) calcite and celestine(3) celestine and willemite(2) calcite and zincite(4) celestine and zincite38 The mineral zincite will scratch(1) calcite, but will not scratch celestine and willemite(2) willemite, but will not scratch calcite and celestine(3) calcite and celestine, but will not scratch willemite(4) willemite and celestine, but will not scratch calciteP.S./E. Sci.–Jan. ’20[11][OVER]
Base your answers to questions 39 and 40 on the diagram below and on your knowledge of Earth science.The diagram represents the lines of latitude and longitude on Earth. Points A through E represent locations onEarth.North Pole60 40 75 D20 60 45 15 15 30 Equator39 Which two locations have the same solar time?(1) A and B(2) B and DianC90 MeridBmeP riAE(3) C and E(4) D and E40 From which location would an observer never see Polaris in the nighttime sky?(1) A(3) C(2) B(4) DP.S./E. Sci.–Jan. ’20[12]
Base your answers to questions 41 through 43 on the diagram below and on your knowledge of Earth science.The diagram represents the inferred origin and evolution of most stars.sive starMasGas anddust cloudMain sequenceSupergiantorgiantStarformation(gases and dustcondense)SupernovaLo wmassWhite dwarf41 What causes the gas and dust cloud to condense and become a star?(1) density(3) gravity(2) friction(4) outgassing42 Which star is most likely to become a supernova?(1) Sun(3) Pollux(2) Deneb(4) Barnard’s Star43 Which process produces large amounts of energy in a star by combining lighter elements into a heavierelement?(1) convection(3) radioactive decay(2) radiation(4) nuclear fusionP.S./E. Sci.–Jan. ’20[13][OVER]
Base your answers to questions 44 and 45 on the table below and on your knowledge of Earth science. Thetable shows the disintegration products and half-lives of five commonly used radioactive isotopes.Radioactive Decay Life(years)40UURb207206879891044 Which radioactive isotope takes the greatest amount of time to disintegrate?(1) potassium-40(3) uranium-238(2) uranium-235(4) rubidium-87P.S./E. Sci.–Jan. ’20[14]
P.S./E. Sci.–Jan. 2540050K402575ArdanrA1004040Percentage of Original Mass (%)75CaPercentage of Original Mass (%)4040Percentage of Original Mass (%)10040Percentage of Original Mass (%)45 Which graph below represents the amount of potassium-40 and the amount of argon-40 and calcium-40 overfour ER]
Base your answers to questions 46 through 48 on the cross section below and on your knowledge of Earthscience. The arrows on the cross section represent the air movement along a weather front between two differentair masses. The air masses are labeled.cPmT46 Which type of front is represented by this cross section?(1) warm(3) stationary(2) cold(4) occluded47 Clouds are forming along the front because the rising air is(1) contracting and warming, causing evaporation(2) contracting and cooling, causing evaporation(3) expanding and warming, causing condensation(4) expanding and cooling, causing condensation48 Which statement best describes the difference in air temperature and humidity between the cP and mT airmasses?(1) The mT air mass is warmer and more humid.(2) The mT air mass is cooler and less humid.(3) The cP air mass is warmer and less humid.(4) The cP air mass is cooler and more humid.P.S./E. Sci.–Jan. ’20[16]
Base your answers to questions 49 and 50 on the diagram below and on your knowledge of Earth science.The diagram represents twelve positions of Earth in its orbit around the Sun and twelve constellations that canbe seen in the midnight sky by an observer looking south in New York State at different times of the year. Theapproximate locations of the constellations in relation to Earth’s orbit are ni91281Sun2Ea rth·s po37sitions in orbit6Sagittarius54CancerScorpiusLeoVirgoLibra(Not drawn to scale)49 Which motion causes observers on Earth to see different constellations at different times of the year?(1) Earth revolves around the constellations.(2) Earth revolves around the Sun.(3) The constellations revolve around Earth.(4) The constellations revolve around the Sun.50 At position 5, an observer on Earth sees a full Moon (the fully lighted side of the Moon) at midnight. At thistime, the full Moon would appear closest to the constellation(1) Aries(3) Libra(2) Capricornus(4) ScorpiusP.S./E. Sci.–Jan. ’20[17][OVER]
Part B–2Answer all questions in this part.Directions (51–65): Record your answers in the spaces provided in your answer booklet. Some questions mayrequire the use of the 2011 Edition Reference Tables for Physical Setting/Earth Science.Base your answers to questions 51 and 52 on the diagram below and on your knowledge of Earth science. Thediagram represents three containers, A, B, and C, which have the same volume and are filled to the same levelwith uniform-sized beads. The beads are held in place by a screen across the bottom of each container.ScreenA(0.10-cm diameter)ScreenScreenB(0.40-cm diameter)C(0.70-cm diameter)(Not drawn to scale)51 Draw a line on grid 1 in your answer booklet to show the general relationship between bead size andcapillarity. Draw a line on grid 2 in your answer booklet to show the general relationship between bead sizeand permeability. [1]52 Describe one way to prepare a fourth container of beads, filled to the same level as shown in A, B, and C,that would reduce porosity. [1]P.S./E. Sci.–Jan. ’20[18]
Base your answers to questions 53 and 54 on the ocean tide diagram below and on your knowledge of Earthscience. The diagram represents a north pole (NP) view of Earth and the Moon’s orbital position during a springtide. Spring tides occur when the Sun, Earth, and Moon are aligned, producing high tides that are extremely highand low tides that are extremely low. Point A indicates another position of the Moon in its orbit.Spring TideALow tideHigh tideNPSun·sraysMoon(Not drawn to scale)53 On the diagram in your answer booklet, place an X on the Moon’s orbit to indicate the Moon’s position whenthe next spring tide will occur. [1]54 On the diagram in your answer booklet, shade the portion of the Moon that is in darkness, as viewed fromNew York State, when the Moon is located at position A. [1]Base your answers to questions 55 through 57 on the map in your answer booklet and on your knowledge ofEarth science. The map shows a portion of the continent of North America and some of the major rivers. TheRio Grande and the Mississippi River are labeled. Points A and B represent locations along the Mississippi River.Point C represents a location along a river in New York State (NY) that is part of the Mississippi River watershed.55 On the map in your answer booklet, place an X on the tributary that is located farthest south and flows intothe Mississippi River. [1]56 Describe the change in shape and change in size of sediments as they are transported in the MississippiRiver from point A to point B. [1]57 Identify the name of the New York State landscape region where the river at point C is located. [1]P.S./E. Sci.–Jan. ’20[19][OVER]
Base your answers to questions 58 through 61 on the passage and graph below and on your knowledge ofEarth science. The graph shows changes in the amount of chlorofluorocarbon production, in tons per year (T/y),by some countries over a 10-year period.CFCs and OzoneCFCs (chlorofluorocarbons) are chemicals that threaten to destroy stratosphericozone. CFCs were first manufactured in 1928 to be used as chilling agents in refrigerators.In later years, they were used for cleaning electrical circuit boards and to make foamfor insulation. Unfortunately, scientists found that these chemicals escaped into theatmosphere and rose to the stratosphere. In the stratosphere, intense ultraviolet (UV)radiation broke the CFCs down, producing chlorine, a gas that reacts with and destroysozone. In 1974, two scientists identified the depletion of stratospheric ozone from therelease of CFCs. After this discovery, 27 countries agreed to reduce production of CFCs,because ozone in the stratosphere protects all life from the Sun’s most damaging UV rays.Production of Chlorofluorocarbons in Selected Countries,1986-1996350,000CFC Production in Tons (T)300,000250,000200,000United 19861988India1990199219941996YearAdapted from: Gore, Al. An Inconvenient Truth58 Write the chemical symbol for the element produced by the breakdown of CFCs. Describe one environmentalimpact that results from this element being released into Earth’s stratosphere. [1]59 Identify the name of the atmospheric temperature zones directly below and directly above the atmosphericlayer in which intense UV radiation breaks down CFCs. [1]60 Calculate the approximate rate, in tons per year (T/y), at which the United States decreased CFC productionin the 8 years between 1988 and 1996. [1]61 Based on the graph, identify the two countries that began to decrease CFC production as early as 1986. [1]P.S./E. Sci.–Jan. ’20[20]
Base your answers to questions 62 through 65 on the diagram below and on your knowledge of Earth science.The diagram represents the formation of coal and other fossil fuels in the environment.LakeAccumulation oforganic materialover millions of yearsAOilNatural gasCoalMillions of yearsBuried organic matterFossil fuels produced andstored in sedimentary rocksCBCO2 emissionCO2 emissionCollecting and burningfossil fuelsDAdapted from: Wright, Richard and Nebel, Bernard. EnvironmentalScience, Learning System Edition62 Identify the geologic time period in which the extensive coal-forming forests represented in diagram A weremost abundant. [1]63 Identify one process that changed the buried organic matter of diagram B into coal. [1]64 Identify the primary chemical element found in coal. [1]65 The burning of fossil fuels, represented in D, produces the greenhouse gas carbon dioxide (CO2), whichis associated with air pollution and global warming. Other than CO2, identify one other major greenhousegas. [1]P.S./E. Sci.–Jan. ’20[21][OVER]
Part CAnswer all questions in this part.Directions (66–85): Record your answers in the spaces provided in your answer booklet. Some questions mayrequire the use of the 2011 Edition Reference Tables for Physical Setting/Earth Science.Base your answers to questions 66 through 68 on the topographic map below and on your knowledge of Earthscience. Points A, B, C, D, and X represent surface locations on the map. Lines AB and CD are reference lines.XBLake100BlueRiverCA50DContour interval 10 meters01234N5 kilometers66 Calculate the gradient along the reference line from A to B. Include units with your answer. [1]67 On the grid in your answer booklet, construct a topographic profile along line CD by plotting the elevationof each contour line that crosses line CD. Connect all six plots with a line to complete the profile. [1]68 Determine one possible elevation of point X. [1]P.S./E. Sci.–Jan. ’20[22]
Base your answers to questions 69 through 71 on the diagram below and on your knowledge of Earth science.The diagram represents a side view of Earth. The North Pole and some latitudes are labeled. The dashed linerepresents Earth’s axis.NorthPole60 N30 NSun·sraysEquator30 S60 SSouth Pole69 Identify the season that is just beginning in the Northern Hemisphere when Earth is in this position. [1]70 State the number of hours of daylight that would be experienced at the Equator three months after the daterepresented by this diagram. [1]71 State the general relationship between latitude and the duration of insolation on this day from the Equatorto 60 N. [1]P.S./E. Sci.–Jan. ’20[23][OVER]
Base your answers to questions 72 through 75 on the passage and map below and on your knowledge of Earthscience. The map shows the location of a major earthquake that occurred in 2010 off the west coast of Chile, inSouth America. The starrepresents the location of the earthquake epicenter.On February 27, 2010, a strong earthquake with a magnitude of 8.8 occurred off thewest coast of South America near the city of Concepción in central Chile. There wastremendous damage to the region and loss of life, as buildings collapsed. Tremors were feltas far north as Ica, Peru, 2400 kilometers away. The earthquake triggered a tsunami thatdamaged several coastal towns. Tsunami warnings were issued to 53 countries, includingthe United States, where damage was reported. This earthquake is ranked as one of thehighest in magnitude ever recorded by a seismograph. Chile has experienced some of thestrongest earthquakes in the past, including a 1960 earthquake that had a magnitude of9.5, the highest ever recorded.Earthquake Map10 S10 SIcaPERUBOLIVIA20 SCHILE20 S40 SNTINAConcepción30 SARGE30 S40 S50 S50 SNKeyMountain80 W70 W72 On the block diagram of the tectonic plate boundary in your answer booklet, draw two arrows, one in eachbox, to indicate the general direction that each plate moved in relation to each other, causing the 2010 Chileearthquake to occur. [1]73 Identify the name of the oceanic tectonic plate located along the west coast of South America where thisearthquake occurred. [1]74 Determine the P-wave travel time, in minutes and seconds, from this earthquake’s epicenter to the tremorsthat were felt in Ica, Peru. [1]75 Describe one action that coastal residents should have taken in response to the tsunami warnings that wouldhave reduced loss of life. [1]P.S./E. Sci.–Jan. ’20[24]
Base your answers to questions 76 through 78 on the data table below, on the map in your answer booklet,and on your knowledge of Earth science. The table lists storm data for Hurricane Matthew, which occurred in thefall of 2016. Air pressure, wind speed, and storm location are shown for the hurricane’s center at the same timeeach day. The map shows the location of Hurricane Matthew from September 28 to October 4.Hurricane Matthew DataDateAir Pressure(mb)Wind Speed(mph)Location ofStorm CenterSept. 28Sept. 29Sept. 30Oct. 1Oct. 2Oct. 3Oct. 4Oct. 5Oct. 6Oct. 7Oct. 8Oct. 0140145120140120757513 N, 61 W14 N, 66 W14 N, 71 W13 N, 74 W14 N, 75 W16 N, 75 W19 N, 74 W22 N, 75 W25 N, 78 W29 N, 81 W33 N, 79 W35 N, 74 W76 On the map in your answer booklet, complete the path of Hurricane Matthew by plotting the location of thestorm center for October 5 through October 9. Draw a line to connect all five of these plots to the October 4plot to complete the path. [1]77 Identify the two consecutive dates between which the greatest decrease in air pressure occurred. [1]78 The table below shows the Saffir-Simpson Scale, which is used to classify hurricanes.Saffir-Simpson ScaleClassificationof HurricaneWind Speed(mph)Category 174-95Category 296-110Ca
P.S./EARTH SCIENCE P.S./EARTH SCIENCE The University of the State of New York REGENTS HIGH SCHOOL EXAMINATION PHYSICAL SETTING EARTH SCIENCE Friday, January 24, 2020 — 9:15 a.m. to 12:15 p.m., only The possession or use of any communications device is strictly prohibited when taking