Transcription
14 November 2017China Market StrategyDecoding disinflation: principal contradiction, social progress and marketfragilitySummary: Imagine an economy where the bottom 90% splits the national income evenlywith the top 10%, and income gain perennially lags productivity gain for the bottom 90%.Such an economy must be in constant surplus, as slow income gain would fail to spursufficient demand for supply driven by rapid productivity improvement. Consequently,prices will be depressed. As such, severe and worsening inequality is the reason why theglobal economy is still beset by the constant threat of deflation almost 10 years intorecovery.While wage gain has started to outpace productivity gain since 2014, and inflation hascrept up since, aggravated inequality has worked to slow the momentum of inflation,giving central bankers leeway to experiment with quantitative easing. Such disinflationand lax monetary policy have made wealth even more concentrated than income, and inturn made market more prone to bubble and economies more vulnerable to smallchanges in interest rates.Inequality in the US is now similar to the level seen just before the two wars and theGreat Depression. It would appear that dramatic social disruption is looming on thehorizon, if history is a guide. But inequality had remained high and steady for a longperiod before these catastrophic happenings. Without a proactive initiation of socialsystem reform, inequality can stay in this status quo for some time still.Some are taking heed of these social extremes that breed fragility. President Xi redefinesChinese society’s principal contradiction as “unbalanced and inadequate developmentand the people's ever-growing needs for a better life”. He is calling for fairer incomedistribution and more inclusive growth. One should not doubt the government’s resolveto achieve these social aims. The feats in the past few years are the strongest evidence.Joseph Needham once observed that China, a country that had invented so much inantiquity, by the 18th and 19th century had turned into a “booby nation” as Emersonlabeled it. But now China is changing right before our eyes. It is energetic, enigmatic, rich,freewheeling and awesome. The era of intense movements and entrepreneurial creativityhas dawned. As such, Chinese consumption should continue with its ascendance,technology and financial innovation and credit culture will thrive, and inflation willeventually come back. And as the secular bond bubble unravels, stocks will continue tooutperform.-----------------------------“All animals are equal, but some animals are more equal than others.” – Animal Farm,George OrwellDownload our reports from Bloomberg: BOCM〈enter〉Hao Hong, CFAhao.hong@bocomgroup.com
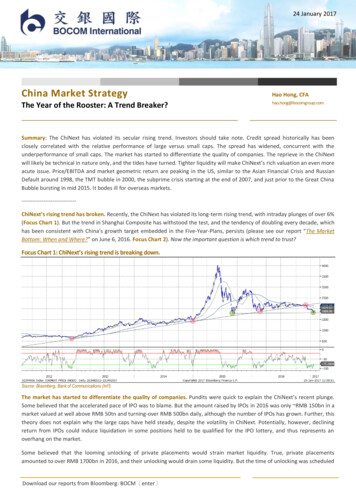
China Market Strategy14 November 2017China’s New Principal ContradictionUnbalanced and inadequate development. In his inspiring speech delivered at China’s19th CPC National Congress, President Xi redefined China’s principal contradiction for thenew era: “the contradiction between unbalanced and inadequate development and thepeople's ever-growing needs for a better life”. Despite significant progress of China’soverall production capacity, China’s development is “unbalanced and inadequate”. Andthis uneven development has become “the main constraining factor in meeting thepeople’s increasing needs for a better life”.Fairer and orderly income redistribution. Further, President Xi envisioned the realizationof socialist modernization by 2035. During the development process, middle-incomegroup will grow considerably, disparities between urban and rural development, indevelopment between regions and in living standards are significantly reduced. He calledon the Party to continue to follow the principle of “distribution according to one’s workwhile improving our institutions and mechanisms for distribution based on factors ofproduction, so as to make income distribution fairer and more orderly . (So that)incomes grow in step with economic development, and pay rises in tandem with increasesin labor productivity”. (Quoted from “Xi Jinping’s report at 19th CPC National Congress”,translated by China Daily)In essence, President Xi sees that income distribution in China has become uneven, andhe has set out to correct it. Judging from his achievements in the past few years,especially the resolve to fight corruption, we believe that the new mantra will succeed,and will usher in significant social changes that have implications for consumption,inflation, fiscal and monetary policy and asset prices.China’s income inequality has worsened. Our analysis of the NBS household survey dataconfirms President Xi’s observation. In Exhibit 1, we show the distribution of Chineseurban income. The distribution of income resembles a bell curve, with an increasingly fattail on the right end. While the rapid shift of the bell curves towards the right suggestsstrong income growth, and the expanding area under the bell curve suggests growingincome earned by a larger population, the widening span of the bell curve alludes toworsening income disparity over time.Exhibit 1: Both average income and income inequality are growing rapidly in China1801999 average: 2006 average: 2009 average: 2012 average: 2015 average:11,759 yuan 17,175 yuan5,854 yuan31,790 yuan24,565 yuan1602015140millions of 199920Urban per capita disposable 80,000Source: NBS, BOCOM Int’lNote: Income distribution curve based on actual NBS household survey data for urban residents before 2012. Distribution is estimated from 2013 to 2015. For ruralresidents, the distribution is very similar.Download our reports from Bloomberg: BOCM〈enter〉2
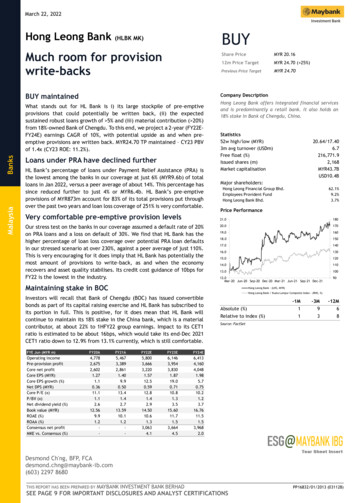
China Market Strategy14 November 2017Income inequality driven in part by demographics. Nobel Laureate Simon Kuznetsposited that, as an economy grows, market forces first increase and then decreaseeconomic inequality. This is because workers tend to be most productive when they arein their middle age, and less so when they are younger and still learning, or older whenready to retire. As such, the Kuznets curve, which depicts how the productivity-inducedincome inequality evolves across time, resembles an inverted U-shaped curve.Exhibit 2: The life cycle of income inequalityIncome inequality vs. country 4.2EM新兴市场SOUTH ALAYSIAPHILIPPINES3.8KENYACHINA IWANS KoreaUKCANADAETHIOPIAITALYIRELANDAUSTRALIA FRANCE EN3.2FINLANDEurope欧洲3.01520253035Country Median Age404550Source: Bloomberg, Federal Reserve, BLS, BEA, BOCOM Int’lNote: Strictly speaking, the X axis of the original Kuznets curve should be income. We substitute income with age in our chart.In Exhibit 2, we plot the Gini coefficient against its corresponding country’s averagepopulation age. The chart shows older countries have lower Gini, or lower inequality,while middle-aged countries tend to have higher Gini. The shape of the line of best fitresembles what Kuznets foresaw, albeit somehow flatter than expected.The “natural” degree of inequality. Given that population age affects productivity andhence income distribution, a certain level of inequality must always be innate in aneconomy. Or simply put, there must be an inherent “natural degree of inequality”. Whatneeds to be explained is the level of inequality beyond this natural degree. That is, thereare other factors beyond simple demographic that are driving the inequality President Xivowed to change. Given the similarities in social systems between the US and China, webelieve an investigation into the inequality and its cause in the US will shed light on theprincipal contradictions that China is facing.Download our reports from Bloomberg: BOCM〈enter〉3
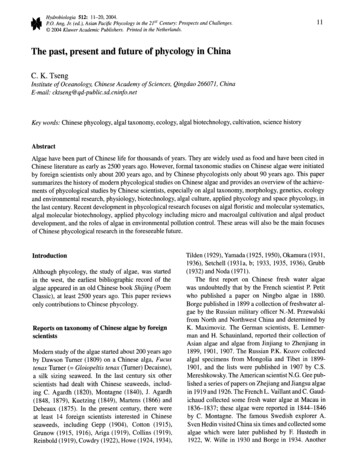
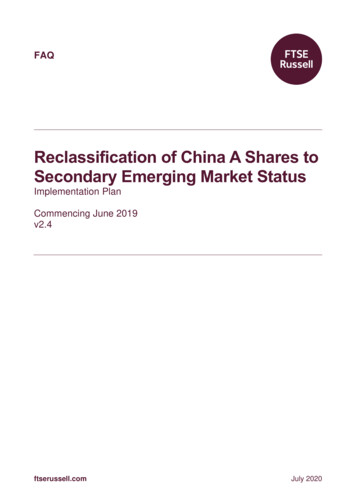
China Market Strategy14 November 2017Inflation Starting to Rise - FinallyThe 10-year yield is a history of surplus value exploitation. In our special report titled “APrice Revolution: On Global Asset Allocation” on November 14, 2016, we postulated thatinadequate labor compensation relative to productivity gain, or the exploitation of labor’ssurplus value, has been depressing inflation and hence bond yield for over three decades(Exhibit 3). It has been the driver for the secular bond bull market.Exhibit 3: The 10-year yield is a history of surplus value exploitation; productivity gain inadequately compensatedSource: Bloomberg, Federal Reserve, BLS, BEA, BOCOM Int’lThe fact that bonds have substantially outperformed equities for the same period alsosuggests that capitalists at the top of the value chain have taken it all, exploiting bothbusiness owners who borrow start-up capital, and business employees. The fallinginflation and bond yield for over 30 years say much about the relationship of production,and how gains have been unevenly accrued to different socioeconomics groups.Exhibit 4: Inflation has indeed risen since late 2014Source: Bloomberg, BOCOM Int’lOnce labor compensation started to rise faster than productivity gain, as it has been sincelate 2014, inflation should follow. As such, we concluded that bond yield should rise, theDownload our reports from Bloomberg: BOCM〈enter〉4
China Market Strategy14 November 2017secular bond bull market should end, and stocks should outperform bonds. Those wereour conjectures from one year ago.Inflation has risen globally since 2014. Since our last year’s special report, stocks have sofar massively outperformed bonds. The 10-year yield has seen its low in 2016, and had anepic surge in the weeks following Trump’s win. Contrary to consensual perception,inflation across the globe has been rising (Exhibit 4). The start of this inflation upswingwas in around late 2014, coinciding with the inception when wage gain started to outpaceproductivity gain. The dramatic recovery of commodities has sent PPI surging, and theinflation pressure from upstream will likely be passed onto downstream in the nearfuture. But for now, the absolute level of inflation is still low.The Secret of DisinflationInequality suppresses inflation. The secret of disinflation lies in how labor income gain isallocated towards different socio-economic groups within the working population, and itseffect on final demand – not just the relationship between productivity and wage gain.We compare top 10% earners’ national income share in the US with the historical trend ofUS long-term interest rate in Exhibit 5.The history of inequality in the US. The timing of when income concentration in the USrose and fell is interesting. During the two wars and the Great Depression, capital incomehad been severely destroyed for the elites, and probably never been able to fully recoverbecause of progressive estate taxation. Further, the fall in income concentration can beexplained by wage controls of the war economy. The National War Labor Board,established in January 1942 and dissolved in 1945, was responsible for approving all wagechanges. Exceptions to wage controls were more frequently granted to low-wage earners,while executive salaries were frozen in nominal terms from 1941 to 1945.Exhibit 5: Income gain accrued more towards top earners, further depressing wage gain relative to productivity16%30%National Income Share vs. Long-term Interest 2%10%8%36%Top 10% Shr of National Income(Inverted, �38%40%42%6%44%Long-term Interest 5195319611969197719851993200120092017Source: Bloomberg, Federal Reserve, Thomas Piketty, Gabriel Zucman, NBER, BOCOM Int’lNote: Long-term yield for recent years estimated from annual average of US long-term treasury yield.This phenomenon is shown in the precipitous fall in the income concentration (reversescale in Exhibit 5) from the late 1930s to 1940s. After that, income concentrationcontinued to grind lower from the mid-1940s till early 1970s.Download our reports from Bloomberg: BOCM〈enter〉5
China Market Strategy14 November 2017Then, income concentration started to increase again since the early 1980’s, whileinflation and long-term interest rate had been falling. This secular change coincided witha series of tax reform initiated by the Reagan government to cut taxes across the board,simplify tax codes, broaden the tax base, and eliminate tax shelters.The effect of US Tax Reform. In 2012, the Library of Congress issued a report analyzingthe effects of tax rates from 1945 to 2010. The report concluded that the reduction of toptax rate did increase income inequality. That is, tax cuts for the top appear to beassociated with the increasing income concentration. In the Economic Recovery Tax Actof 1981 (ERTA), transfer payments were made to people in the lower tax brackets.Unfortunately, this Act put the US government in deficit, while failing to increase incomeand thus consumption at the bottom.By the summer of 1982, the double dip recession, return of high interest rates, andballooning deficit convinced the Congress that the ERTA had failed. Afterwards, most ofthe personal tax cuts were backed out in September 1982. When Reagan left the office,the national debt had tripled. The ERTA is an example of how a tax reform without deficitneutrality, as the one that Trump’s administration is undertaking, will not succeed.Labor income is the main income source for both the top and the bottom. Incomeconcentration is even more pronounced as you move up the income concentrationpercentile (Exhibit 6). Alarmingly, income inequality is now at a similar level to theperiod preceding the Great Crash of 1929, as well as just before WWII.Exhibit 6: Top 1% income share vs. bottom 50% has been widening globally.22%20%18%Top 1% income share顶层1%收入占比ChinaUSFrance28%Bottom 50% income 10%16%8%14%6%12%4%1978 1982 1986 1990 1994 1998 2002 2006 2010 201410%1978 1982 1986 1990 1994 1998 2002 2006 2010 2014ChinaUSFranceSource: Bloomberg, Thomas Piketty, Gabriel Zucman, Facundo Alvaredo, Lucas Chancel, NBER, BOCOM Int’lA glimpse at the top and bottom income earners’ pre-tax income composition revealsthat it is the surge of labor income amongst the top earners that has aggravated socialinequality since the 1970s. The percentage of top earners’ income coming from laborincome has surged since the 1970s. If the bottom earners’ income had not beenincreasingly tax-exempt, inequality would have been much worse. Further, thepercentage of bottom earners’ income coming from capital has been rising. And so hasthat of top earners since the 2000s (Exhibit 7).Download our reports from Bloomberg: BOCM〈enter〉6
China Market Strategy14 November 2017Exhibit 7: Labor income rises much faster for top earners than for bottom ones.Top 1% pre-tax income share: labor vs. capital 占比100%90%80%Capital income资本收入70%60%50%40%30%20%Labor income劳动收入10%0%1913 1918 1923 1928 1933 1938 1943 1948 1953 1958 1963 1968 1973 1978 1983 1988 1993 1998 2003 2008 2013Avg pre-tax income of the bottom 90%底层90%平均税前收入100%Capital income资本收入90%80%Tax-exempt labor income免税劳动收入70%60%50%40%Taxable labor : Bloomberg, Thomas Piketty, Gabriel Zucman, NBER, BOCOM Int’lThe secret of disinflation. Note that inflation is being depressed because wage gain isslower relative to productivity gain for the bottom masses. Such an economy must be asurplus economy where supply (productivity driven) is far greater than demand (wagedriven). And oversupply exerts downward pressure on prices.Some may point out that top earners are indeed more senior than bottom earners, andthus the more productive are likely to earn more. But even if allowing for the Kuznetseffect aforementioned, for a country at the age group of the US, age difference alonebetween top and bottom income earners cannot fully account for the significantdifference in income inequality.After all, between 1980 and 2014, annual real growth in top 1%’s income was four timesas much as that of bottom 90%. And for the top 10%, it was three times as fast as thebottom 90%. Productivity difference as a result of age, education and technologyinnovation cannot fully explain such a dramatic difference in growth rates. As such, if thetop 10% is substantially overcompensated relative to this group’s productivity gain, thenthe bottom 90%, the majority of the society who takes slightly more than 50% of nationalincome, must be substantially undercompensated (Exhibit 8).Download our reports from Bloomberg: BOCM〈enter〉7
China Market Strategy14 November 2017If so, the significant lag in labor income gain behind productivity gain in the bottom 90%must have been a significant drag on final consumption. As far as we know, the CPI baskettracks an average person’s consumption habits, rather than the top echelon. Asinequality worsens, this drag will be even more significant, depressing final demand andhence inflation even further. And this, we believe, is the secret of disinflation (Exhibit 9).Exhibit 8: Top earners’ annual income grew four times as fast as that of bottom earners’ between 2009 and 2014Decomposition of real growth rates of pre-tax national �AllBottom90%Bottom50%Next 40%Top 10%Top 5%Top 1%Top 0.5%Top 0.1%Top 0.01%Average yearly growth rates of pre-tax income per %0.7%0.1%0.9%2.9%3.2%3.5%3.5%Fraction of pre-tax income growth accruing to each 0%37%1%22%77%Source: Bloomberg, Thomas Piketty, Gabriel Zucman, Tony Atkinson, NBER, BOCOM Int’lInequality is a global phenomenon, and it is worsening (Exhibit 6). Such dramatic disparityhas occurred before, in 16th century Spain, 17th century Holland, the Gilded Age and theRoaring 20s in the US. These eras were all weaved with disruptive productivity gains fromtechnology breakthrough, creative financial innovation, cooperative governments, and aninflux of immigrants and conquests of rich lands overseas. The trend was best exploitedby the rich and the educated of the time. What we are witnessing is really the rhymes ofhistory.Explaining the exception to our thesis – continental Europe and Japan. But here is therub: our thesis is that the inequality between different income groups, or wage gain wellbelow productivity gain for the bottom masses, is the cause of disinflation for the pastthree decades (Exhibit 3). If so, why the more developed, more egalitarian Europeancountries and Japan are perceived to be facing more severe deflationary threats?Download our reports from Bloomberg: BOCM〈enter〉8
China Market Strategy14 November 2017Exhibit 9: Inequality and inflation strongly and inversely correlated20%50%National Income Share vs. CPITop 10% Shr of National Income (Inverted, : Bloomberg, Thomas Piketty, Tony Atkinson, Journal of Economic Literature, BOCOM Int’lIn Exhibit 4, we have shown that inflation globally has been on an upswing since late2014, coinciding with the inception when wage gain started to exceed productivity gain.That is, inflation has been rising, even in the egalitarian Europe and Japan. However, theextent to which these egalitarian countries’ inflation has risen may be less than that ofthe US, a poster child of social inequality. Therefore, these countries may appear notentirely consistent with our thesis.While we believe social inequality is the dominant cause of disinflation (but has begun tomean revert Exhibit 9), idiosyncratic factors in various countries must have affectedinflation. For instance, we note that these countries are in general older (Exhibit 2), havedifferent social norms towards inequality, and have more progressive tax regimes thatre-distribute gains between different socioeconomic groups.Between the US and France, the composition of top income is very different. The Frenchtop income still primarily consists of dividend income, although wealth concentration haslessened significantly since WWII, as capital has been severely destroyed by the wars andhas never been able to recover. In the US, the coupon-clipping rentiers have beenovertaken by the ascendance of the working rich whose wage gain significantly outpacedproductivity gain.Download our reports from Bloomberg: BOCM〈enter〉9
China Market Strategy14 November 2017Exhibit 10: French labor earnings gain relative to productivity gain, and compared with CPISource: Bloomberg, BOCOM Int’lFurther, the egalitarian countries are experiencing slow productivity gain due to advancedage (Exhibit 2); wage may be increasing at an even slower pace due to rigid employmentregulations (Exhibit 10). Even so, inflation in France has begun to tick up.Download our reports from Bloomberg: BOCM〈enter〉10
China Market Strategy14 November 2017Implications and OutlookSome inequality is inherent and is good for growth. Given that a natural degree ofincome inequality exists in an economy due to demographics, inequality cannot becompletely eradicated even if China “improves institutions and mechanisms fordistribution based on factors of production”. That said, if disparity in income is due todifference in productivity, then such disparity will indeed spur productivity growth.Financial innovation, market deepening and the boom in consumer finance in China.Further, given the diverse consumption propensity inherent in various income groupswith different levels of productivity, younger generations will find it difficult to consumebefore its productivity matures. Also, without a well-functioning financial market, thegroup with peak productivity would find it difficult to save and invest for its futureretirement.With rising income inequality, financial reform and financial innovation will thrive. Andwith policy guidance, it will likely to accelerate in the coming years. Already, we haveseen a flourishing consumer credit market and relaxation of foreign ownership of China’sfinancial sector, as well as financial innovations such as market index options and futures.China’s consumption is under-represented globally compared with the size of itspopulation; consumption will continue to grow with income. Globally, Chineseconsumption of various discretionary consumer goods such as healthcare, education andmedia, home care, etc is still significantly lower than the international average relative toChinese population as a percentage of the world population (Exhibit 11).Exhibit 11: China’s demand for consumption goods is depressed relative to demand for capital goods70%China consumption as % of global consumption2005Capital Goods60%2008/092015/2016Consumption Goods50%40%30%China 20% of world population20%10%0%Cement SteelCoalAlum Copper Const.Electricity OilMachineryBeer Consumer AutoElectronicsApp Clothing Soft Retailing Home Pack Personal Media HealthDrinksCare Food CareCareSource: USGS, WSA, Brook Hunt, BP, Euromonitor, WHO, PWC, BOCOM Int’lNote: Cement, steel, coal, aluminum, copper, electricity, oil and auto are calculated in volume, all the other categories are calculated in value.In the past, Chinese consumption has been heavy on capital goods such as cement, steel,coal and copper, etc. for development purpose. In recent years, we have seen a dramaticsurge in Chinese consumption in auto, consumer electronics, appliances and education.The Singles Day sale single-handedly created by Alibaba is now the biggest globalshopping event. Not surprisingly, these sectors have been the best-performing sectorsthis year. Discretionary consumption tends to accelerate with income growth (Exhibit 12),and the golden era of consumption has dawned on China.Download our reports from Bloomberg: BOCM〈enter〉11
China Market Strategy14 November 2017Exhibit 12: Convex consumption curve indicates strong income sensitivity of the discretionary consumption itemsValue-basedLeisure & RecreationHealthcarePer ca pita expenditure on Health Goods andMedi cal Services r ca pita GDP 03,5003,0002,5002,0001,5001,0005000Per ca pita expenditure on Leisure andRecreation (USD)Per ca pi ta GDP (USD)60,000010,000Housing50,00060,0006,000 Per ca pita expenditure on Transport (USD)4,0003,0002,000Per ca pita GDP (USD)1,000Per ca pita GDP nsurance20,00030,00040,00050,00060,000EducationLi fe Insurance Premium as % ofGDP8%40,0005,00009%30,000TransportationPer ca pita expenditure on 0002,0001,000020,000Per ca pita expenditure onEducation (USD)1,4001,2007%1,0006%5%8004%6003%4002%1%200Per ca pita GDP (USD)0%Per ca pita GDP 0,000Leisure & RecreationAnnual Ci nema Trips per Ca pita5Ai rl ine Passenger-km Per Ca pita14,000012,000410,00038,0006,00024,00012,000Per ca pita GDP (USD)0Per ca pita GDP 20,00030,00040,00050,00060,000Source: USGS, WSA, Brook Hunt, BP, Euromonitor, WHO, PWC, BOCOM Int’lNote : Each dot denotes one country. Per-cap GDP on x-axis, and consumption for each commodity on y-axis. The convex curves are fitted from the dots.Download our reports from Bloomberg: BOCM〈enter〉12
China Market Strategy14 November 2017Exhibit 13: Concave consumption curves for staples indicate weaker income sensitivityValue-basedFood5,0001,600Per capita expenditure on Food and Non-AlcoholicBeverages(USD)4,500Per capita expenditure on AlcoholicBeverages and Tobacco 01,50074001,000Per capita GDP (USD)500Per capita GDP sehold2,500Per capita expenditure on Clothing andFootwear (USD)2,0002,0001,5001,5001,0001,000500Per capita GDP (USD)0Per capita expenditure on Household Goodsand Services (USD)500Per capita GDP 20,0001,400Per capita expenditure onCommunications n120Per capita meat consumption (kg)1001,000808006060040400200Per capita GDP (USD)020Per capita GDP ation100%HouseholdInternet penetration120% Per household possession of er capita GDP (USD)10%0%20%Per capita GDP 0040,00050,00060,000Source: USGS, WSA, Brook Hunt, BP, Euromonitor, WHO, PWC, BOCOM Int’lNote : Each dot denotes one country. Per-cap GDP on x-axis, and consumption for each commodity on y-axis. The concave curves are fitted from the dots.Download our reports from Bloomberg: BOCM〈enter〉13
China Market Strategy14 November 2017Inflation likely to creep up. With wage gain starting to outpace productivity gain,inflation pressure will start to rise, as it has been since late 2014. But as discussed indepth before, productivity gain is being accrued to top income earners, while the bottommasses’ labor income growth lags significantly. This income concentration will mean thatdemand is suppressed for the bottom masses constituting 90% of the population but onlyearning 50% of total income. As such, the structure of a surplus economy remains intactwhere oversupply exerts downward pressure on prices.We note that the severity of income inequality in the US is similar to that just before theGreat Depression, and just before the WWII. It is alarming, as history would suggestlooming disruptive social changes on the horizon. But we also note that pre-WWII,income inequality remained high and steady for well over a decade – until the warsseverely destroyed capital base.That is, secular changes take time. At first, such changes are almost imperceptible, beforethey can gather enough momentum to accelerate. It takes well over 10 years for Piketty’sseminal paper “Income Inequality in the United States, 1913-1998” to culminate in hismagnum opus “Capital in the 21th Century”. Such persistent income inequality will helpease rising inflation pressure.Interest rates will rise; social system more fragile. Should income inequality persist, itseffect on uneven productivity accrual and hence inflation would mean that central bankscan afford to raise interest rates at a measured pace. Consistent low rates will encouragefurther aggressive risk taking, and will lead to further wealth concentration that is alreadysubstantially more severe than income inequality. However, such social system withextremes is brittle, and is sensitive to small changes in fiscal and monetary policies.Eventually, it will lead to a sudden collapse of the financial market. Investors should heedwarning.Rotation from bonds to equities should continue, stocks continue to outperform. Ourbond yield vs. earnings yield model (EYBY model hereafter), which has helped us pinpointthe bottom of China’s stock market after mid-2014, as well as the peak of the bubble inJune 2015. The model has also helped us negotiate the rough wat
China Market Strategy Hao Hong,CFA hao.hong@bocomgroup.com Decoding disinflation: principal contradiction, social progress and market . Income distribution curve based on actual NBS household survey data for urban residents before 2012. Distribution is estimated from 2013 to 2015. . Once labor compensation started to rise faster than .