Transcription
The American Freshman:National Norms Fall 2019ELLEN BARA STOLZENBERG MELISSA C. ARAGON EDGAR ROMO VICTORIA COUCH DESTINY MCLENNAN M. KEVIN EAGAN NATHANIEL KANG
The American Freshman:National Norms Fall 2019Prepared by the Staff of theCooperative Institutional Research ProgramEllen Bara StolzenbergMelissa C. AragonEdgar RomoVictoria CouchDestiny McLennanM. Kevin EaganNathaniel KangHigher Education Research InstituteGraduate School of Education & Information StudiesUniversity of California, Los Angeles
Higher Education Research InstituteUniversity of California, Los AngelesM. Kevin Eagan Jr., Associate Professor, CIRP Director, and HERI DirectorHERI Affiliated ScholarsWalter R. Allen, Allan Murray Cartter Professorof Higher EducationAlexander W. Astin, Founding Director andSenior ScholarMitchell J. Chang, ProfessorM. Kevin Eagan Jr., Associate ProfessorJessica Harris, Assistant ProfessorOzan Jaquette, Assistant ProfessorPatricia M. McDonough, ProfessorCecilia Rios-Aguilar, ProfessorVictor B. Sáenz, Professor,University of Texas at AustinLinda J. Sax, ProfessorSylvia Hurtado, ProfessorThe Higher Education Research Institute (HERI) is based in the Graduate School of Education &Information Studies at the University of California, Los Angeles. The Institute serves as an interdisciplinarycenter for research, evaluation, information, policy studies, and research training in postsecondary education.520 Portola Plaza, Math Sciences 4223/Box 951521, Los Angeles, CA 90095-1521www.heri.ucla.edu 310-825-1925ACKNOWLEDGEMENTS: Cover design by Escott & Associates. Page layout and text design by The Oak Co.Published by the Higher Education Research Institute. Suggested citation:Stolzenberg, E. B., Aragon, M. C., Romo, E., Couch, V., McLennan, D., Eagan, M. K., & Kang, N. (2020).The American Freshman: National Norms Fall 2019. Los Angeles: Higher Education Research Institute, UCLA.To download additional copies of this monograph, please visit www.heri.ucla.eduCopyright 2020By the Regents of the University of CaliforniaISBN 978-1-878477-70-5 (e-book)ISBN 978-1-878477-71-2 (e-book, expanded edition)ISBN 978-1-878477-72-9 (print-on-demand)
CONTENTSList of FiguresvThe American Freshman: National Norms Fall 20191Introduction1Demographic and Personal Characteristics2New Items: Reasons for Choosing Current Institution4Academic reputation of intended major most importantfor students in health professions, particularly nursing;those aspiring to graduate/professional degrees4Communication with a professor less salient overall but variesby first-generation status, race/ethnicity, and ultimate degree objective6Greater Financial Concerns and Increased Likelihood to Get a JobAcross All Income Levels7Physical and Emotional Health on Downward Trend Regardless of Gender9Time Spent Exercising/Playing Sports Varies by Socioeconomic Status10Academic Behaviors12Focus on physics12Habits of mind on the decline13Misalignment Between Degree and Career Aspirations Variesby Race/Ethnicity and Socioeconomic Status14Self-rated Ability to Manage Their Time Effectively17Higher self-rated ability to manage time effectivelypositively related to academic performance andnegatively related to academic disengagement17Lower self-rated ability to manage time effectivelyassociated with struggles with emotional well-being18iii
Social and Political Engagement: Past Behavior, Future Behavior, and GoalsGoal of helping others in difficulty linked to past andfuture volunteer/community service work21Students with goals of community leadership more likelyto demonstrate for a cause and vote in the future22ReferencesThe 2019 National NormsAll First-Time, Full-Time Freshmen by Institutional Typeiv19232525Appendix A: Research Methodology49Appendix B: The 2019 CIRP Freshman Survey Instrument59Appendix C: Institutions Participating in the 2019 CIRP Freshman Survey67Appendix D: The Precision of the Normative Data and Their Comparisons73About the Authors77Publications78
Figures1. Multiracial Students, by Race/Ethnicity22. First-generation Students, by Race/Ethnic Group33. Importance of Academic Reputation of Intended Major in College Choice,by Major Field54. Importance of Communication with a Professor in College Choice,by Ultimate Degree Objective65. Financial Concern by Family Income, 2015 and 201986. Job Intentions by Family Income, 2015 and 201997. Self-rated Physical and Emotional Health, by Gender, 2015–2019108. Exercising Six or More Hours per Week, by Income and Gender119. Exercising Six or More Hours per Week, by Income and First-generation Status1210. Self-rated Academic Ability, by High School Physics Participation and Gender1311. Frequently Asked Questions in Class, by First-generation Status andRace/Ethnic Group1412. Distribution of Doctor/Surgeon/Dentist Aspirants, by Race/Ethnic Group andHighest Planned Degree Objective1513. Doctor/Surgeon/Dentist Aspirants’ Academic Preparation,by Highest Planned Degree Objective1614. Ability to Manage Time Effectively, by High School GPA and Gender1715. Ability to Manage Time Effectively, by Hours per WeekWatching TV/Online Video Content1916. Likelihood of Voting in a Local, State, or National Election, by Political Views2017. Goals: Keeping up to Date with Political Affairs and Participating in aCommunity Action Program, by Political Views2118. Performed Volunteer Work, by Importance of the Goal ofHelping Others in Difficulty22v
vi
THE AMERICAN FRESHMAN:NATIONAL NORMS FALL 2019IntroductionIn this report of the 54th administration of the Freshman Survey, we recognize the increasingdiversity of incoming college students, along with two new items addressing reasons studentschoose their particular institution: academic reputation of their intended major and communication with a professor. This monograph covers a number of financial concerns, such asstudents’ likelihood of getting a job to help pay for college and how time spent exercising orplaying sports varies by family income. We also highlight recent trends in students’ emotionaland physical health and academic behaviors. Further, we discuss the misalignment betweendegree and career aspirations for subgroups of students and students’ self-rated ability tomanage their time effectively. Finally, we address students’ social and political engagement,including past and forthcoming behaviors and their future goals.Although 126,642 respondents at 178 four-year colleges and universities submitted theirsurveys in time for their data to be included in the 2019 norms, the normative datapresented here are based on responses from 95,505 first-time, full-time (FTFT) freshmenentering 148 baccalaureate institutions. Weights have been applied to these data to reflectthe more than 1.5 million FTFT undergraduate students who began college at 1,427 fouryear colleges and universities across the U.S. in the fall of 2019. This means that differencesof one percentage point in the results published here reflect the characteristics, behaviors,and attitudes of approximately 15,000 first-year students nationally. We describe the fullmethodology of the 2019 Freshman Survey administration, stratification scheme, and weightapproach in Appendix A.1
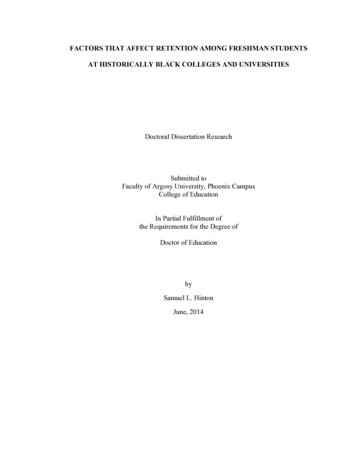
Demographic and PersonalCharacteristicsAs the country becomes increasingly diverse,America’s colleges and universities continueto enroll greater numbers of students froma broader range of racial, ethnic, linguistic,and socioeconomic backgrounds. While half(50.0%) of college students identify as White,more than one in ten each identify as Asian(11.7%), Black (10.1%), or Latina/o/x (11.3%),and 0.3% as Native American. Interestingly,15.8% of students identified with at least tworacial or ethnic backgrounds, making this thesecond-most common of the aggregated race/ethnic groups. Looking exclusively at this groupof multiracial students reveals the richness ofcultural heritage these students bring to college(see Figure 1). Although four in five (80.2%)multiracial students cite White/Caucasian as partof their racial background, one quarter of multiracial students also report Mexican American/Chicana/o/x (25.0%) or African American/Black(25.8%) heritage. Additionally, 13.3% of multiracial students reported being American Indian/Alaska Native, 12.6% identified as East Asian,and 8.8% stated they were Filipina/o/x.In addition to racial and ethnic diversity,institutions of higher education are enrollinggreater numbers of students from a variety oflinguistic backgrounds. While only 3.2% ofsurvey respondents identified as internationalstudents (F-1, J-1, or M-1 visa), nearly tenpercent (9.4%) of students reported that Englishis not their primary language. Of the lattergroup of students, 27.1% were internationalstudents, 14.1% were permanent residents, and,surprisingly, more than half (53.9%) said theywere United States citizens. Breaking down thisgroup of students whose primary language isnot English by race and ethnic group reveals anunexpected level of diversity. Over one third ofnon-primary English speakers identified as Asian(36.5%) or Latina/o/x (34.9%). Furthermore,12.1% identified as White, 8.9% as Two ormore races, 4.9% as Black, and 2.6% as anotherrace or ethnic group. These figures demonstratethe broad range of diverse backgrounds andexperiences students bring to college.Survey responses also show greater diversity withrespect to students’ sexual orientation. Although87.3% of students identified as heterosexual/Figure 1. Multiracial Students, by Race/Ethnicity(check all that apply)American Indian/Alaska Native13.3East Asian12.6Filipina/o/x8.8Southeast Asian3.4South Asian3.3Other Asian2.2Native Hawaiian/Pacific Islander4.1African American/Black25.8Mexican American/Chicana/o/x25.0Puerto Rican11.0Other 4050% of Students60708090
straight, 1.7% selected gay, 1.0% said lesbian,and an additional 1.2% chose pansexual. At7.2%, bisexual represented the second-mostcommon response for sexual orientation whilequeer (.6%), asexual (.5%), and not listed(.6%) each represented less than one percent ofincoming freshmen. The willingness of studentsto specifically identify their sexual orientationreflects increasing support for Lesbian, Gay,Bisexual, and Queer (LGBQ ) individualsnationwide. For example, more than nine inten students (90.6%) strongly agree or agreesomewhat that gays and lesbians should havethe legal right to adopt a child. Examining thissupport by political views further exemplifies thegrowing support for LGBQ individuals. Morethan a quarter (27.5%) of self-described politically far-right students would agree somewhatand 36.4% would strongly agree that gays andlesbians should have the right to adopt. Thissizable backing among the most conservativestudents exemplifies the increasing support forLGBQ individuals, which provides studentsgreater comfort in self-identifying their sexualorientation.Students who are first-generation are also onthe rise. Nearly one in five (19.4%) studentsindicated that their parents/guardians had notattended college. Of those who identified asfirst-generation, 34.3% are Latina/o/x, 28.7%are White, 14.5% are multiracial, 10.7% areBlack, and 9.8% are Asian. Native American(0.5%) and other race or ethnic group (1.4%)round out the remaining first-generationstudents (see Figure 2). One of the major challenges first-generation college students faceis how they will pay for college. Most firstgeneration students (61.4%) said they had someconcern about funding college and an additional22.0% indicated they had major concernsabout paying for college. On the other hand,only 54.5% students whose parents had at leastsome college had some concern and 9.8% hadmajor concerns about funding college. Despitethe financial and emotional hardships causedby concerns about paying for college, firstgeneration students are committed to having apositive impact on society. When asked to indicate the importance of helping others who arein difficulty, 83.4% of first-generation collegeFigure 2. First-generation* Students, by Race/Ethnic Group4034.33528.7% of nAsianBlackLatina/o/xWhiteOtherTwo or moreraces*HERI defines first-generation as neither parent/guardian having any college experience.3
students reported this was very important oressential, compared to 79.2% of their peers withcollege-educated parents. Similarly, half of firstgeneration college students (51.3%) said it wasvery important or essential to influence socialvalues while their non-first-generation peers saidso at a rate of 47.4%.New Items: Reasons for ChoosingCurrent InstitutionThe CIRP Freshman Survey has been askingstudents about reasons why they selected theirparticular institution since the 1970s. Items suchas rankings, academic reputation, and financesare popular in the mainstream media, as wellas of relevance to institutions when considering how to appeal to incoming students. In2019, we added “the academic reputation of myintended major” and “communication with aprofessor” as reasons that might have influencedtheir decision to attend their particular institution in an effort to analyze how more explicitreasons might differ from some of the generalreasons in this set of survey items. Differencesemerged by gender,1 with 57.2% of womenciting the academic reputation of their majoras a very important reason, which was nearlyten percentage points greater than it was formen (49.4%). This difference between menand women aligns overall with women beingmore likely than men to rate a variety of reasonsin selecting their current institution as veryimportant while men tend to be more neutral(Stolzenberg, et al., 2019). Communication with14a professor was not as salient overall but stillshowed some variation.Academic reputation of intended majormost important for students in healthprofessions, particularly nursing; thoseaspiring to graduate/professional degreesThe academic reputation of the intended majoras a very important reason in selecting theircurrent institution varied by students’ probable field of study (see Figure 3). Amongstthe five most popular major fields (biologicalsciences, business, health professions, engineering, and social science), students interestedin the health professions were the most likely toconsider the academic reputation of their majoras a very important reason in selecting theircurrent institution (67.4%), nearly a full tenpercentage points higher than students planningon majoring in biological sciences (58.8%) orengineering (56.8%). Less than half of studentsplanning to major in business or social sciencesconsidered the academic reputation of theirmajor as a very important reason in selectingtheir current institution (49.8% and 45.5%,respectively).Looking more closely, we see a lot of variationby major within academic fields. For example,in the Health Professions, students interestedin majoring in Nursing (75.3%), Pharmacy(72.8%), and Health Technology (71.2%) weremost likely to consider the academic reputation of the major as a very important factorin their choice of institution. In fact, of allthe largest individual majors, Nursing had the In 2015, HERI added a gender identity question that continues to evolve. Throughout this monograph, weuse the term “men” to refer to those who selected “Man/Trans Man” on the survey and “women” for thosewho selected “Woman/Trans Woman.” The weighted data used in the monograph are created using enrollment data broken out by sex (reported by either the institution or by IPEDS). This sex data is only reportedfor men and women. Therefore, students who selected “Genderqueer/Gender non-conforming” or “Identitynot listed above” are not included in these analyses.
Figure 3. Importance of Academic Reputation of Intended Major in College Choice, by Major Field(% Very important)Health Professions*EducationLibrary ScienceFine ArtsAgricultureBiological Sciences*Engineering*Justice and SecurityOther Non-technicalMathematics or Computer ScienceArt and HumanitiesPhysical ScienceBusiness*History or Political ScienceSocial 050607080% of Students*Most common fields for incoming freshmenhighest proportion of students who considered the academic reputation of the major asvery important in their college choice. Theother fields showed variation as well. Withinthe Biological Sciences, students selectingOther Biological Science (70.0%); Molecular,Cellular, & Developmental Biology (68.8%);Neurobiology/Neuroscience (60.4%); orMicrobiology (60.2%) were most likely toconsider the academic reputation of the major asa very important factor in their college choice.By contrast, in Engineering, those in BiomedicalEngineering were most likely (62.9%), followedby Aerospace/Aeronautical/AstronauticalEngineering (62.5%), and Biological/Agricultural Engineering (58.2%) to feel thesame. Within Business fields, those in Finance(56.5%), Other Business (53.3%), Marketing(52.6%), or Accounting (51.5%) were mostlikely to consider the major’s academic reputation very important, but none higher than sixtypercent. It should be noted that other popularindividual majors in which at least two-thirdsof students considered the academic reputationof the major as a very important factor in theircollege choice include Music (72.2%) andElementary Education (68.6%).Nearly three-quarters of first-time full-timestudents aspire to eventually earn a graduateor professional degree (70.0%). These studentsare more likely than those whose goal is abachelor’s degree to consider the academicreputation of their major as a very importantreason for choosing their institution, perhapsindicating that entering students who aspire toa post-baccalaureate degree are already considering how their current institution might helpprepare them for graduate school admissionand success. While both are more likely thanthose who aspire to a bachelor’s degree (48.4%),students who intend to pursue a master’s degreeare less likely to consider the academic reputation of their major as a very important reasonin choosing their current institution (54.6%)compared to students aspiring to doctoral-levelgraduate degrees (58.0%).5
Communication with a professor less salientoverall but varies by first-generation status,race/ethnicity, and ultimate degree objectiveAnother item introduced on the 2019 CIRPFreshman Survey for this set of questions,“communication with a professor,” was notquite as pertinent to students, with fewer than aquarter (21.5%) identifying this as a very important reason in choosing to attend their currentinstitution. While not as influential as some ofthe other reasons students choose their institution, there was variation by demographics andpersonal characteristics, such as first-generationstatus, race/ethnicity, and ultimate degreeobjective.the application and decision-making processprovided necessary information or even a senseof belonging for students who may be thefirst in their family to go to college. Further,students of different racial/ethnic backgroundshad a range of responses for this item. NativeAmerican (27.0%), Black (26.6%), Other race(25.8%), and Latina/o/x (24.1%) students weremost likely to consider communication witha professor as a very important factor in theirchoice to attend their current institution. Bycontrast, Asian (18.4%), White (20.9%), andmultiracial (20.5%) students were least likely tofeel the same.Communication with a professor was moreimportant for students whose parents/guardiansdid not attend college at all (first-generationcollege students) than for those whose parents/guardians have at least some college (24.1%and 20.7% very important, respectively).Perhaps reaching out to a faculty member orhaving a faculty member initiate contact duringOnly one in five (20.2%) students who aspire toat most a bachelor’s degree considered communication with a professor a very important factorin their college choice. Amongst first-time fulltime students aspiring to a post-baccalaureatedegree, those who plan on obtaining a professional doctorate (Ed.D., Psy.D., etc.) are themost likely to consider communication with aprofessor a very important reason in selectingFigure 4. Importance of Communication with a Professor in College Choice, by Ultimate Degree Objective(% Very important)3027.3% of Students2520.220.4Bachelor’s degreeor lessJ.D. (Law)21.421.6Master’s degree(M.A., M.S., M.B.A.,etc.)M.D., D.D.S., D.V.M.,etc. d.D., Psy.D., etc.)
their current institution (27.3%) comparedto Ph.D. (23.2%), medical degree (21.6%),master’s degree (21.4%), and law degree (20.4%)aspirants (see Figure 4).Greater Financial Concerns andIncreased Likelihood to Get a JobAcross All Income LevelsFinancial concerns have increased amongstincoming first-year students in the last severalyears. In 2015, 12.0% of students reportedthey had major concerns and were not sure theywould have enough funds to complete college.This figure went up slightly for students in2019, with 12.5% reporting major financialconcerns. There is a similar increase amongststudents who say they have some concerns butwill probably have enough funds, with 52.5%reporting this perspective in 2015 compared to55.8% in 2019. Accordingly, the proportion ofstudents who say they have no concerns and areconfident that they will have sufficient fundshas decreased from 35.3% in 2015 to 31.6% in2019. With these increasing financial concernsin mind, it is essential to examine how thesethemes relate to income and job intentions.In 2015, 15.1% of incoming freshmen had afamily income less than 30,000, and the vastmajority (84.4%) of these students had someconcerns or major concerns about their abilityto finance college. A slightly larger proportionof students reported their income as less than 30,000 in 2019 (17.2%) than in 2015, but theproportion with some or major financial concernremained similar (85.7%). One-fifth (19.3%)of incoming students in 2015 reported incomebetween 30,000– 59,999, and 79.7% of thesestudents had some/major financial concerns. In2019, a smaller proportion of students (15.4%)have family income in this range, yet an evenlarger proportion of them (84.7%) have thesesame financial concerns. Amongst students withhousehold income of 60,000– 99,999 (21.6%)entering in 2015, 71.5% reported financialconcerns. Five years later, the proportion ofstudents in this income bracket has held consistent (22.0%), yet now more than three-quarters(76.7%) of freshmen express some or majorconcerns. In 2015, 18.4% of incoming first-yearstudents came from households with an incomein the 100,000– 149,999 range. Of those,61.7% had some/major financial concerns. Aslightly higher proportion (21.1%) of studentsfall in this income range in 2019, with 65.4%reporting financial concerns. Finally, in 2015,amongst the one-quarter (25.5%) of studentswho come from families who had an income of 150,000 and above, 37.8% had at least somefinancial concerns. About the same proportion(24.3%) of students are from households inthis bracket in 2019, yet a greater proportion(42.3%) of these students have this level offinancial concern. Overall, income levels haveremained relatively constant from 2015 to 2019.That said, there have been slight increases infinancial concern between 2015 and 2019 acrossall income levels (Figure 5).Along with greater financial concern, studentsentering college in 2019 report an increasedlikelihood of getting a job to help pay for collegeexpenses compared to their 2015 counterparts.In 2015, 46.3% of incoming students saidthere was a very good chance they would get ajob. This figure increased by nine percentagepoints for 2019 students, with over half (55.3%)reporting a very good chance they would get ajob. Similarly, 10.2% of students starting collegein 2015 said there was no chance they wouldget a job. This figure is cut in half this year, withonly 5.3% reporting no chance of getting a job7
Figure 5. Financial Concern by Family Income, 2015 and 2019(% Responding “Some” or “Major” Concern)9084.485.78079.784.771.5% of Students7076.761.76065.45037.84042.33020100Less than 30K 30K– 59,999K 60K– 99,999K2015 150K and above2019to help pay for college expenses. With this trendestablished, notable patterns also emerge whencomparing job intentions across income levels.It is not surprising that the greater a student’sfamily income level, the lower the likelihood thatthey plan to get a job to pay for college expenses.Even so, students across all income levels reportgreater job intentions in 2019 than they did in2015 (see Figure 6). Yet as more students reportthat they plan to get a job to help pay for collegeexpenses across all income levels, it is importantto note that students are differentially impactedby the decision to work. Working students fromlow-income backgrounds experience challengesthat their higher-income peers do not, suchas working longer hours and working in positions that are not related to their field of study(Georgetown University Center on Educationand the Workforce, 2018).In 2015, 57.1% of students from householdsthat made 30,000 or less said there was avery good chance they would get a job. Thisfigure increased to 63.8% in 2019, an increaseof nearly seven percentage points. Amongst8 100K– 149,999Kstudents from households that made between 30,000– 59,999 in 2015, 55.9% anticipated avery good chance they would get a job. In 2019,this proportion jumps to 64.3%, an increase ofmore than eight percentage points. Over half(52.0%) of students entering college in 2015in the 60,000– 99,9999 income bracketsaid there was a very good chance they wouldget a job. This figure increased by over tenpercentage points (62.5%) for students in 2019.Meanwhile, 44.0% of students from households that made 100,000– 149,999 enteringin 2015 anticipated a very good chance theywould get a job. There was another substantialincrease in 2019, with 54.9% of students at thisincome level reporting a very good chance of jobattainment. Finally, in 2015, less than one-third(29.4%) of students from households that make 150,000 and above believed there was a verygood chance they would get a job. Despite theirhigh family income, there was also a notablejump amongst students entering college in 2019,with 38.1% of students in this bracket sayingthere is a very good chance they will get a job.
Figure 6. Job Intentions by Family Income, 2015 and 2019(% Responding “Very Good Chance”)70% of 29.43020100Less than 30K 30K– 59,999K 60K– 99,999K2015Physical and Emotional Health onDownward Trend Regardless of GenderUnderstanding students’ health can help usestablish ways to better support them in findinga balance between their school workload, sociallife, and other various responsibilities, whileremaining healthy both physically and emotionally. The CIRP Freshman Survey historicaltrends (Eagan, Stolzenberg, Ramirez, Aragon,Suchard, & Rios-Aguilar, 2016) show that from1985 to the present, incoming college students’self-reported physical and emotional health havecontinued to decline. For example, Figure 7shows that both men and women’s physicaland emotional health have been on a consistentdecline since 2015. In 2015, 66.0% of menand 46.3% of women reported their physicalhealth as above average, while in 2019, 60.8%of men and 43.5% of women reported such.Additionally, in 2015, 59.0% of men and 43.7%of women reported their emotional health asabove average, while in 2019, 50.4% of menand 34.0% of women reported such. Possiblereasons for this consistent decline include: anincreasingly competitive market in accessing andpersisting in college, the influx of technologyand social media, etc. Furthermore, the percent 100K– 149,999K 150K and above2019of students who reported above average physicalhealth decreased when considering emotionaland physical health together. For example,while a total of 48.8% of students reportedabove average physical health, only 28.2% ofstudents reported above average physical andemotional health. Examining the reasons behindthe continual downward trend in students’physical and emotional health, as well as theeffects of emotional health on physical health,and vice versa, could help institutional leadersin implementing programming and resources topromote better habits to improve physical andemotional health.In addition to the downward trend of students’self-reported physical and emotional health,we also see how physical health is related tostudents’ physical activity. Surprisingly, alarger proportion of students who rated theirphysical health as above average exercised sixto ten hours a week than those who exercisedover twenty hours. For example, while 19.3%of students who rated their physical health asabove average exercised six to ten hours a week,17.1% of students who rated their physicalhealth as above average exercised over twentyhours a week. Interestingly, 16.5% of students9
Figure 7. Self-rated Physical and Emotional Health, by Gender, 2015–2019(% Above Average or Highest 10%)70Physical Health—Men60Emotional Health—Men% of Students50Physical Health—Women40Emotional Health—Women302010020152016Physical Health—Women2017Physical Health—Men2018Emotional Health—Womenwho rated their physical health as above averagereported exercising three to five hours a weekwhile another 16.5% of students who rated theirphysical health as above average reported exercising eleven to fifteen hours a week. Becausethe largest proportion of students who ratedtheir physical health as above average exercisedin the mid-range of six to ten hours a week,these results indicate the importance of finding ahealthy balance in exercising or playing sports toimprove physical health.Time Spent Exercising/Playing SportsVaries by Socioeconomic StatusThe
is how they will pay for college. Most first-generation students (61.4%) said they had some concern about funding college and an additional 22.0% indicated they had major concerns about paying for college. On the other hand, only 54.5% students whose parents had at least some college had some concern and 9.8% had major concerns about funding .