Transcription
Troubleshoot the JVM like never beforeJVM TroubleshootingGuidePierre-Hugues CharbonneauIlias Tsagklis
JVM Troubleshooting Handbookwww.javacodegeeks.comTable of ContentsOracle HotSpot JVM Memory.3Java HotSpot VM Heap space.3Java HotSpot VM PermGen space.4IBM JVM Memory. 6Oracle JRockit JVM Memory.7Tips for proper Java Heap size.8Java Threading: JVM Retained memory analysis.14Java 8: From PermGen to Metaspace.21HPROF - Memory leak analysis with Eclipse Memory Analyzer Tool (MAT).26JVM verbose GC output tutorial.33Analyzing thread dumps. 40Introduction to thread dump analysis. 40Thread Dump: Thread Stack Trace analysis.47Java Thread CPU analysis on Windows.49Case Study - Too many open files.54GC overhead limit exceeded – Analysis and Patterns.58Java deadlock troubleshooting and analysis. 69Java Thread deadlock - Case Study. 73Java concurrency: the hidden thread deadlocks.79OutOfMemoryError patterns.85OutOfMemoryError: Java heap space - what is it?.86OutOfMemoryError: Out of swap space - Problem Patterns.87OutOfMemoryError: unable to create new native thread.89ClassNotFoundException: How to resolve.93NoClassDefFoundError Problem patterns. 99NoClassDefFoundError – How to resolve. 103NoClassDefFoundError problem case 1 - missing JAR file. 105NoClassDefFoundError problem case 2 - static initializer failure. 1132 of 127
JVM Troubleshooting Handbookwww.javacodegeeks.comOracle HotSpot JVM MemoryJava HotSpot VM Heap spaceThis section will provide you with a high level overview of the different Java Heap memory spaces ofthe Oracle Java HotSpot VM. This understanding is quite important for any individual involved inproduction support given how frequent memory problems are observed. Proper knowledge of the JavaVM Heap Space is critical.Your Java VM is basically the foundation of your Java program which provides you with dynamicmemory management services, garbage collection, Threads, IO and native operations and more.The Java Heap Space is the memory "container" of you runtime Java program which provides to yourJava program the proper memory spaces it needs (Java Heap, Native Heap) and managed by theJVM itself.The JVM HotSpot memory is split between 3 memory spaces: The Java Heap The PermGen (permanent generation) space The Native Heap (C-Heap)Here is the breakdown for each one of them:Memory SpaceJava HeapStart-up argumentsand tuningMonitoring strategies-Xmx (maximum Heapspace)- verbose GC- JMX API- JConsole- Other monitoring toolsThe Java Heap isstoring your primaryJava program Classinstances.- verbose GC- JMX API- JConsole- Other monitoring toolsThe Java HotSpot VMpermanent generationspace is the JVMstorage used mainly tostore your Java Classobjects such as namesand method of theClasses, internal JVMobjects and other JIToptimization related-Xms (minimum X:MaxPermSize(maximum size)-XX:PermSize(minimum size)EX:XX:MaxPermSize 5123 of 127
JVM Troubleshooting HandbookNative Heap(C-Heap)www.javacodegeeks.comm-XX:PermSize 256mdata.Not configurabledirectly.The C-Heap is storingobjects such as MMAPfile, other JVM and thirdparty native codeobjects.- Total process sizecheck in Windows andLinuxFor a 32-bit VM, the C- - pmap command onHeap capacity 4 Gig – Solaris & LinuxJava Heap - PermGen - svmon command onAIXFor a 64-bit VM, the CHeap capacity Physical server totalRAM & virtual memory– Java Heap - PermGenJava Heap Space - Overview & life cycleYour Java program life cycle typically looks like this: Java program coding (via Eclipse IDE etc.) e.g. HelloWorld.javaJava program compilation (Java compiler or third party build tools such as Apache Ant, ApacheMaven.) e.g. HelloWord.classJava program start-up and runtime execution e.g. via your HelloWorld.main() methodNow let's dissect your HelloWorld.class program so you can better understand. At start-up, your JVM will load and cache some of your static program and JDK libraries to theNative Heap, including native libraries, Mapped Files such as your program Jar file(s), Threadssuch as the main start-up Thread of your program etc.Your JVM will then store the "static" data of your HelloWorld.class Java program to thePermGen space (Class metadata, descriptors, etc.).Once your program is started, the JVM will then manage and dynamically allocate the memoryof your Java program to the Java Heap (YoungGen & OldGen). This is why it is so importantthat you understand how much memory your Java program needs to you can properly finetuned the capacity of your Java Heap controlled via -Xms & -Xmx JVM parameters. Profiling,Heap Dump analysis allow you to determine your Java program memory footprint.Finally, the JVM has to also dynamically release the memory from the Java Heap Space thatyour program no longer need; this is called the garbage collection process. This process canbe easily monitored via the JVM verbose GC or a monitoring tool of your choice such asJconsole.Java HotSpot VM PermGen spaceThe Java HotSpot VM permanent generation space is the JVM storage used mainly to store your JavaClass objects. The Java Heap is the primary storage that is storing the actual short and long term4 of 127
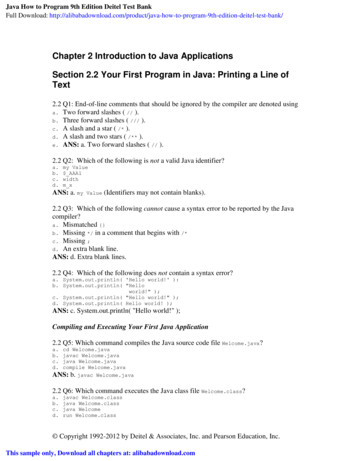
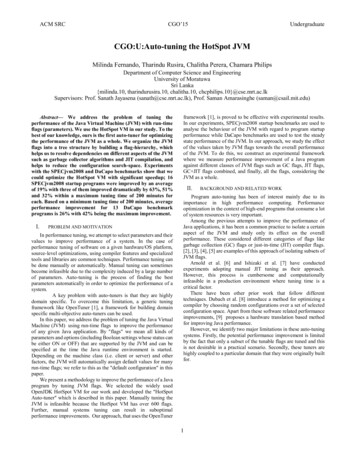
JVM Troubleshooting Handbookwww.javacodegeeks.cominstances of your PermGen Class objects.The PermGen space is fairly static by nature unless using third party tool and/or Java Reflection APIwhich relies heavily on dynamic class loading.It is important to note that this memory storage is applicable only for a Java HotSpot VM; other JVMvendors such as IBM and Oracle JRockit do not have such fixed and configurable PermGen storageand are using other techniques to manage the non Java Heap memory (native memory).Find below a graphical view of a JVM HotSpot Java Heap vs. PermGen space breakdown along withits associated attributes and capacity tuning arguments.Apart from the Oracle HotSpot JVM, there are other virtual machines provided by differented vendors.The following sections examine the memory configurations used by other JVMs. Understanding thoseis quite important given the implementation and naming convention differences between HotSpot and5 of 127
JVM Troubleshooting Handbookwww.javacodegeeks.comthe other JVMs.IBM JVM MemoryThe IBM VM memory is split between 2 memory spaces: The Java Heap (nursery and tenured spaces)The Native Heap (C-Heap)Here is the breakdown for each one of them:Memory SpaceJava HeapStart-up argumentsand tuning-Xmx (maximum Heapspace)Monitoring strategies- verbose GC- JMX API- IBM monitoring tools-Xms (minimum Heapsize)- verbose GC- JMX API- IBM monitoring toolsDescriptionThe IBM Java Heap istypically split betweenthe nursery and tenuredspace (YoungGen,OldGen).The gencon GC policy(combo of concurrentand generational GC) istypically used for JavaEE platforms in order tominimize the GC pausetime.EX:-Xmx1024m-Xms1024mGC policy Ex:-Xgcpolicy:gencon(enable gencon GCpolicy)Native Heap(C-Heap)Not configurabledirectly.For a 32-bit VM, the CHeap capacity 4 Gig –Java Heap- svmon commandThe C-Heap is storingclass metadata objectsincluding library files,other JVM and thirdparty native codeobjects.For a 64-bit VM, the CHeap capacity Physical server totalRAM & virtual memory– Java HeapAs you might noticed, there is no PermGen space for the IBM VM. The PermGen space is onlyapplicable to the HotSpot VM. The IBM VM is using the Native Heap for Class metadata related data.6 of 127
JVM Troubleshooting Handbookwww.javacodegeeks.comAlso note that Oracle is also starting to remove the PermGen space for the HotSpot VM, as we willdiscuss in a next section.Oracle JRockit JVM MemoryThe JRockit VM memory is split between 2 memory spaces: The Java Heap (YoungGen and OldGen)The Native memory space (Classes pool, C-Heap, Threads.)Memory SpaceJava HeapStart-up argumentsand tuning-Xmx (maximum Heapspace)-Xms (minimum Heapsize)Monitoring strategiesDescription- verbose GC- JMX API- JRockit MissionControl tools suiteThe JRockit Java Heapis typically split betweenthe YoungGen (shortlived objects), OldGen(long-lived objects).- Total process sizecheck in Windows andLinux- pmap command onSolaris & Linux- JRockit JRCMD toolThe JRockit Nativememory space isstoring the JavaClasses metadata,Threads and objectssuch as library files,other JVM and thirdparty native codeobjects.EX:-Xmx1024m-Xms1024mNative memory spaceNot configurabledirectly.For a 32-bit VM, thenative memory spacecapacity 2-4 Gig –Java Heap** Process size limit of 2GB, 3 GB or 4 GBdepending of your OS**For a 64-bit VM, thenative memory spacecapacity Physicalserver total RAM &virtual memory – JavaHeapSimilar to the IBM VM, there is no PermGen space for the JRockit VM. The PermGen space is onlyapplicable to the HotSpot VM. The JRockit VM is using the Native Heap for Class metadata relateddata.7 of 127
JVM Troubleshooting Handbookwww.javacodegeeks.comThe JRockit VM tend to uses more native memory in exchange for better performance. JRockit doesnot have an interpretation mode, compilation only, so due to its additional native memory needs theprocess size tends to use a couple of hundred MB larger than the equivalent Sun JVM size. Thisshould not be a big problem unless you are using a 32-bit JRockit with a large Java Heap requirement;in this scenario, the risk of OutOfMemoryError due to Native Heap depletion is higher for a JRockit VM(e.g. for a 32-bit VM, bigger is the Java Heap, smaller is memory left for the Native Heap).Oracle's strategy, being the vendor for both HotSpot and JRockit product lines, is to merge the twoVms to a single JVM project that will include the best features of each one. This will also simplify JVMtuning since right now failure to understand the differences between these 2 VM's can lead to badtuning recommendations and performance problems.Tips for proper Java Heap sizeDetermination of proper Java Heap size for a production system is not a straightforward exercise.Multiple performance problem can occur due to inadequate Java Heap capacity and tuning. Thissection will provide some tips that can help you determine the optimal Java heap size, as a startingpoint, for your current or new production environment. Some of these tips are also very usefulregarding the prevention and resolution of OutOfMemoryError problems, including memory leaks.Please note that these tips are intended to “help you” determine proper Java Heap size. Since each ITenvironment is unique, you are actually in the best position to determine precisely the required JavaHeap specifications of your client’s environment.#1 - JVM: you always fear what you don't understandHow can you expect to configure, tune and troubleshoot something that you don't understand? Youmay never have the chance to write and improve Java VM specifications but you are still free to learnits foundation in order to improve your knowledge and troubleshooting skills. Some may disagree, butfrom my perspective, the thinking that Java programmers are not required to know the internal JVMmemory management is an illusion.Java Heap tuning and troubleshooting can especially be a challenge for Java & Java EE beginners.Find below a typical scenario: Your client production environment is facing OutOfMemoryError on a regular basis and causinglot of business impact. Your support team is under pressure to resolve this problem.A quick Google search allows you to find examples of similar problems and you now believe(and assume) that you are facing the same problem.You then grab JVM -Xms and -Xmx values from another person OutOfMemoryError problemcase, hoping to quickly resolve your client's problem.You then proceed and implement the same tuning to your environment. 2 days later you realizeproblem is still happening (even worse or little better).the struggle continues.What went wrong?8 of 127
JVM Troubleshooting Handbook www.javacodegeeks.comYou failed to first acquire proper understanding of the root cause of your problem.You may also have failed to properly understand your production environment at a deeper level(specifications, load situation etc.). Web searches is a great way to learn and share knowledgebut you have to perform your own due diligence and root cause analysis.You may also be lacking some basic knowledge of the JVM and its internal memorymanagement, preventing you to connect all the dots together.My #1 tip and recommendation to you is to learn and understand the basic JVM principles along withits different memory spaces. Such knowledge is critical as it will allow you to make validrecommendations to your clients and properly understand the possible impact and risk associated withfuture tuning considerations.As a reminder, the Java VM memory is split up to 3 memory spaces: The Java Heap: Applicable for all JVM vendors, usually split between YoungGen (nursery) &OldGen (tenured) spaces.The PermGen (permanent generation): Applicable to the Sun HotSpot VM only (PermGenspace will be removed in future Java updates)The Native Heap (C-Heap): Applicable for all JVM vendors.As you can see, the Java VM memory management is more complex than just setting up the biggestvalue possible via –Xmx. You have to look at all angles, including your native and PermGen spacerequirement along with physical memory availability (and # of CPU cores) from your physical host(s).It can get especially tricky for 32-bit JVM since the Java Heap and native Heap are in a race. Thebigger your Java Heap, the smaller the native Heap. Attempting to setup a large Heap for a 32-bit VMe.g .2.5 GB increases risk of native OutOfMemoryError depending of your application(s) footprint,number of Threads etc. 64-bit JVM resolves this problem but you are still limited to physical resourcesavailability and garbage collection overhead (cost of major GC collections go up with size). The bottomline is that the bigger is not always the better so please do not assume that you can run all your 20Java EE applications on a single 16 GB 64-bit JVM process.9 of 127
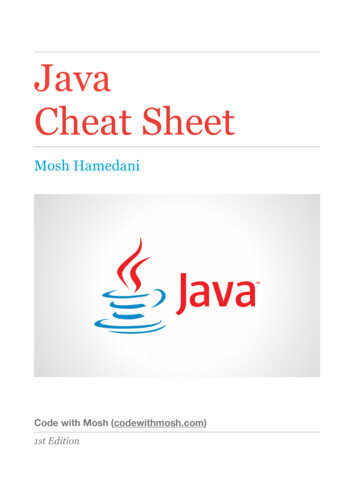
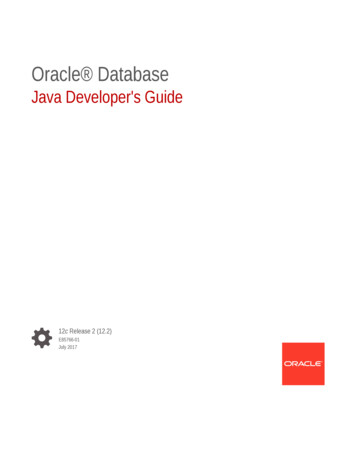
JVM Troubleshooting Handbookwww.javacodegeeks.com#2 - Data and application is king: review your static footprint requirementYour application(s) along with its associated data will dictate the Java Heap footprint requirement. Bystatic memory, I mean "predictable" memory requirements as per below. Determine how many different applications you are planning to deploy to a single JVM processe.g. number of EAR files, WAR files, jar files etc. The more applications you deploy to a singleJVM, higher demand on native Heap.Determine how many Java classes will be potentially loaded at runtime; including third partAPI's. The more class loaders and classes that you load at runtime, higher demand on theHotSpot VM PermGen space and internal JIT related optimization objects.Determine data cache footprint e.g. internal cache data structures loaded by your application(and third party API's) such as cached data from a database, data read from a file etc. Themore data caching that you use, higher demand on the Java Heap OldGen space.Determine the number of Threads that your middleware is allowed to create. This is veryimportant since Java threads require enough native memory or OutOfMemoryError will bethrown.For example, you will need much more native memory and PermGen space if you are planning todeploy 10 separate EAR applications on a single JVM process vs. only 2 or 3. Data caching not10 of 127
JVM Troubleshooting Handbookwww.javacodegeeks.comserialized to a disk or database will require extra memory from the OldGen space.Try to come up with reasonable estimates of the static memory footprint requirement. This will be veryuseful to setup some starting point JVM capacity figures before your true measurement exercise (e.g.tip #4). For 32-bit JVM, I usually do not recommend a Java Heap size high than 2 GB (-Xms2048m,-Xmx2048m) since you need enough memory for PermGen and native Heap for your Java EEapplications and threads.This assessment is especially important since too many applications deployed in a single 32-bit JVMprocess can easily lead to native Heap depletion; especially in a multi threads environment.For a 64-bit JVM, a Java Heap size of 3 GB or 4 GB per JVM process is usually my recommendedstarting point.#3 - Business traffic set the rules: review your dynamic footprint requirementYour business traffic will typically dictate your dynamic memory footprint. Concurrent users & requestsgenerate the JVM GC "heartbeat" that you can observe from various monitoring tools due to veryfrequent creation and garbage collections of short & long lived objects. As you saw from the aboveJVM diagram, a typical ratio of YoungGen vs. OldGen is 1:3 or 33%.For a typical 32-bit JVM, a Java Heap size setup at 2 GB (using generational & concurrent collector)will typically allocate 500 MB for YoungGen space and 1.5 GB for the OldGen space.Minimizing the frequency of major GC collections is a key aspect for optimal performance so it is veryimportant that you understand and estimate how much memory you need during your peak volume.Again, your type of application and data will dictate how much memory you need. Shopping cart typeof applications (long lived objects) involving large and non-serialized session data typically need largeJava Heap and lot of OldGen space. Stateless and XML processing heavy applications (lot of shortlived objects) require proper YoungGen space in order to minimize frequency of major collections.Example: You have 5 EAR applications ( 2 thousands of Java classes) to deploy (which includemiddleware code as well.).Your native heap requirement is estimated at 1 GB (has to be large enough to handle Threadscreation etc.).Your PermGen space is estimated at 512 MB.Your internal static data caching is estimated at 500 MB.Your total forecast traffic is 5000 concurrent users at peak hours.Each user session data footprint is estimated at 500 K.Total footprint requirement for session data alone is 2.5 GB under peak volume.As you can see, with such requirement, there is no way you can have all this traffic sent to a singleJVM 32-bit process. A typical solution involves splitting (tip #5) traffic across a few JVM processes and/ or physical host (assuming you have enough hardware and CPU cores available).11 of 127
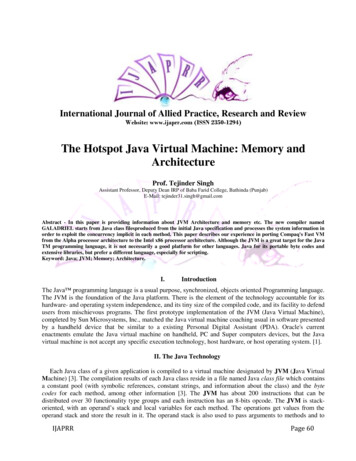
JVM Troubleshooting Handbookwww.javacodegeeks.comHowever, for this example, given the high demand on static memory and to ensure a scalableenvironment in the long run, I would also recommend 64-bit VM but with a smaller Java Heap as astarting point such as 3 GB to minimize the GC cost. You definitely want to have extra buffer for theOldGen space so I typically recommend up to 50% memory footprint post major collection in order tokeep the frequency of Full GC low and enough buffer for fail-over scenarios.Most of the time, your business traffic will drive most of your memory footprint, unless you needsignificant amount of data caching to achieve proper performance which is typical for portal (media)heavy applications. Too much data caching should raise a yellow flag that you may need to revisitsome design elements sooner than later.#4 - Don't guess it, measure it!At this point you should: Understand the basic JVM principles and memory spacesHave a deep view and understanding of all applications along with their characteristics (size,type, dynamic traffic, stateless vs. stateful objects, internal memory caches etc.)Have a very good view or forecast on the business traffic (# of concurrent users etc.) and foreach applicationSome ideas if you need a 64-bit VM or not and which JVM settings to start withSome ideas if you need more than one JVM (middleware) processesBut wait, your work is not done yet. While this above information is crucial and great for you to comeup with "best guess" Java Heap settings, it is always best and recommended to simulate yourapplication(s) behaviour and validate the Java Heap memory requirement via proper profiling, load &performance testing.You can learn and take advantage of tools such as JProfiler. From my perspective, learning how touse a profiler is the best way to properly understand your application memory footprint. Anotherapproach I use for existing production environments is heap dump analysis using the Eclipse MATtool. Heap Dump analysis is very powerful and allow you to view and understand the entire memoryfootprint of the Java Heap, including class loader related data and is a must do exercise in anymemory footprint analysis; especially memory leaks.12 of 127
JVM Troubleshooting Handbookwww.javacodegeeks.comJava profilers and heap dump analysis tools allow you to understand and validate your applicationmemory footprint, including detection and resolution of memory leaks. Load and performance testingis also a must since this will allow you to validate your earlier estimates by simulating your forecastconcurrent users. It will also expose your application bottlenecks and allow you to further fine tuneyour JVM settings. You can use tools such as Apache JMeter which is very easy to learn and use orexplore other commercial products.Finally, I have seen quite often Java EE environments running perfectly fine until the day where onepiece of the infrastructure start to fail e.g. hardware failure. Suddenly the environment is running atreduced capacity (reduced # of JVM processes) and the whole environment goes down. Whathappened?There are many scenarios that can lead to domino effects but lack of JVM tuning and capacity tohandle fail-over (short term extra load) is very common. If your JVM processes are running at 80% OldGen space capacity with frequent garbage collections, how can you expect to handle any fail-overscenario?Your load and performance testing exercise performed earlier should simulate such scenario and you13 of 127
JVM Troubleshooting Handbookwww.javacodegeeks.comshould adjust your tuning settings properly so your Java Heap has enough buffer to handle extra load(extra objects) at short term. This is mainly applicable for the dynamic memory footprint since fail-overmeans redirecting a certain % of your concurrent users to the available JVM processes (middlewareinstances).#5 - Divide and conquerAt this point you have performed dozens of load testing iterations. You know that your JVM is notleaking memory. Your application memory footprint cannot be reduced any further. You tried severaltuning strategies such as using a large 64-bit Java Heap space of 10 GB , multiple GC policies butstill not finding your performance level acceptable?In my experience I found that, with current JVM specifications, proper vertical and horizontal scalingwhich involved creating a few JVM processes per physical host and across several hosts will give youthe throughput and capacity that you are looking for. Your IT environment will also more fault tolerant ifyou break your application list in a few logical silos, with their own JVM process, Threads and tuningvalues.This "divide and conquer" strategy involves splitting your application(s) traffic to multiple JVMprocesses and will provide you with: Reduced Java Heap size per JVM process (both static & dynamic footprint)Reduced complexity of JVM tuningReduced GC elapsed and pause time per JVM processIncreased redundancy and fail-over capabilitiesAligned with latest Cloud and IT virtualization strategiesThe bottom line is that when you find yourself spending too much time in tuning that single elephant64-bit JVM process, it is time to revisit your middleware and JVM deployment strategy and takeadvantage of vertical & horizontal scaling. This implementation strategy is more taxing for thehardware but will really pay off in the long run.Java Threading: JVM Retained memory analysisHaving discussed the various heap spaces of the JVM, this section will provide you with a tutorialallowing you to determine how much and where Java heap space is retained from your activeapplication Java threads. A true case study from an Oracle Weblogic 10.0 production environment willbe presented in order for you to better understand the analysis process.We will also attempt to demonstrate that excessive garbage collection or Java heap space memoryfootprint problems are often not caused by true memory leaks but instead due to thread executionpatterns and high amount of short lived objects.BackgroundJava threads are part of the JVM fundamentals. Your Java heap space memory footprint is driven not14 of 127
JVM Troubleshooting Handbookwww.javacodegeeks.comonly by static and long lived objects but also by short lived objects.OutOfMemoryError problems are often wrongly assumed to be due to memory leaks. We oftenoverlook faulty thread execution patterns and short lived objects they "retain" on the Java heap untiltheir executions are completed. In this problematic scenario: Your "expected" application short lived / stateless objects (XML, JSON data payload etc.)become retained by the threads for too long (thread lock contention, huge data payload, slowresponse time from remote system etc.).Eventually such short lived objects get promoted to the long lived object space e.g.OldGen/tenured space by the garbage collector.As a side effect, this is causing the OldGen space to fill up rapidly, increasing the Full GC(major collections) frequency.Depending of the severity of the situation this can lead to excessive GC garbage collection,increased JVM paused time and ultimately “OutOfMemoryError: Java heap space”.Your application is now down, you are now puzzled on what is going on.Finally, you are thinking to either increase the Java heap or look for memory leaks.are youreally on the right track?In the above scenario, you need to look at the thread execution patterns and determine how muchmemory each of them retain at a given time.OK I get the picture but what about the thread stack size?It is very important to avoid any confusion between thread stack size and Java memory retention. Thethread stack size is a special memory space used by the JVM to store each method call. When athread calls method A, it "pushes" the call onto the stack. If method A calls method B, it gets alsopushed onto the stack. Once the method execution completes, the call is "popped" off the stack.The Java objects created as a result of such thread method calls are allocated on the Java heapspace. Increasing the thread stack size will definitely not have any effect. Tuning of the thread stacksize is normally required when dealing with java.lang.stackoverflowerror or “OutOfMemoryError:unable to create new native thread” problems.15 of 127
JVM Troubleshooting Handbookwww.javacodegeeks.comCase study and problem contextThe following analysis is based on a true production problem we investigated recently.1. Severe performance degradation was observed from a Weblogic 10.0 production environmentfollowing some changes to the user web interface (using Google Web Toolkit and JSON asdata payload).2. Initial analysis did reveal several occurrences of “OutOfMemoryError: Java heap space” errorsalong with excessive garbage collection. Java heap dump files were generated automatically (XX: HeapDumpOnOutOfMemoryError) following OOM events.3. Analysis of the verbose:gc logs did confirm full depletion of the 32-bit HotSpot JVM OldGenspace (1 GB capacity).4. Thread dump snapshots were also generated before and during the problem.5. The only pro
- Other monitoring tools The Java Heap is storing your primary Java program Class instances. PermGen -XX:MaxPermSize (maximum size)-XX:PermSize (minimum size) EX:-XX:MaxPermSize 512 - verbose GC - JMX API - JConsole - Other monitoring tools The Java HotSpot VM permanent generation space is the JVM storage used mainly to store your Java Class