Transcription
SAS is now once again a profitable airline. The SAS Group’s1994 income before taxes totaled 1,505 MSEK.During 1994, SAS focused on its core airline business and isnow putting all its resources into becoming one of the best andmost successful airlines in the world.SAS will serve its Scandinavian home market with an effective traffic system and a highly competitive air transportproduct.SAS carried 18,823,000 paying passengers in 1994, whichmakes SAS the third largest airline in Europe. In terms ofpassenger revenues, SAS is in fifth place in Europe and insecond place with regard to the number of flights.SAS must be profitable and operate unaided.In cooperation with other quality airlines, SAS will offer a global traffic systemand an attractive loyalty program.SAS’s top priority is safety. SAS followsthe airline industry’s highest level of safety regulations.A N N U A LR E P O R T1994SAS is first and foremost the business traveler’s airline. Thismeans that after absolute safety our priorities are punctualityand service. SAS was the most punctual airline in Europe in1994.Simplicity, choice and care are bywords for SAS’s relationshipwith its customers and all product development.SAS is developing one of the most ambitious environmentalprograms in the airline industry.SAS’s continued success will be achieved by motivated employees who take pride in their work and are inspired by andaccept responsibility for the company’s goals for high-qualityservice and profitability.
Chairman’s Statement .1President’s Statement.2Board of Directors’ Report.3SAS Group Statement of Income and Balance Sheet .14SAS Consortium Statement of Income and Balance Sheet .16Statements of Changes in Financial Position .18Notes to the Financial Statements.19Notes .21Auditors’ Report .31Five-Year Operational Summary and Graphs.32Five-Year Financial Summary .34SAS’s Vision.38Market Conditions .40The Airline Today and Tomorrow .42SAS International Hotels.50Group Overview.52Organization, Employees and Management .54Ownership Structure and Shares.56Board of Directors .58Assembly of Representatives, Auditors and Addresses .60The comments from passengers on pages 41–53 are extracts from interviewsconducted at Arlanda Airport, Fornebu Airport and Copenhagen Airport on December 9–13, 1994.PRODUCTION: SAS Corporate Relations, SAS Corporate Accounting and Intellecta AB.PHOTOGRAPHY : Johan Olsson, SAS bildarkiv, M.J. Llorden/NPS.PRINTING: Tryckindustri AB 1995. Printed on paper bearing the seal of the Swan,an independent Scandinavian environmental label.
C H A I R M A N’ S S T A T E M E N TA financiallysound SASFINANCIAL CONSOLIDATION COMPLETEDFrom the Board’s point of view, 1994 was characterizedby efforts to bring down the total risk in SAS to a levelwhere the company’s long-term survival could be guaranteed on a stand-alone basis. This will also ensureSAS’s ability to meet its commitment – to provide itsthree home markets with effective air transport services,and to meet its owners’ requirements for a return ontheir investments.The deregulation of European civil aviation hastaken place during a deep recession, which has resultedin major losses for the airline industry in recent years.Many national carriers, which are wholly or mainlystate-owned, are operating today with substantial financial support from their owners. SAS has protestedagainst this, since in a deregulated civil aviation marketwe cannot accept competition which is directly financedby the taxpayer.As a result of financial consolidation, the SAS Group’sequity/assets ratio rose from 21% at year-end 1993 to29% at the end of 1994.Following the sale of subsidiaries, hotel properties,and overcapacity in the aircraft fleet, the SAS Group’stotal assets have decreased by 8.5 billion SEK to approximately 35 billion SEK. Net debt has been reduced from14 billion to 6 billion SEK. The debt/equity ratio hastherefore fallen from 1.6 to 0.6.To sum up, the financial consolidation of SAS hasprovided – as was the intention – a satisfactory equity/assets ratio, a reasonable burden of debt, good liquidityand considerable financial flexibility.Return on equity amounted to 10% in 1994, whilereturn on capital employed was 7%. Although this is nota satisfactory level, it represents a big step in the rightdirection.Finally, I would like to thank SAS’s management andstaff for their excellent work during the year. It is mypersonal conviction that we now have a sound platformon which to build the future of SAS.FOCUS ON CORE BUSINESSFollowing four loss-making years and a main strategy –to find merger partners in Europe – which provedimpossible to implement, the Board was convinced thatthe level of risk in SAS was too high in several respects.The structure was fragmented and resources werespread among too many noncore activities. This meantthat the excellence of the primary function, the airlinebusiness, was not being given the priority it deserved. Inthe end, the financial exposure proved too great.SAS’s Board therefore decided to implement an extensive program of restructuring and consolidation duringthe year.This program had three main components: to focus onthe core business and discontinue noncore operations, toachieve a competitive level of costs in the airline operations, and to carry out a financial consolidation.The Board is of the opinion that the total risk in SASis now at a reasonable level.Stockholm, March 1995Bo BerggrenChairman of the Board1
P R E S I D E N T’ S S T A T E M E N TWe nowhave asound baseAir transport operations performed well during the year.Cost-cutting made a contribution, but we were alsohelped by the recovery in the international airline industry. This was particularly apparent in the second half ofthe year.During the year, SAS International Hotels started aclose cooperation with Radisson Hotels International,and some fifty hotels in Europe and the Middle Easthave been renamed Radisson SAS. In 1994 the hoteloperations reached break-even before capital gains.When I took up my post as president of SAS on April 1,1994, my immediate task was to implement the actionprogram initiated by my predecessor Jan Reinås. Thisprogram was designed to create a cost-effective corebusiness on which to base profitability. Nearly one yearlater, I can report that we are well on our way to completing this program.We have taken action to reduce operating expenseswhich will provide a full-year effect of 2 billion SEK. Theeffect achieved in 1994 was naturally less, since not all themeasures were initiated at the same time, and we have hadto pay a price in the form of restructuring costs of 1,005MSEK (530). According to the plan, it now remains for usto cut costs by a further 0.9 billion SEK by mid-1995.The financial restructuring program is now completed and surpassed its goals, since we were able to make anumber of sales at higher prices than anticipated.FORECASTDuring 1994 we have reviewed SAS’s strategies, based ona partly reassessed market scenario.Scandinavia has been given greater prominence inSAS’s strategy. It is the task of SAS as an independentcompany to serve the home market with an effective andin every way attractive air transport product. Reliablecooperation partners, with good traffic systems whichcomplement SAS, will be an important part of what wehave to offer. But we no longer regard the partners issueas a matter of survival.SAS has now established a sound base. In my opinionthe favorable trend in SAS’s results will continue in1995.SHARP IMPROVEMENT IN RESULTSThe SAS Group’s 1994 income before taxes amounted to1,505 MSEK (–492).Operating income (before depreciation, etc.) rose to3,404 MSEK (2,032). Operating revenue in the airlinebusiness and hotel operations amounted to 33,851 MSEK(31,471). The SAS Group’s net financial items includingexchange rate differences improved to –668 MSEK(–1,313).The new depreciation principles introduced by SASin 1994, resulted in a 613 MSEK charge against income.SAS previously applied the reducing balance depreciation method but has now introduced the same principlesas most of the airline industry: straight-line depreciationover 15 years with 10% residual value.Through the restructuring program carried out during the year, SAS has focused on its core business – airtransport and the naturally related trading and hoteloperations.Stockholm, March 1995Jan StenbergPresident andChief Executive Officer2
B O A R D O F D I R E C T O R S’ R E P O R TBoard of Directors’ ReportReport by the Board of Directors and the President for the fiscal year January 1 – December 31, 1994.THE SAS GROUP 1994The SAS Group’s financial statements are prepared in accordance with International Accounting Standards.(Figures in parentheses refer to 1993.)THE SAS GROUPbusiness. SAS Leisure was sold in May 1994 to AirtoursPlc. with a capital gain of 363 MSEK.In June, SAS Service Partner was sold to Gate Gourmet International with a capital gain of 256 MSEK.Diners Club Nordic was transferred to Skandinaviska Enskilda Banken in August 1994, the capitalgain was 147 MSEK.Until the dates they were sold, the above-namedunits contributed 212 MSEK to the SAS Group’s incomebefore the sale of flight equipment and shares, etc.The SAS Group’s operating revenue amounted to 36,886MSEK (39,122). Adjusted for units sold, operating revenue totaled 33,851 MSEK (31,471), an increase of nearly8%. Operating income before depreciation, etc. amounted to 3,404 MSEK (2,032). Operating expenses for comparable units rose by 1 % excluding restructuring costsof 1,005 MSEK (530), and income before depreciation,etc. rose from 1,597 MSEK to 3,019 MSEK.Depreciation was 2,000 MSEK (1,782), representingan increase due primarily to the changed depreciationmethod for aircraft. (See Note 1.)After shares of income in affiliated companies of –13MSEK (–1), income after depreciation, etc. amounted to1,391 MSEK (249).The action program in the airline operations wascompleted during 1994 although there was some delaycompared with the original plan. These measures had apositive effect on costs, however. In addition to increasedtraffic and rising yields, this helped improve incomeafter depreciation, etc., in spite of restructuring costsand increased depreciation of 613 MSEK due to thechanged depreciation method being charged againstincome. Excluding these costs, the improvement inresults was 2,230 MSEK.Net financial items amounted to –761 MSEK(–1,322). In addition, net exchange rate differencestotaled 93 MSEK (–801). The substantially reduced netdebt during the year helped reduce negative net interestincome.The development of net financial items and net debtis described in more detail in the section “FinancialOverview.”Income after financial items but before minorityshares was 723 MSEK (–1,064).Gain on the sale of flight equipment and shares, etc.,includes the sale of units which did not belong to the coreIncome and Key Ratios (MSEK)Operating revenueOperating expenseOperating income beforedepreciation, etc.DepreciationShare of income inaffiliated companiesIncome after depreciation, etc.Financial items, netExchange rate differences, netRealized exchange gains onthe sale and leaseback of aircraftIncome after financial itemsMinority shares in incomeafter financial itemsIncome before the sale of flightequipment and shares, etc.Gain on the sale of flightequipment and shares, etc.Provisions to reserve for declinein value of hotel investmentsIncome before taxesKey RatiosInvestmentsReturn on capital employed, %Return on equity, %Equity/assets ratio, %Debt/equity ratioAverage number of neg.211.637,330Nord-Norsk Hotelldrift AS and SAS Royal Hotel inBrussels, were sold during the year. SAS International3
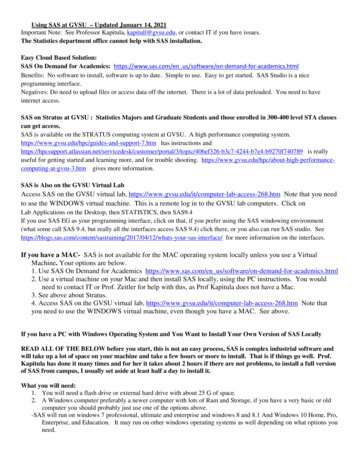
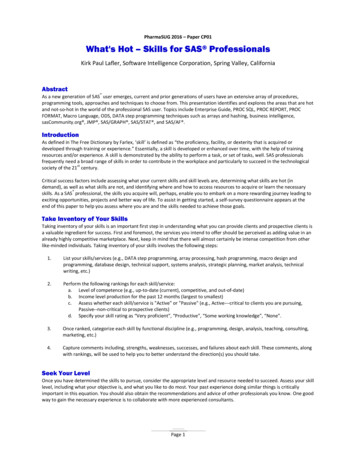
B O A R D O F D I R E C T O R S’ R E P O R TMSEKSAS GroupIncome Before TaxesSAS GroupIncome After Depreciationand Affiliated 0–2,000–500–3,000–1,000Mar 92Mar 93Mar 92Mar 94 Dec 94Mar 93Mar 94 Dec 94Income per quarterRolling 12-month trendIncome per quarterRolling 12-month trendleaseback of five Boeing 767-300s in December 1993, and2,186 MSEK to the sale of subsidiaries. In addition, theSAS Group’s gross debt was reduced by 1,295 MSEK,due to debt formerly part of the sold business units.Gross debt was 17,417 MSEK at year-end 1994, representing a 6,986 MSEK reduction since the beginning ofthe year when debt totaled 24,403 MSEK.This was achieved through early redemption of longterm loans and purchases of the Group’s own bondissues. The average remaining term for the outstandingdebt is approximately five years. In view of the year’ssubstantial financial surplus, no new borrowing tookplace.Liquid funds amounted to 10,725 MSEK on December 31, 1994, which is somewhat higher than at year-end1993, when liquid funds totaled 9,318 MSEK. This highliquidity is due to the attractive terms on which the SASGroup was able to conduct long-term borrowing at theend of the 1980s and in the early 1990s, in the form ofbond issues and Japanese financial leases. This providedlimited opportunities to redeem the underlying debt witha better financial return than the level at which liquidfunds could be managed. In addition, SAS has unutilizedcredit facilities of 100 MUSD as well as unutilized commercial paper programs of 2,000 MSEK, 1,500 MDKKand 200 MUSD.SAS’s credit rating from Moody’s remains P1 forshort-term debt and has been A3 for long-term debtsince July 1994.As reported previously, the SAS Group’s financialstatements are prepared in accordance with International Accounting Standards (IAS).This means that SAS’s net debt in foreign currenciesis revalued when the consolidation currency, the Swedishkrona (SEK), is depreciated, while a correspondingrevaluation of assets denominated in foreign currencies,such as aircraft, may not be made. The substantialweakening of the Swedish krona in 1992/93, thus hadHotels continues, however, to operate the hotel in Brussels under a management contract. These sales provideda capital gain of 121 MSEK. Provisions to reserves forthe decline in value of hotel properties were made in theamount of 54 MSEK.Sales of other shares, flight equipment, etc., amountedto 48 MSEK.Income before taxes was 1,505 MSEK (–492).1994 investments increased by 165 MSEK comparedwith 1993 to 1,277 MSEK. Investments in flight equipmentaccounted for 370 MSEK. Return on capital employedwas reported at 7% (5%) and return on equity was 10%in 1994. The debt/equity ratio as of December 31decreased from 1.6 to 0.6. The equity/assets ratio rose to29% (21%).Balance Sheet (MSEK)Liquid fundsOther interest-bearing assetsAircraftOther assetsTotal 15,58217,76043,857Operating liabilitiesInterest-bearing debtSubordinated debenture loansMinority interestsEquityTotal liabilities and 61598,63143,857FINANCIAL OVERVIEW :A YEAR OF STRONG FINANCIAL CONSOLIDATIONAND MANAGEMENTThe increase in liquid funds provided by surpluses inoperations and sold units was used to pay off outstandingdebts. The SAS Group’s net debt was thus more thanhalved during 1994 from 13,888 MSEK at the beginningof the year to 6,054 MSEK at year-end.The financing surplus during the year amounted to6,252 MSEK, of which 947 MSEK was attributable to anet surplus from operations, 3,031 MSEK to the sale and4
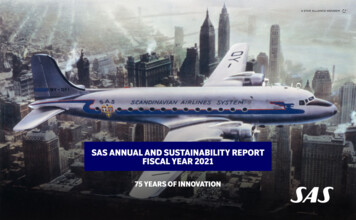
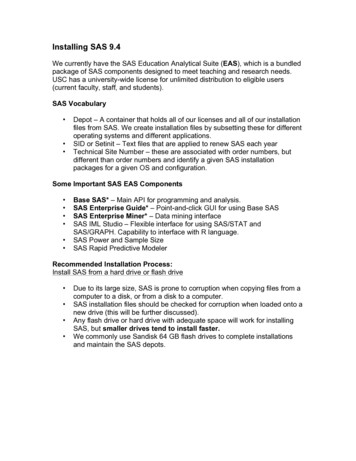
B O A R D O F D I R E C T O R S’ R E P O R TSAS Group Income TrendMSEKSAS Income Trend%Income before urn on capital employed%Income before taxes1510590919293094Return on capital employed111990 Airline onlyStatement of Changes inFinancial Position (MSEK)negative effects on the financial statements in the form ofunrealized exchanges losses reported among net financialitems.During 1994, SAS applied a full-scale real-economicfinancial policy under which the currency composition ofthe net debt corresponds to the operational cash surplusfrom operations.Due to the substantial reduction in the company’s netdebt, percentage changes in the SEK index have a morelimited nominal effect. In addition, the SEK index recovered slightly during the year, resulting in a positiveexchange difference of 93 MSEK.The fluctuations on the foreign exchange marketcontinue and this has been particularly noticeableduring the latter part of the first quarter of 1995. SAS’sfinancial position means, however, that this will have farless impact on income than previously. A weakening ofthe Swedish krona still constitutes a risk with regard tothe net debt. However, this will be compensated to aconsiderable extent in operating income since SAS has apositive cash flow in currencies other than Swedishkronor.Since SAS’s liquid funds have a currency composition which matches the underlying debt, currency exposure only exists on the net debt. Furthermore, since theportion of liquid funds which can be regarded as “surplus” has an interest rate composition which is neutral inrelation to the underlying debt, interest rate risks onlyarise on part of liquid funds.The SAS Group’s net interest income of –719 MSEK(–1,289) corresponds to an effective interest expense onthe average net debt of 7.3 % (8.1 %). The main reasonsfor this improvement in net interest income are thereduced net debt and generally lower interest rates.The SAS Group’s financial development can be summarized in the following Statement of Changes in Financial Position:Net financing from operationsInvestmentsAdvance payments, netSales of fixed assets, etc.Financing surplusAmortization and early redemptionOther financial receivables/liabilities, net*Change in liquid fundsLiquid funds in sold companiesChange in liquid fundsaccording to the balance 73626–381–1301,407–511*) Excluding unrealized exchange rate effects on netdebt in 1993.Net financing from operations, including changes inworking capital, amounted to 2,338 MSEK (1,377).Investments totaled 1,277 MSEK (1,112), of which216 MSEK related to a Boeing 737 and 109 MSEK anMD-80 taken over from Scandinavian Leisure in June.In addition 95 MSEK related to acquisition of shares,5.1% in Airlines of Britain Holdings, and 54 MSEK to acapital contribution to Polygon Insurance Company.Sale of fixed assets, etc., includes 2,186 MSEK fromthe sale of SAS Leisure AB, SAS Service Partner A/S,Diners Club Nordic AS, Nord-Norsk Hotelldrift AS, SASRoyal Hotel in Brussels, and other sales.In addition, 3,031 MSEK was received during theyear from sales carried out at the end of 1993 (thisamount was not included in the 1993 Statement of Changes in Financial Position). After the sale of fixed assets, afinancing surplus of 6,252 MSEK (2,088) is reported.Amortization and early redemption, –5,238 MSEK, mainly comprise redemption of long-term loans. Other financial receivables/liabilities, net, include a net amount of1,492 MSEK in settlement of internal balances from soldsubsidiaries.5
B O A R D O F D I R E C T O R S’ R E P O R TIncome by Business Unit (MSEK)SASIncome after depreciation, etc.Financial items, netExchange rate differences, netRealized exchange gains onsale and leaseback of aircraftMinority sharesSAS totalSAS International HotelsSold unitsOther operations/Group eliminationsIncome before the sale offlight equipment and shares, etc.Gain on the sale offlight equipment and shares, etc.Provisions to reserve for declinein value of hotel investmentsIncome before –541,505–110–492decrease in capacity of 1%. Passenger revenues adjustedfor exchange effects rose by 7%. The increase in RPKwas 6% on European routes, 8% on Danish domesticroutes, 4% on Norwegian domestic and inter-Scandinavian routes, and 1% on intercontinental routes, whileRPK fell by 10% on Swedish domestic routes. The average cabin factor was approximately two percentagepoints higher than in 1993, 65.5%. The number of passengers amounted to 18.8 million (18.6).Income TrendSAS’s 1994 operating revenue amounted to 32,365MSEK, representing an increase over 1993 when operating revenue was 29,723 MSEK. Traffic revenue rose by9% to 26,114 MSEK. Adjusted for exchange effects, theincrease in traffic revenue was 1,956 MSEK or 8%.Fuel costs totaled 1,819 MSEK (2,000). This decreasewas mainly due to 7% lower fuel prices in cents per gallon and to lower consumption.Payroll costs increased from 9,613 MSEK to 10,219MSEK. Excluding exchange effects and restructuringcosts, payroll costs decreased by 2%. The average number of employees was 20,888 compared with 21,958 in1993, a reduction of 5%.As part of the action program now in progress, projects which will have a full-year effect of approximately2,000 MSEK were completed by December 31, 1994. Thenominal effect achieved during 1994 was slightly lessthan half this amount.Compared with 1993 and taking restructuring costs,SASSAS includes SAS’s airline operation and, with effectfrom 1994, SAS Trading, including subsidiaries related tothese operations, SAS Commuter and joint-Group costs.SAS’s traffic growth during the year was lower thanthe average 9 % increase among members of the Association of European Airlines (AEA). This was partly due todeliberate consolidation of Swedish domestic traffic bysuspending unprofitable routes and frequencies. In addition, tough competitive pressure continued in bothScandinavia and Europe. Measured in revenue passenger kilometers, RPK, the increase was 2 % with aPRODUCTION AND TRAFFIC (per geographic area)AVAILABLE TONNE KILOMETERS (ATK)REVENUE TONNE KILOMETERS (RTK)LOAD FACTORMilliontonne kmChange%Share%Milliontonne peNordic 954.159.061.92.3–2.10.712 GER, FREIGHT AND MAIL TRAFFIC (per geographic area)PASSENGERS12 monthsIntercontinentalEuropeNordic OTALCABIN FACTORMillionpass. FREIGHTMAIL%Change%-pointsMilliontonne kmChange%Milliontonne 196.862.1461.9550.526
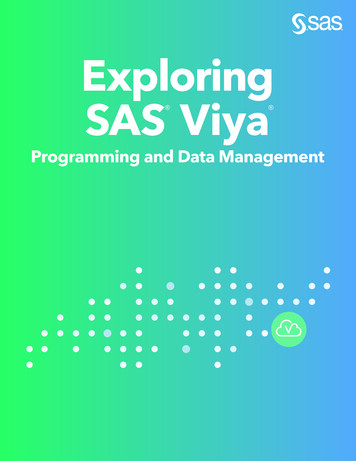
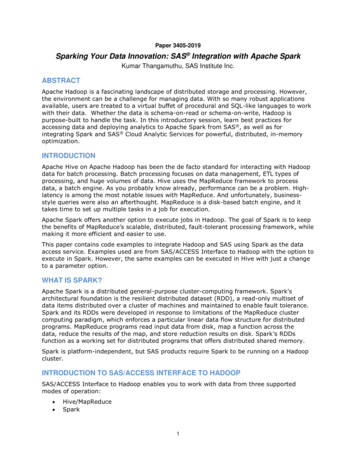
B O A R D O F D I R E C T O R S’ R E P O R TSAS Expenses, 1994SAS Revenues, 1994Personnel 34 %Fuel 6 %Commissions 7 %Government fees 13 %Catering 4 %Spare parts 5 %Depreciation 6 %Other expenses 25 %Passengers 80 %International full fareInternational discount fareDomesticFreight 5 %Mail 1 %Other 14 %exchange effects, volume effects and other nonrecurringitems into account, the airline’s operating expensesdecreased by approximately 1 %. Taking account of anaverage inflation of 3 % during the year, the actualdecline in costs can be estimated at 4 %.Operating income before depreciation, etc., was1,379 MSEK better than in 1993, 2,788 MSEK (1,409).Operating income was affected favorably byincreased traffic and higher yields. Restructuring costswere 475 MSEK higher than in the preceding year.Shares of income in affiliated companies amounted to16 MSEK (–8) and include Spanair S.A., formerly partof SAS Leisure, since June 1, 1994.Net financial items were reported at –662 MSEK(–1,111). The change is mainly attributable to lowerinterest expenses due to the reduced net debt.Income after financial items and minority shares was388 MSEK (–913).Gains on the sale of flight equipment and sharesrelated to SAS’s operations amounted to 40 MSEK (49).Income before taxes was 428 MSEK (–864).Investments totaled 1,142 MSEK (704), of which 370MSEK (380) was invested in flight equipment.6% in spite of largely unchanged production. The cabinfactor thus rose from 52.8% to 55.7%.EuroClass traffic increased by 4% and Tourist Classby 7%. The market share for EuroClass fluctuatesbetween 45% and 75% compared with major competitors in the individual route sectors. The cabin factor forEuroClass fell by 1% to 34.8% for the full year.Excluding exchange rate adjustments, yield rose by2%.Inter-Scandinavian RoutesFree competition inside Scandinavia did not lead to anyappreciable increase in competing traffic during 1994.The routes from Copenhagen to Kristiansand andTrondheim, and from Stockholm to Bergen were suspended in spring 1994. On August 1, hovercraft werereplaced by catamarans on the Copenhagen–Malmöroute.Traffic on inter-Scandinavian routes increased by4% in spite of a 2% production decrease. EuroClasstraffic rose by 8% while Tourist Class traffic remainedunchanged. The cabin factor therefore increased from56.8% to 60.3%, with the cabin factor for EuroClassrising to 45%.The yield trend was very favorable, 6%, adjusted forchanged exchange rates.Intercontinental RoutesThe Los Angeles route was suspended on August 31,1994. This route had been in operation for nearly 40years. At the same time, Osaka became a new destination.A substantial improvement in results was noted onintercontinental routes in 1994, to the best level for several years.Overall intercontinental RPKs increased by 1 % andthe cabin factor rose from 76.1 % to 78.1 %.EuroClass traffic increased by 13 % over the previous year, while Tourist Class decreased by 1 %.Adjusted for exchange effects, yield (revenue perpassenger kilometer) improved by 4 %.Danish Domestic and GreenlandThe trend for both Danish domestic and Greenland wassatisfactory. Traffic rose by 8%, with a slight predominance of full-fare traffic, while production remainedlargely unchanged. The cabin factor was 63.9%.Yield remained at the 1993 level.Norwegian DomesticThe deregulation of Norwegian domestic traffic was completed on April 1, 1994. This resulted in SAS increasingthe number of flights on routes from Oslo to Stavangerand Trondheim, and between Bergen and Stavanger,while competition intensified on routes to northern Norway and Bergen.European RoutesThe traffic trend was very positive. Traffic increased by7
B O A R D O F D I R E C T O R S’ R E P O R TProduction and TrafficSAS Group Financial PositionSEKMILLION SEAT 20,0002010,00010094090Sold seatsUnsold seatsTraffic revenues/Available seat km91929394EquityLiabilitiesEquity/assets ratioFreight revenues rose by 4%, after adjustment forexchange effects.In the last two quarters of 1994 clear improvementsin the market situation were noted in the majority ofSAS Cargo’s markets, with the exception of Japan,which contributed to a satisfactory business trend.SAS and Københavns Lufthavne A/S (KLH) concluded an agreement in 1994 under which KLH will invest ina new freight terminal for SAS in Copenhagen. This is asign of SAS’s commitment to its freight operations andtheir importance for long-haul routes.Total market growth, measured in the number of passengers, on sectors exposed to competition was 13 %, whichcorresponded to SAS’s growth on the same sectors. Ofthe total traffic on the Norwegian regular routes, SASfaces competition on 80 % of its routes.Total traffic increased by 4 %. The business sectorincreased by 7 % and the tourist sector by 3 %, whileproduction rose by 9 %. The cabin factor decreasedfrom 66.7 % to 63.8 %. Yield remained unchanged.Swedish DomesticThe deregulation of the Swedish domestic market in1992, resulted in substantial fare reductions combinedwith overcapacity. This meant that 1993 was financiallya disastrous year for many Swedish airlines.1994 on the other hand was characterized by consolidation in the form of a better balance between supplyand demand and some increases in fares.SAS’s production decreased by 12 % compared with1993, which was attributable to suspended routes, Gällivare, Jönköping and Borlänge, as well as a generally better adjustment to demand on other routes. Trafficdecreased by a total of 10 % due to a reduction in production and increased competition. However, a sharpincrease was noted in the business sector of 14 %, whilethe tourist sector declined by 23 %.Yield increased by 14 % as a result of a greater proportion of business travel and fare increases during theyear.During the autumn operations were expanded for thefirst time for several years through production increaseson routes to Malmö, Gothenburg, Östersund and Ängelholm.SAS TradingThe increased number of passengers in Scandinavia hada favorable impact on sales in airport shops.Competition in the duty-free market has increasedconsiderably, resulting in more operators becominginterested in the Scandinavian market. When Københavns Lufthavns Forretningscenter K/S ceases to operateon June 30, 1995, the concession will be transferred toanother operator following invitations to tender.As a result of Sweden joining the EU, vendor controlrules will be applied to perfumes and cosmetics. Thismeans there is a ceil
imately 35 billion SEK. Net debt has been reduced from 14 billion to 6 billion SEK. The debt/equity ratio has therefore fallen from 1.6 to 0.6. To sum up, the financial consolidation of SAS has provided - as was the intention - a satisfactory equity/ assets ratio, a reasonable burden of debt, good liquidity and considerable financial .