Transcription
Mega-Trends in the Worldof Insurance:Impacts on Captive &Alternative Risk TransferMarkets17th Annual World Captive ForumScottsdale, AZNovember 6, 2007Robert P. Hartwig, Ph.D., CPCU, Executive Vice President & Chief EconomistInsurance Information Institute 110 William Street New York, NY 10038Tel: (212) 346-5520 Fax: (212) 732-1916 bobh@iii.org www.iii.org
Presentation Outline Captive & ART Overview Pricing Under Pressure¾ Traditional Insurers Starved for Growth Capacity: New Record HighsProfitability: Flush Times Breed CompetitionUnderwriting: Strong Results—Discipline is Tested?Investment Income: Flat GainsÆMore Discipline?Key Lines: Back from the Brink—But Heading South?Catastrophic Loss: Welcome RespiteFinancial Strength & RatingsState-Run Markets: A Traditional & ART Competitor?Terrorism: No ART Solution HereTorts: Legal Environment Getting BetterQ&A
CAPTIVE & ARTOVERVIEWDrivers of Growth:Slowdown Ahead?
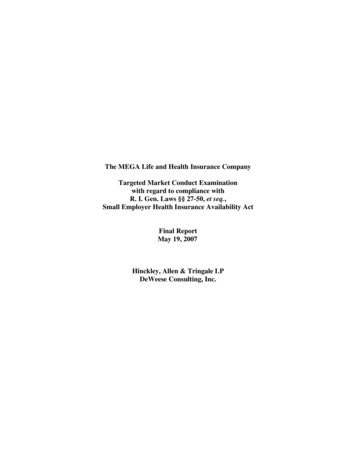
Total Commercial Risk ProtectionMarket (US, 2004) BillionsAlternative marketmechanisms coverabout 30 percent( 98 billion) of thetotal commercial riskprotection market( 326.9 billion)CommercialInsurance, 229,70%Alternatives, 98,30%Source: Conning; MarketStance analysis; Insurance Information Institute.
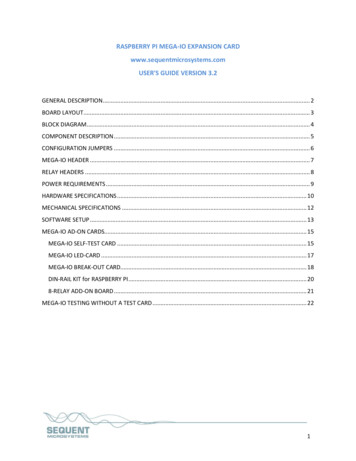
Size of Alternative Risk TransferMarket (2001 Direct Written Premiums)Captives, 38 ,8.3% BillionsOtherAlternativeCarriers (US), 5, 1.1%Self-Insurance, 44 , 9.6%Source: Swiss Re; Insurance Information Institute.Captivesaccounted forabout 8.3% ofglobalcommercialinsurancepremiums in2001, likely atleast 10% todayTraditionalCarriers, 370 ,81.0%
Alternative Risk Transfer Marketby Line BillionsProperty, 10%Workers Comp,43%Workers Compaccount for thelargest share of thealternative marketAutomobile,12%Source: MarketStance.Liability (excl.Auto), 35%
Alternative Market Share byIndustry Group, All LinesMiningTransport., Public Util.ManufacturingServicesThe Mining industrymakes the greatest useof alternative markets,agriculture the least42.8%42.3%32.4%Retail Trade28.3%Wholesale TradeConstruction21.9%Agriculture21.8%Source: MarketStance45.0%34.6%Finance, Insurance0%45.4%10%20%30%40%50%
Workers Compensation: LargeDeductible Market Share50%45%40%35%30%25%Employers havebecome veryaccustomed toaccepting a greatershare of risk andclaim frequencyhas decreased43%33%20%15%10%5%1%0%199020002003Sources: National Council on Compensation Insurance; Insurance Information Institute.
Alternative Market byRevenue Size70%60%50%40%Large companiesare far more likelyto retain risk viaalternative vehiclesthan are smallcompanies58.2%62.6%30%20%17.8%10%0%Small ( 100 millionMedium ( 100revenue)million to 1 billionrevenue)Sources: MarketStanceLarge (more than 1billion revenue)
Alternative Market By OKNMSCARHIMSALGALATXAbove AverageBelow AverageSource: MarketStance; Conning 2006FLPR
U.S. Domiciled Captives – Top LinesMedical Malpractice37.6%Auto Phy. Damage10.9%Priv. Pass. AutoLiab.10.2%Other Liability8.3%Commercial M.P.Medical malpractice remainsthe dominant product line forU.S. domiciled captives in2006, followed by variousauto coverages, commercialM-P and workers comp.6.3%Workers Comp.5.0%0%5%10%15%20%25%30%Source: A.M. Best, 2007 Special Report: U.S. Captive Insurers – 2006 Market Review35%40%
U.S. Risk Retention Groups:Distribution by LineMed MalOccur2.0%Other Liab ClMade23.0%Other LiabOccur29.0%Comm AutoLiab2.0%Med Mal ClMade43.0%MedicalMalpractice(claimsmade)remained asignificantportion ofRRGbusiness in2006 at43%, whileotherliability (peroccurrence)remainedvirtuallyunchangedat 29%.Figures do not total 100% due to rounding.Source: A.M. Best, 2007 Special Report: U.S. Risk Retention Groups – 2006 Market Review
U.S. Domiciled Captives- NetPremiums Written ( Millions) 10.5 Millions 10.0Following a five-year period ofrapid growth, U.S. captiveinsurers saw net premiumswritten increase by just 2.7percent in 2006, after 6.2percent growth in 2005. 9.5 9.9 9.3 9.0 9.0 8.5 10.2 8.4 8.02002200320042005Source: A.M. Best, 2007 Special Report: U.S. Captive Insurers – 2006 Market Review2006
Risk Retention Group Premiums,1988 – 2006* 2,449.1 2,773.706* 2,197.8 1,737.705 751.997 944.0 575.5 707.695 775.5 585.894 875.3 527.2 493.79293 493.6 419.39091 358.4500891,000 250.21,500992,000 790.52,50098Risk retention (& self-insurance)group premiums have risen rapidlyin recent years and represent aform of competition to traditionalinsurers and captives3,000 1,265.1Millions of Dollars*2006 ProjectedSource: Risk Retention Reporter, Insurance Info. Institute040302010096880
U.S. Risk Retention Groups:Domicile Distribution 2006Vermont46%Hawaii12%South 4%Missouri4%Montana4%Tennessee4%Texas4%0%The majority of RRGs aredomiciled in Vermont, with12. Hawaii has 3 RRGs whileSouth Carolina has 2 RRGs.The remaining groups aredistributed equally amongvarious domiciles.10%20%30%40%Source: A.M. Best, 2007 Special Report: U.S. Risk Retention Groups – 2006 Market Review50%
Food, Drink and TobaccoCompany Captives by Domicile30%27.6%25%19.0%20%17.0%13.7%15%Captive solutions can beextremely helpful to food, drinkand tobacco (FDT) companies.Captives with parent companiesin the FDT sector exist in only10 domiciles. Nearly half (46.6%)were spread between Bermudaand Vermont.10%5.0%5%5.0%3.0%1.0%1.0%1.0%Source: Captive Review, October SwlandIreuernseyGontVermBermuda0%
Leading Captive DomicilesWorldwide, 2005 vs. 380383*6005425638007337401,000Mixed growth rates in captivedomiciles worldwide in 2006as competition intensifies intraditional market.2006987*9892005Sources: Business Insurance, March 12, 2007, ofMan*BI estimate. **Excludes credit life insurers.GBVIBermudaCaymansVermont0
Leading US Captive Domiciles,2005 vs. 20066002006U.S. captive domicilesexperienced dramaticgrowth in ces: Business Insurance, March 12, 2007; III
NVKY62%167%167%1100%Fastest Growing US CaptiveDomiciles, 2006 over 2005Newer U.S. captive domiciles ledthe way in growth rates in 2006,but from small bases in 2005 (e.g.,UT increased from 15 domiciles in2005 to 30 in s: Business Insurance, March 12, 2007; IIIAZGA
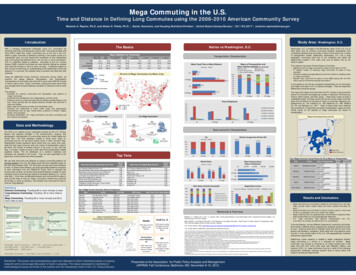
G1500 Companies and Captives:Room for GrowthCompanies with a captive1500Companies in G1500The captive market remains underdeveloped,with over half (53%) of the world’s top G1500companies not currently owning a captive.1,6001,4001,2001,000KoSource: Aon, Global 1500: A Captive Insight RepublU.ic)S.034392200UK400243325600564800Markets such as Asia haveconsiderable potential for growth.For example, only 14% of JapaneseG1500 companies have a captive.
Captive Formations & Liquidations,1993–2002500450400350Why Do Captives Liquidate? Collapse of parent (cyclical) Collapse of parent (e.g., Enron) Consolidation Escalating loss costs/claimseverity (e.g., med mal)Captive formationand liquidation arehighly correlated300250200150100Captive Liquidations50New Captive Formations01993199419951996Source: A.M. Best; Insurance Information Institute199719981999200020012002
Top 5 Captive Managers byPremium Volume, 2006 ( Mill) 10,000 9,000 8,900 8,000 7,000 6,000 5,000 5,000 4,200 4,100Aon(Vermont)Aon(Bermuda) 4,000 3,486 3,000 2,000 1,000 0Marsh(Bermuda)Marsh(Vermont)Sources: Business Insurance, March 12, 2007; IIIInternationalAdvisoryServices
Top 10 Largest Captive ManagersWorldwide, by Captives Managed 771941831681469493928091988876WillisUSA RiskIASHSBC InsuranceBeecher CarlsonQuestAIGAMS 0 200 400Sources: Business Insurance, March 12, 2007; IIIThe number of captivesmanaged by the top firmsincreased in 2006, thoughnot in all domiciles 600 800 1,000 1,200 1,400 1,600
Top Bermuda Captive Managers,by Premium Volume, 450Cedar MgmtJLTLiberty MutualBeecher CarlsonUSA RiskQuest 0 2,000Sources: Business Insurance, March 12, 2007; IIIPremium volume grew forsome managers, butshrank for others 4,000 6,000 8,000 10,000
Annual Catastrophe BondTransactions Volume, 1997-2007*Catastrophe bond issuance hassoared in the wake ofHurricanes Katrina and thehurricane seasons of 2004/2005 5,000 4,000 4,693.4 3,000 1,991.1 1,729.8 2,000 1,139.0 966.9 1,219.5 846.1 984.8 1,000 633.0 1,142.8 097989900010203040506Source: MMC Securities and Guy Carpenter; Insurance Information Institute. *Through 10/31/0707*20181614121086420Number of IssuancesRisk Capital Issues ( Mill) 6,000Number of Issuances 4,830Risk Capital Issued
COMPETITIVEPRICE PRESSURETraditional InsurancePrices Falling Sharply
Strength of Recent Hard Marketsby NWP Growth*25%1975-781984-872001-042006-2010 (post-Katrina)period could resemble 1993-97(post-Andrew)20%15%10%5%0%-5%2005: biggest real drop inpremium since early 0062007F2008F2009F2010F-10%Note: Shaded areas denote hard market periods.Source: A.M. Best, Insurance Information Institute*2007-10 figures are III forecasts/estimates.
Growth in Net WrittenPremium, 2000-2008F15.3%10.0%8.4%5.0%P/C insurers will experiencetheir slowest growth ratessince the late 1990s butunderwriting results areexpected to remain healthy3.9%2.7%0.5%200020012002200320042005*2007 figure base on 2007 actual first half result of 0.1%.Source: A.M. Best; Forecasts from the Insurance Information Institute.20060.1%0.3%2007F*2008F
Most Layers of Coverage areBeing Challenged/Leaking 100 MillionRetroReinsurance 50 MillionExcess 10 MillionPrimary 2 Million 1 MillionReinsurers losing tohigher retentions,securitizationExcess squeezed byhigher primaryretentions, lowerreins. attachmentsLg. deductibles,self insurance,RRGs, captiveserode primaryRetentionSource: Insurance Information Institute from Aon schematic.Risks are comfortabletaking larger retentions
Average Commercial Rate Change,All Lines, (1Q:2004 – 3Q:2007)0%Magnitude of rate decreases diminishedgreatly after Katrina but have grown 7.0%-8%-8.2%-9.4%-9.7%Source: Council of Insurance Agents & Brokers; Insurance Information Q041Q04-14%2Q07KRW Effect-11.3%-11.8%-13.3%1Q07-12%-9.6%4Q06-10%
Cumulative Commercial RateChange by Line: 4Q99 – 3Q07Commercial account pricinghas been trending down for 3years and is now on par withprices in late 2001, early 2002Source: Council of Insurance Agents & Brokers
D&O Premium Index(1974 Average 100)Average D&O pricing is off18% since 2003, after rising146% from 1999-2003140012001000800600682746704 720 720771 806 7931,2371,1139311,010827726720619539 503 560400200086 88 90 91 92 93 94 95 96 97 98 99 00 01 02 03 04 05 06Source: Tillinghast Towers-Perrin, 2006 Directors and Officers Liability Survey.
UNDERWRITINGCAPACITYDoes Expanding CapacityBode Ill for ART,Including Captives?
U.S. Policyholder Surplus:1975-2007* 550 500 450Capacity as of 6/30/07 was 512.8B,5.3% above year-end 2006, 80%above its 2002 trough and 54%above its 1999 peak. 400 Billions 350 300 250 200Foreign reinsuranceand residual marketmechanisms absorbed45% of 2005 CATlosses of 62.1B 150 100 50Capacity exceeded ahalf trillion dollars forthe first time duringthe 2nd quarter of 2007“Surplus” is a measure ofunderwriting capacity. It isanalogous to “OwnersEquity” or “Net Worth” innon-insurance organizations 075 76 77 78 79 80 81 82 83 84 85 86 87 88 89 90 91 92 93 94 95 96 97 98 99 00 01 02 03 04 05 06 07*Source: A.M. Best, ISO, Insurance Information Institute.*As of June 30, 2007
Capital Raising by Class Within15 Months of KRW BillionsInsurance LinkedSecurities, 6.253 ,19%Insurers &Reinsurers raised 33.7 billion in thewake of Katrina,Rita, WilmaNew Cos., 8.898 ,26%Source: Lane Financial Trade Notes, January 31, 2007.Sidecars, 6.359 ,19%Existing Cos., 12.145 , 36%
Annual Catastrophe BondTransactions Volume, 1997-2007*Catastrophe bond issuance hassoared in the wake ofHurricanes Katrina and thehurricane seasons of 2004/2005 5,000 4,000 4,693.4 3,000 1,991.1 1,729.8 2,000 1,139.0 966.9 1,219.5 846.1 984.8 1,000 633.0 1,142.8 097989900010203040506Source: MMC Securities and Guy Carpenter; Insurance Information Institute. *Through 10/31/0707*20181614121086420Number of IssuancesRisk Capital Issues ( Mill) 6,000Number of Issuances 4,830Risk Capital Issued
Change in US PolicyholderSurplus, 1976-2007F* 70 60 50 Billions 40US insurers have recorded largeincreases in net capacity since 2003despite record CAT losses. Netincome (less dividends) is thelargest source of net new capacity. 30 20 10 0( 10)( 90001020304050607( 30)*2007 forecast based on actual 07:H1 increase of 25.6BSource: A.M. Best, ISO, Insurance Information Inst.
New Capital Paid-In: US P/CInsurers, 2003-2006 ( Bill) 16 14.4 14 12 11.3 8.8 10 8New capitalentering USmarkets wasdownsignificantly in2006. Muchmore raisedoffshore. 6 3.6 4 2 020032004Sources: A.M. Best, ISO, Insurance Information Inst.20052006
Reasons Behind Capital Build-Up& Repurchase Surge 4,370.0 5,242.3 763.7 5,266.0 4,297.3 2,764.2 1,539.9 769.295 4,586.5 658.894 566.892 310.1 418.191 952.4 646.988 311.0 564.0 1,00087 2,000Returning capital owners(shareholders) is one of the fewoptions available98 5,000 4,497.5 6,000 2,385.6 Reasonable investmentperformance Lack of strategic alternatives(M&A, large-scale expansion)97 Moderate catastrophe losses 7,000 3,000 7,094.1 Strong underwriting results 8,000 4,000First half 2007 sharebuybacks are already 86%of the 2006 record 6,173.0P/C Insurer Share Repurchases,1987- First Half 2007 ( Millions)*06050403020107H1Sources: Credit Suisse, Company Reports; Insurance Information Inst.009996939089 0
MERGER &ACQUISITIONFew Catalysts for MajorP/C Consolidation
P/C Insurance-Related M&AActivity, 1988-2006 35,221 9,26488 89 90 91 92 93 94 95 96 97 98 99 00 01 02 03 04 05 06*Announced May 7, 2007.Source: Conning Research & Consulting.1201008060 425 40,03214040200Number of Transactions 20,353 486 1,249 0 1,882 5,100 5,137 2,435 2,780 10,000 3,450 20,000No model forsuccessfulconsolidationhas emerged 19,118 30,000Liberty Mutualacquired OhioCasualty for 2.7B* 8,059 40,000 55,825 11,534 50,0002006 surge duemostly to 2 deals. Notrend started. 5,638Transaction Value ( Mill) 60,000Number of Transactions 30,873Transaction Values
PROFITABILITYOVERVIEWRising Profits BreedsCompetition
63,695 65,19207F 44,155 38,501 30,029 3,046 20,559 30,773 21,865 10,870 10,000 19,316 20,000 5,840 30,000 14,178 40,000Insurer profits peaked in2006/7. “Normal” CAT year,average investment gainimply flattening 36,819 50,000 24,404 60,000 20,598 70,000y2001 ROE -1.2%y2002 ROE 2.2%y2003 ROE 8.9%y2004 ROE 9.4%y2005 ROE 9.4%y2006 ROAS1 14.0%y2007F ROAS 13.1%**06P/C Net Income After Taxes1991-2007F ( Millions)*05040301- 6,97000999897969594939291- 10,00002 0*ROE figures are GAAP; 1Return on avg. surplus. 2007F figure is annualized actual first half net incomeof 32.596B **Actual first half 2007 result.Sources: A.M. Best, ISO, Insurance Information Inst.
ROE: P/C vs. All Industries1987–2008E20%P/C profitability is cyclical, volatile and vulnerable15%10%Sept. 115%US P/C InsurersAll US Industries*2007 is actual first half ROAS of 13.1%. 2008 P/C insurer ROE is I.I.I. estimate.Source: Insurance Information Institute; Fortune07F08F06040302010099984 7Katrina,Rita, WilmaLowest CATlosses in 15 years940%Hugo
RETURN ON EQUITY (Fortune):Stock & Mutual vs. All kMutualAll 0214%13%10.4%10.0%11%10%15.4%14.9%2003*Fortune 1,000 group.Source: Fortune Magazine, Insurance Information Institute.14.0%13% 15% 13%10%12% 11%13.0%11%9%8%Mutual insurer ROEs aretypically lower than for stockcompanies, but gap hasnarrowed. All are cyclical.200420052006E 2007F 2008F
Profitability Peaks & Troughs in theP/C Insurance Industry, 1975 – 2008F25%1977:19.0%20%1987:17.3%10 Years15%2006:14.0%1997:11.6%10 Yearss9 Year10%5%0%1975: 2.4%1984: 1.8%1992: 4.5%2001: 798990001020304050607F08F-5%*2007 is actual first half ROAS of 13.1%. 2008 P/C insurer ROE is I.I.I. estimate.Source: Insurance Information Institute; Fortune
ROE vs. Equity Cost of Capital:US P/C Insurance:1991-2007E18%The p/c insurance industry achieved its cost ofcapital in 2005/6 for the first time in many years16%12%4%2%0%-2%-4%The cost of capitalis the rate of returninsurers need toattract and retaincapital to thebusinessUS P/C insurers missed theircost of capital by an average 6.7points from 1991 to 2002, but ontarget or better 2003-07919293949596979899Source: The Geneva Association, Ins. Information Inst.-0.1 pts6% 0.2 pts-13.2 pts8%-9.0 pts10% 3.1 pts 3.5 pts14%000102ROE03040506 07ECost of Capital
L/H Insurance IndustryNet Income ( Bill), 1997-2006 40 35.9 35 32.18Billions 30 26.55 25 21.72 20 34.0 20.88 22.20 17.98 15 10 9.81 4.14 5 01997 1998 1999 2000 2001 2002 2003 2004 2005 2006Source: NAIC data, from Highline National Underwriter.
Return on Equity: L/H Insurancevs. Fortune 500, 1995-2005L/HFortune e: NAIC, from Highline National Underwriter.2000200120022003 20004 2005
WALL STREET:INSURERS LAGGINGBEHIND IN 2007
Insurance & Reinsurance Stocks:Strong Finish in 2006Total Returns for 2006S&P .33%9.53%0.61%0.0%Broker stocks held backby weak earnings5.0%10.0%P/CP/C insurer & reinsurerstocks rallied in late 2006as hurricane fearsdissipated and insurersturned in strong results15.0%20.0%25.0%Source: SNL Securities, Standard & Poor’s, Insurance Information InstituteAll InsurersMultiineBrokers
Insurance & Reinsurance Stocks:Finally Gaining in 2007Total YTD Returns Through November 2, 2007Mortgage insurers are6.44%down 66%, Title insurersdown 35% on subprime7.58%& real estate woesP/C insurance, reinsurance -1.10%stocks lagging on soft marketconcerns, and subprimeselloff. Some relief due tovery low hurricane losses -1.93%S&P 500Life/HealthReinsurers3.25%P/CAll 0%0.0%5.0%10.0%Source: SNL Securities, Standard & Poor’s, Insurance Information Inst. *Includes Financial Guarantee
UNDERWRITINGInsurer UnderwritingHas ImprovedDramatically
P/C Insurance Combined Ratio,1970-2008F*Combined Ratios1201970s: 100.31980s: 109.21151990s: 107.82000s: Sources: A.M. Best; ISO, III*Actual figure of 92.7 through first half 2007. **Through 2007:H1.
P/C Insurance Combined Ratio,2001-2008F120115.8110As recently as 2001,insurers were payingout nearly 1.16 forevery dollar theyearned in premiums107.42006 produced the bestunderwriting resultsince the 87.6 combinedratio in 1949100.7100.11002007/8 deterioration dueprimarily to falling rates, butresults still strong assumingnormal CAT activity98.397.02005 figure benefited fromheavy use of reinsurancewhich lowered net losses92.592.70607:H193.59001020304Sources: A.M. Best; ISO, III. *III estimates for 2007/8.0507F08F
Ten Lowest P/C Insurance CombinedRatios Since 1920 (& 2007:H1)9492.792.592.492.1 92.3939293.393.0 93.1 93.12007 is lookingvery strong91.29190898887.68786The industry’s bestunderwriting yearsare associated withperiods of lowinterest ratesThe 2006 combinedratio of 92.5 was thebest since the 87.6combined in rces: Insurance Information Institute research from A.M. Best data. *2007 first half actual.1936
Commercial Lines CombinedRatio, 0Outside CATaffected lines,commercialinsurance is doingfairly well. Cautionis required inunderwriting longtail commercial lines.102.0105103.9110107.62006 results benefited from relativelydisciplined underwriting, low CATlosses and reserve releases959090.5115110.3120110.2125112.5Commercial coverageshave exhibited extremevariability. Are currentresults anomalous?859394959697Source: A.M. Best; Insurance Information Institute989900.01020506
rers earned a record underwriting profit of 31.7 billion in 2006, the largest ever but only thesecond since 1978. Expect figure near 28 billion in2007 assuming “normal” CAT losses. Cumulativeunderwriting deficit since 1975 is 412 969798990001020304050607F BillionsUnderwriting Gain (Loss)1975-2007F*Source: A.M. Best, Insurance Information Institute *Actual 2007:H1 underwriting profit 14.402Bannualized to 28.8B.
Impact of Reserve Changes onCombined Ratio 10 5 0( 5)0.1 0.4 18.9 15 22.83.5 36.9 25 20 33.46.5 10.8Reserve Development ( B) 35 30( 10)000102031098Reserve7adequacy has64.5improved5substantially4321-1.2 -1.6 -1.3 -1.10(1)(2)( 5.0)( 5.3) ( 7.0)( 6.0)(3)040506Source: A.M. Best, Lehman Brothers estimates for years 2007-200907F08F09FCombined Ratio Points8.6 8.9 40PY Reserve DevelopmentCombined Ratio Points
Cumulative Prior Year ReserveDevelopment by Line (As of 12/31/06) 1,500 1,000 366 1,172 1,176- 96- 100- iabiliRtyeinsuranceLiab.erW- lCPropecialtyMaleHomPDAPPMedSpPPALiability- 3,006ecialty- 3,000- 3,500- 413ReleaseOth- 1,886- 2,500Reserve redundanciesin most lines haveresulted in releases inrecent yearsSp- 1,500- 2,000- 1,116- 1,000- 475- 779- 500- 1,174 Billions 0- 48 500- 53StrengtheningSources: Lehman Brothers; A.M. Best’s Aggregates & Averages Schedule P, Part 2.
REINSURANCEMARKETSReinsurance Markets HaveStabilized, Prices Falling
Announced Katrina, Rita, WilmaLosses by Segment BillionsLloyd's, 3.5 , 9%Europe, 4.9 , 13%Catastrophes areglobal events.Only 39% ofKRW losses wereborne by USprimary insurersBermuda, 10.9 ,29%*As of 2/21/06Source: Dowling & Partners, RAA.U.S. Reinsurer, 3.4 , 9%Other, 0.3 , 1%U.S. Primary, 14.2, 39%
Share of Losses Paid byReinsurers, by Disaster*70%60%50%40%30%Reinsurance is playingan increasinglyimportant role in thefinancing of megaCATs; Reins. Costsare skyrocketing30%25%60%45%20%20%10%0%Hurricane Hugo Hurricane AndrewSept. 11 Terror2004 Hurricane2005 Hurricane(1989)(1992)Attack (2001)LossesLosses*Excludes losses paid by the Florida Hurricane Catastrophe Fund, a FL-only windstorm reinsurer,which was established in 1994 after Hurricane Andrew. FHCF payments to insurers are estimated at 3.85 billion for 2004 and 4.5 billion for 2005.Sources: Wharton Risk Center, Disaster Insurance Project; Insurance Information Institute.
Ratio of Reinsurer Loss & UnderwritingExpense to Premiums Written, 1985-2006Despite the respite in 2006,reinsurers paid an averageof 1.11 in loss and expensefor every 1 in writtenpremium since 020.951.01.031.1Katrina,Rita, WilmaHurricane Andrew1.071.081.091.061.101.2Liability Crisis1.071.31.21Loss & LAE Ratio1.41.071.5Sept. 110.985 86 87 88 89 90 91 92 93 94 95 96 97 98 99 00 01 02 03 04 05 06Source: Reinsurance Association of America.
US Reinsurer Net Income& ROE, 1985-2006( 2)Net Income( 4)5%0%-5%ROE( 2.98)85 86 87 88 89 90 91 92 93 94 95 96 97 98 99 00 01 02 03 04 05 06Source: Reinsurance Association of America.15%10% 2.51 3.41 3.17 1.31 1.99 1.47 5.43 4.53 3.71 1.95 2.52 1.79 1.17 0 1.87 2.03 2 1.38 4 1.22 6 1.95 1.94 8 0.12Net Income ( Bill 1020%ROE 12 9.68Reinsurer profitabilityhas rebounded-10%
INVESTMENTSInvestment GainsAre Flat
Net Investment Income 60 Billions 50 40Investment incomeposted modest gainsin 2006, but isrunning flat in 2007Growth History 302002: -1.3%2003: 3.9% 20 10 02004: 3.4%2005: 24.4%*2006: 5.2%2007: 0.0%**757677 787980 818283 848586 878889 909192 939495 969798 990001 020304 050607*Source: A.M. Best, ISO, Insurance Information Institute;*Includes special dividend of 3.2B. Increase is 15.7% excluding dividend. **Based on annualized H1 result of 26.128B.
Total Returns for LargeCompany Stocks: 1970-2007*S&P 500 was up 13.62% in 2006, Up 9.82% YTD 2007*40%30%20%10%0%-10%Markets are up in 2007for the 5th consecutive-20%Source: Ibbotson Associates, Insurance Information 198619841982198019781976197419721970-30%year (so far)*Through November 2, 2007.
4,173 3,359 13,016 9,701 9,125 6,610 9,244 5,997 1,664 4,806 5,000 2,880 10,000 9,818 9,893 15,000 10,808 18,019Realized capital gainsrebounded strongly in 2004/5but fell sharply in 2006despite strong stock marketas insurers “bank” theirgains. Rising again in 2007. 6,631 20,000 16,205US P/C Net Realized Capital Gains,1990-2007:H1 ( Millions)- 1,214 0- 5,00090 91 92 93 94 95 96 97 98 99 00 01 02 03 04 05 06 07*Sources: A.M. Best, ISO, Insurance Information Institute.*As of June 30, 2007.
Property/Casualty Insurance1Industry Investment Gain Billions 57.9 60 52.3 56.9 51.9 47.2 50 59.4 44.4 42.8 40 35.4 30 45.3 60.6 55.7 48.9 36.0Investment gains fell in 2006 andeven now are only marginally largerthan in the late 1990s 20 101Investment07**0605*0403020100999897969594 0gains consist primarily of interest, stock dividends and realized capital gains and losses.2006 figure consists of 52.3B net investment income and 3.4B realized investment gain.*2005 figure includes special one-time dividend of 3.2B. **Annualized H1 result of 30.301B.Sources: ISO; Insurance Information Institute.
KEY LINEIMPROVEMENTS:WILL INSURERS SWEETENTHE DEAL FOR RISKS?
Commercial Auto Liability& PD Combined Ratios8587.79493.488.384.5Commercial Auto hasimproved 8.9113PD 97.593.8100Average Combined:Liability 25120.1Comm Auto PD120.5Comm Auto Liab809596Sources: A.M. Best; III97989900010203040506
Commercial Multi-Peril CombinedLiab. Combined 1995 to 2004 113.885105.593.8101.983.69097.7104.99589.0CMP- hasimproved ity vs. Non-Liability Portion)Non-Liab. Combined 105.2809596Sources: A.M. Best; III97989900010203040506
Workers Comp Combined 0118115130111Percent122Workers Comp Calendar Year –Private Carriers90801994 1995 1996 1997 1998 1999 2000 2001 2002 2003 2004 2005 2006pCalendar Yearp Preliminary AY figure.Accident Year data is evaluated as of 12/31/2006 and developed to ultimateSource: Calendar Years 1994-2005, A.M. Best Aggregates & Averages; Calendar Year 2006p and Accident Years 1994-2006pbased on NCCIAnnual Statement Analysis.Includes dividends to policyholders
Medical MalpracticeCombined Ratios160137.6142.5133.790101.0111.0Reforms/Award Caps and higherrates have helped to improvemed mal 30150107.9140Average Med MalCombined Ratio1995-2006154.7809596Sources: A.M. Best; III97989900010203040506
Other LiabilityCombined Ratios*150140 138.6Average Combined 108.5110111.8114.4112.1104.510096.3Improvements in tort andD&O environment havecontributed to performance90809596Sources: A.M. Best; III97989900010203040506*Includes Officers’ & Directors’ coverage.
CATASTROPHICLOSSIs the Worst Over orYet to Come?
Most of US Population & PropertyHas Major CAT ExposureIsAnyplaceSafe?
U.S. Insured Catastrophe Losses* 100.0 9.2 4.70607**20? 61.9 12.9 27.5 5.902 26.5 8.3 4.699 5.59394 10.1 4.79192 8.3 7.4 2.6 7.5 2.7 208990 40 16.9 60 22.9 802006 was a welcome respite.2005 was by far the worstyear ever for insuredcatastrophe losses in the US,but the worst has yet to come.030405 120 100 100 BillionCAT year iscoming soon Billions000198969795 0*Excludes 4B- 6b offshore energy losses from Hurricanes Katrina & Rita. **Through 9/30/07.Note: 2001 figure includes 20.3B for 9/11 losses reported through 12/31/01. Includes only business andpersonal property claims, business interruption and auto claims. Non-prop/BI losses 12.2B.Source: Property Claims Service/ISO; Insurance Information Institute
Total Value of InsuredCoastal Exposure (2004, Billions)FloridaNew YorkTexasMassachusettsNew JerseyConnecticutLouisianaS. CarolinaVirginiaMaineNorth CarolinaAlabamaGeorgiaDelawareNew HampshireMississippiRhode IslandMaryland 1,937.3 1,901.6 740.0 662.4 505.8 404.9 209.3 148.8 129.7 117.2 105.3 75.9 73.0 46.4 45.6 44.7 43.8 12.1 0Source: AIR Worldwide 500Florida & New Yorklead the way for insuredcoastal property at morethan 1.9 trillion each.Northeast state insuredcoastal exposure totals 3.73 trillion. 1,000 1,500 2,000 2,500
Value of Insured CommercialCoastal Exposure (2004, Billions)New YorkFloridaTexasMassachusettsNew JerseyConnecticutLouisianaS. CarolinaVirginiaMaineNorth CarolinaGeorgiaAlabamaMississippiNew HampshireDelawareRhode IslandMaryland 1,389.6 994.8 437.8 355.8 258.4 199.4 121.3 83.7 69.7 52.6 45.3 43.3 39.4 23.8 20.9 19.9 17.9 6.758% or all insuredcoastal exposure iscommercial, totalingsome 4.2 trillion in 2004 0So
The captive market remains underdeveloped, with over half (53%) of the world's top G1500 companies not currently owning a captive. Source: Aon, Global 1500: A Captive Insight 2007 Markets such as Asia have considerable potential for growth. For example, only 14% of Japanese G1500 companies have a captive.