Transcription
Esso Exploration & Production Chad Inc.Land Use Mitigation Action PlanAnnual Individual Livelihood RestorationReport 2012March 2013EMP’s Annual Individual Livelihood Restoration Report 2012Page 1
List of Acronyms & terms used in this reportHHHouseholdHHHHousehold Head (Chef de Ménage)HHMHousehold Member. Include the CdM and all it dependents, regardless their age.EligibleGeneric term to designate an individual that is eligible to the EMP Resettlement Program.Individual that may be eligible to the EMP Resettlement Program.Potential EligibleAnalysis must be completed.BBSBasic Business Skills TrainingCFACentral African FrancsCOFEMABCoopérative des femmes de Madjo-BéroCRCPChad Resettlement and Compensation PlanECMGExternal Compliance Monitoring GroupEEPCIEsso Exploration and Production Chad IncEMPEnvironmental Management PlanEMP ISEMP Information SystemGISGeographic Information SystemGoCGovernment of ChadIFCInternational Finance CorporationITRADInstitut Tchadien de Recherche Agronomique DéveloppementKPIKey Performance IndicatorsLCCLocal Community ContactLMMLand Management ManualLUMAPLand Use Mitigation Action PlanMARPMéthode Accélérée de Recherche ParticipativeNGONon Governmental OrganizationONDROffice National du Développement RuralSSPSite Specific PlanWARDAWest Africa Rice Development AssociationWBGWorld Bank GroupLand holding iskNo land holdingsLess than 2/3 cordes per HHM or 0,67 corde per HHM0.68 to 1 cordes per HHM1 to 2.5 cordes per HHM2.5 cordes per HHM and aboveNon-viable Marginal land holding statusNote on DataIn comparing data between tables and years, inconsistencies in numbers are due to the ever-evolving nature ofthe data (more fields belonging to M. Ngar .have been measured in another village; a “dependent” who, withfurther information, turns out to really belong to another HH). The overall messages delivered by the tables inthis document remain the same, despite slight increases or decreases. The tables have been calculated as ofstDecember 31 , 2012 whereas the data keeps evolving.EMP’s Annual Individual Livelihood Restoration Report 2012Page 2
TABLE OF CONTENTSPageExecutive summary5-7Introduction1. Land acquisition1.1 By village2 Compensation process3 Synergy (identifying real land users)4 Impact survey (Identifying eligibles)5 Land Return Surveys 20126 Steps of reflection7 Literacy Training Program (BBS) 2012 class8 Improved Agriculture Training9 Monitoringa. Results from 2012 monitoring processb. Base line survey with 2012 promotion10 Reinforcement Process11 Grievance EMP’s Annual Individual Livelihood Restoration Report 2012Page 3
LIST OF TABLESPageTable 1: Compensated and Returned Land by Land Use and Facility Type9Table 2: Land Use by Village in OFDA10LIST OF FIGURESFigure 1: Land Use Status on the 6 fields impacted villages9Figure 2: Compensated Files and Individuals to Date11Figure 3: Compensation Cash Payments to Date11Figure 4: # Compensations per individuals, Overall Project12Figure 5: Average Amount Received by Individuals, Overall Project12Figure 6: Synergy Strategy Flowchart13Figure 7: 2011-2012 Evolution of Impacted Households of OFDA14Figure 8: Distribution of Eligibility Factor Class14Figure 9: Land use of returned parcels15Figure 10: Eligibility Factor Evolution15Figure 11: Eligibility Factor Classification16Figure 12: Eloi Natodjingar eligible of Madana Nadpeur17Figure 13: Augustine Dandé18Figure 14: Josephine Lonodjigoto18Figure 15: Mathieu’s sheep barn and flock as granted by Project20Figure 16: Mathieu with his advisors next to the composting site21Figure 17: Mathieu in front of his Sorghum field21Figure 18: Economic Value of House22Figure 19: Training Effectiveness22Figure 20: Failure Indicators23Figure 21: Economic Value of House (Base line survey)23Figure 22: Individualized / participative reinforcement process24Figure 23: Benjamin Nadjiwanan of Dildo24Figure 24: Common cause analysis: Approved claims25Figure 25: Open Claims Cases25EMP’s Annual Individual Livelihood Restoration Report 2012Page 4
EXECUTIVE SUMMARYThe purpose of the Esso Exploration & Production Chad Inc (EEPCI) (the Project) Annual Individual Reportis to provide information on the number and status of people currently at risk agriculturally because ofProject land take impacts. It also follows the results of livelihood restoration activities completed,initiated or ongoing over the past year. The percentage of individuals/households whose situation hasbeen resolved or improved by the Project over the past year provides a measure of the efficacy of boththe EEPCI Environmental Management Plan department’s (EMP) programs and procedures regardinglivelihood restoration.2012 EMP Livelihood Restoration HighlightsLand Use Mitigation Action Plan (LUMAP) completed transitioning to ongoing socio-economic programand procedures. Continued the Synergy process to identify and focus on the real land users and thus stream linethe process, in order to keep resources on the individuals who could really benefit from theresettlement program. A village land use survey was completed in Ndoheuri in order to better evaluate the level ofimpact of the Project on this community and its population, resulting in the writing of a SiteSpecific Plan (SSP). A methodology was developed to survey affected villagers and communities ofthe Nya Moundouli field (Moundouli, Benguirakol and Bemira) in order to evaluate the level ofimpact of the Project on these communities and their population.Land use by project: Project land use has maintained a downward trend over the last 6 quarters. During2012 the project compensated land users for the use of 136.1 ha while returning 547.6 ha, resulting in anet year to year decrease of the footprint of 411.5 ha. Following this trend three villages have seen theirVillage Impact Classification downgraded from high to approaching high (Bero, Ngalaba and Danmadja).2012 Basic Business Skills Training (BBS) Highlights - 29 resettlement eligible people (eligibles), 24spouses of eligibles and 103 auditors (BBS is taught in the villages in an open format – non-eligiblevillagers are welcome to participate) completed their training. During the first four years of this program,almost 1,300 people participated in this training and achieved a reasonable level of proficiency in reading,writing, math and basic business management. Trained the management committees of 6 communities inthe area of financial and human resource management.2012 Improved Agriculture Highlights – In 2012, training in improved agriculture was started with 29eligibles. After completing their rainy season training and receiving their rainy season grant equipment,they went on to the dry season training in their option of choice. 90 eligibles of the 2011 promotion havecompleted the first year of formal training and have started the second year of training during whichpreviously acquired skills have been reinforced on an individual basis.EMP’s Annual Individual Livelihood Restoration Report 2012Page 5
Livelihood Restoration Monitoring – In view of the data collected through the village land use survey, itwas possible to identify the truly non-viable eligibles out of all those who had received improvedagriculture training as a restoration option over the last 10 years. This process resulted in a list of 45graduates qualified for monitoring. The monitoring of these graduates has been completed. This processhas allowed us to identify 15 eligibles that are facing particular challenges in terms of their recovery.Reinforcement - During 2012, 18 previously identified at-risk households/individuals have receivedreinforcement through a new individualized process. While 8 of them received both training andequipment another 10 chose to receive only some equipment.2013 Resettlement Eligible PromotionThere are 21 eligible people enrolled in the 2013 promotion. They completed the Steps of Reflectionprocess in November and December 2012. All of them selected Improved Agriculture Training as theirresettlement option.Community Compensation Completed the SSP, the selection process (Mini-MARP) and delivery of Supplemental CommunityCompensation project to village of Missimadji, a flour mill. Completed the SSP, the selection process (Mini-MARP) and started construction of SupplementalCommunity Compensation project to village of Ndoheuri, a one room school. SSPs for Bero III and Dokaidilti have not been fully implemented. While construction of the Dokaidiltirice production perimeter was completed in 2012, some extension activities still need to take place in2013.Land Management Manual Revision 8 of the Land Management Manual was completed in 2012. This new version integratesvarious improvements brought about to processes, a number of MOC approved since revision 7 andrecommendations of the various internal and external audits to have taken place in 2012, and reflectsnew organizational chart.2013 Work Plan Complete SSP for Naikam, Moundouli, Benguirakol and Bemira. Complete VLUS for Moundouli, Benguirakol and Bemira. Continue utilization of the Synergy, Impact Teams and Land Return Teams to identify and assessresettlement eligible people on a real time basis as land is acquired for Project use or returned tothe communities. Develop a process to accelerate the return of land associated with underground facilities. Continue to improve the delivery of BBSoTrain 21 eligibles in addition to auditors seeking to achieve basic literacy.EMP’s Annual Individual Livelihood Restoration Report 2012Page 6
oHold workshop in June.oTrain the community level management committees who selected flour mills as acommunity compensation to run these projects as effective and efficient small businesseso Trainers living in the villages to provide additional help to the traineesContinue to improve the delivery of Improved Agriculture Training:o90 eligibles will complete the Improved Agriculture Training Programo29 eligibles will complete the first year of the training program and will enter theindividualized skill reinforcement portion of the program to be completed in March 2014. o21 eligibles will start the IAT program in May 2013.oHold workshop in February, 2013.oReview course content in view of results of monitoring process.oEnsure adequacy of internal tracking process to monitor progress of eligibles.Continue to improve the quality and timely delivery of grant equipment and livestockoSelection of supplier through a more stringent bidding process.oQuality assurance and quality control with the supplier of the equipment and livestock.Continue to monitor performance of the EMP internal procedures on data analysis, stewardship,and planning oDamage Claim ManagementoConsultation, e.g. Grievance and Complaint managementoLand return and Quitus processMonitor level of recovery of previously trained impacted eligible individuals. 128 individuals willbe surveyed in order to identify those that are still at risk and could potentially benefit fromfurther reinforcement. ReinforcementoDeliver reinforcement to 29 previously trained at risk households. Initially surveyed in 2011they could not be incorporated into the 2012 roster.oLaunch the interview process and if possible deliver the reinforcement to 15 at riskhouseholds identified during the monitoring survey process in 2012. Complete delivery of Supplemental Community Compensation to Ndoheuri village Complete delivery of Supplemental Community Compensation to Dokaidilti and Bero III VillagesEMP’s Annual Individual Livelihood Restoration Report 2012Page 7
IntroductionBy the end of 2012, the Socio-Economic team through the Land Use Mitigation Action Plan (LUMAP) and theVillage Land Use Surveys have identified everyone in the 16 surveyed villages that is non-viable and marginal(both Project Affected and not Project Affected).Using sophisticated GIS tools and a relational database, it is now possible to combine this information withland use patterns and other variables in order to clearly identify those most at risk from the infill drilling anddevelopmental drilling programs land take. Furthermore it is also possible to identify for each HH and HHH theappropriate mitigation method which will best alleviate the effect of the land take which affected them.Knowing how each piece of land was being used at the time of the survey can assist us in projecting impact atthe individual, house hold and community level.With the establishment of each new element ofinfrastructure a number of processes can be triggered to update the information available on the affected HHand HHH. Through the intervention of the Synergy and Impact teams, the data is updated in an efficientmanner in order to confirm the identity of the affected HH and HHH and the resettlement options available tothem.Combining technology and highly trained individuals it is now possible to deal with each of these situations inreal time. Through the development of new streamlined intervention processes it will also be possible tofurther reduce the lag period required to bring about the required support at the HH, HHH and communitylevel. While this process is ongoing and new improvements will always be sought, the impact of thesechanges can already be perceived by those affected and at risk.The following pages will give the reader an outline of the situations of HH and HHH as they go through theprocess from the land take to resettlement and monitoring.EMP’s Annual Individual Livelihood Restoration Report 2012Page 8
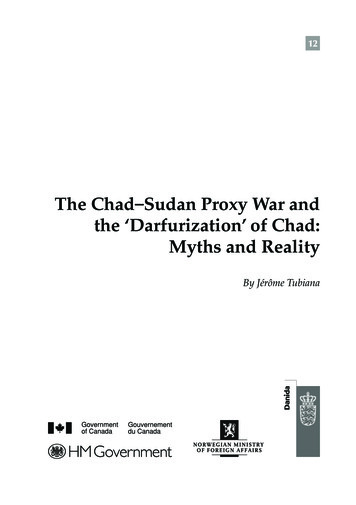
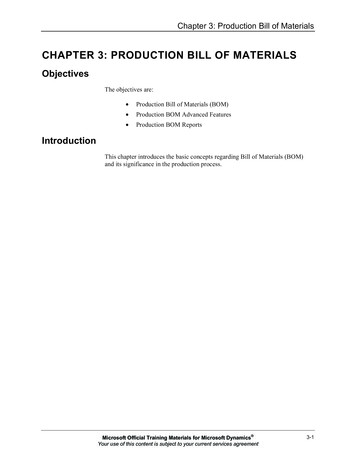
1. Land acquisitionAs shown in figure 1, the footprint of permanently andstill temporarily occupied acquired land (in the threeoriginal fields) was reduced to 2238 ha during 2012,the lowest level since 2005. Generally speaking theProject’s footprint has maintained a downward trendover the last two and a half years in spite of theestablishment of new facilities in the OFDA and theinfill drilling process.The land returned is not the only factor thatcounterbalances the new land take. The second factor is due to the fact that many of the new facilities beingestablished are in areas previously occupied by the project. An area already compensated for an initial facilityis simply reused for the new well, if it has not yet been returned, without requiring much additional landacquisition. Using the fault block approach in reclaiming land i.e. postponing reclamation until the work in thefault block has been completed, reduces the risk of wasting top soil by re-acquiring newly reclaimed land. Topsoil in the OFDA and elsewhere in southern Chad is a scarce resource.As was presented in figure 1, the data presented below (Table 1 on page 9) confirms that more land wasreturned than was compensated for new land take with a net footprint decrease over the year. During the lastyear the project’s footprint was reduced by 411.5 ha.Area (hectares)Table 1: Compensated and Returned Land byLand Use and Facility TypeLand us typeCompensatedReturnedNet annual changeSub-Total - Permanent with public accessSub-Total – Permanent with no Public access723.71007.959.4111.08%11 %1.714.6Sub-Total Permanent1731.6170.410 %16.3Borrow PitOthers55829.1448.521.480%74%-8.40.8Sub-Total – Temporary returned without restriction587.1469.980%-7.6Underground facilityOHLWell 0-5.1Sub-Total – Temporary returned with restriction1903.31343.271%-420.2Sub-Total Temporary2490.41813.173%-427.8Grand Total4222.01983.547%-411.5 The column “total areas in hectares: compensated” shows the total area compensated since the project started up to the end of the quartercovered in this report.“Total areas in hectares: returned” shows the total area returned since the project started up to the end of the quarter covered in thisreport.“Net annual change 2012” shows the net change in footprint by land use type over the year.6 fields Kome, Bolobo, Miandoum, Maïkeri, Nya and TimbreEMP’s Annual Individual Livelihood Restoration Report 2012Page 9
While land compensated for permanent uses exceeded land return, resulting in a net increase of 16.3 ha forthis category, the Project actually had a net reduction in its temporary land use of over 427 ha during the year.The accelerated return of land compensated for underground facilities was the main reason why the Projectwas able to reduce its overall footprint by such a large amount.During 2013 this initiative will be maintained with the aim of returning most of the 260 ha of undergroundfacilities that have not yet been returned. In addition to this a number of borrow pits are in the process ofbeing reclaimed in order to be returned over 2013.1.1By villageVillages in the Kome oilfield continue to have the majority of land take due to infill drilling. The calculation ofadditional land acquired is not straightforward as new facilities are now overlapping old facilities. Simpleaddition or subtraction would compute the same area twice to determine how much land has been acquiredor returned (delta column) compared to the previous quarter.When we consider the information presented in Table 2 we can easily note that the actual reduction in thearea occupied by the Project is not only limited to the case of villages located in the three original fields(Kome, Bolobo and Miandoum) but it also reflects the situation of villages located in the newer developmentareas of the OFDA (Maikeri, Timbre and Nya oil fields).During 2012, 20 villages saw an actual reduction in the Project’s footprint on their territory, 2 saw no changeand only 3 villages were affected by an increase of the Project’s footprint. Of these villages, Ndoheuri was themost severely impacted with a net increase of 9.6 ha. We must nonetheless note that the area occupied bythe project at present is lower than the peak land use in this village (presently 32.2 against a maximum of 37.1ha). Inversely the village of Ngalaba saw the largest reduction in the Project’s footprint. In fact 23% (58 ha) ofthe Project’s footprint was returned during the year.Table 2: Land Use by Village in OFDA.EMP’s Annual Individual Livelihood Restoration Report 2012Page 10
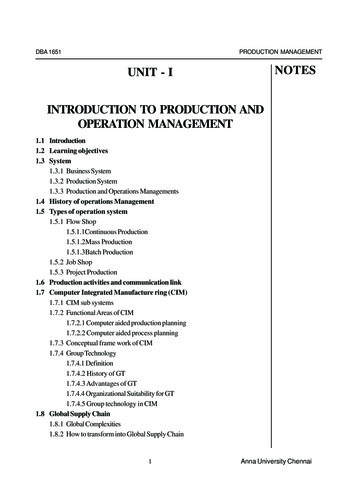
With the completion of the integration of impact survey data, all impacted individuals who are deemed tohave been made non-viable by the Project or who were already non-viable before being impacted by theProject, before November 1st 2012, (21 individuals) have been integrated into the roster of the 2013Resettlement Promotion, and are presently undergoing literacy training.If we consider the maximum land use of the Project, each of the 25 villages, on which such data is presented inthe table 2, has known a reduction of its footprint in relation to its land use peak. It should be noted that 3villages have seen the project’s footprint increase, during the year. In these Villages the Project has returnedmore land over the last few years than it has recently taken. This is the case for Ndoheuri which experiencedthe most drilling activity during this year.2. Compensation processEEPCI/TOCO compensates individuals for assets and investments, including fields, buildings and structures,kitchen gardens, beehives, individually owned wild or productive trees and fisheries according to the provisionof the Compensation and Resettlement Plan and according to a series of pre-established rates. The individualcompensation is paid either in-cash or in-kind, or a combination of both, as agreed to by the affectedindividual and EEPCI. Each year, after the rainy season and harvest, the compensation rates for fields andsundry items are reviewed annually if justified by price changes and inflation.Once the actual land parcel to be compensated isidentified, the Project with the assistance of theCanton Chief, village Chief or/and other localauthorities identifies the land users to becompensated or the impacted individuals.Since the start of the Project in 1998, 11,494individuals have been impacted and havereceived compensation (see figure 2). During2012, 1856 compensation files were created, thesecond smallest number of compensation filessince the start of the development phase in 2001.Since data is collected on the subject, the Projecthas paid out more than 9.4 billion XFAs in cash.Figure 3 gives an illustration of the levels ofpayment made since the start of the Project on ayear to year basis and on a cumulative basis. Wecan also note that 717 million XFAs weredisbursed during 2012.Both the number of compensation files and theamount disbursed in 2012 are illustrative of thereduction in the rate of drilling and the demobilization of 1 of the Project’s 3 rigs in 2011. As the projectprogressively slows down its development activities its need for new land will follow suit. A reducedrequirement for land will ultimately lead to fewer impacts, impacted individuals and compensation payments.EMP’s Annual Individual Livelihood Restoration Report 2012Page 11
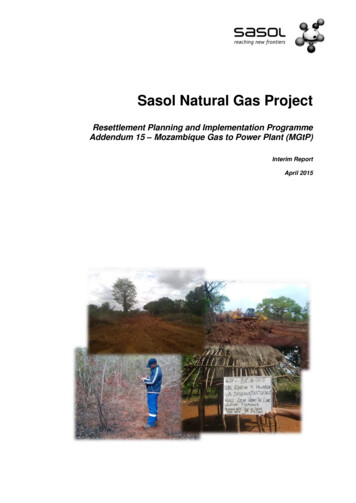
While 58 % of impacted individuals have, sincethe onset of the Project, only received onecompensation payment, 42 % of impactedindividuals have received 2 payments or more(figure 4). The record holder, over the life of theproject, has been compensated 66 times receiving12,648,800 CFAs (about 25 000 ), an average ofalmost 200 000 CFAs per compensation payment(about 400 ).For 2012, 75.8% of compensated individuals werecompensated only once and 24.2% receivingbetween 2 and 7 compensation payments. For the last year, 2 land users were impacted 7 times, receivingbetween 0.8 and 1.1 million CFAs (1600 -- 2200 ), an average of slightly more than 135 000 CFAs percompensation payment (270 ).The fact that a non-negligible portion of compensated individuals were impacted more than once is indicativeof the fact that: Land distribution is far from uniform within the population.Infill drilling has tended to impact areaspreviously impacted which may haveresulted in compensating the sameindividuals over and over.The impact of these two issues was attenuated bythe fact that a number of individuals who controllarge tracks of land tend to split this land betweentheir kin in an attempt to maximize theircompensation. This is reflected by the fact thatabout 83% of the compensation paymentsreceived were relatively small (less than 500,000CFAs or about 1000 ). (Figure 5)EMP’s Annual Individual Livelihood Restoration Report 2012Page 12
3. Synergy (identifying real land users)As was indicated in the previous section, many larger land owners tend to split their land base amongst theirkin when dealing with the Project. They developed these strategies over the years, as they came tounderstand a number of the Project’s policy, here are some examples. The Project will pay a compensation of 50 000 CFA’s for any cropped field of less than 1/8 of a cordesin area. By multiplying the number of very small fields they give life to the old adage “the whole isworth less than the sum of the parts”.An individual who has already received a resettlement package may declare land in the name of hisspouse or of a kin in order to indirectly profit from a second resettlement package or to offer thisadvantage to the beneficiary.In view of this strategy and in order to avoid the creation of many false eligibles who would in reality not bethe real land users, the project put in place the Synergy process. Based on previously collected informationsuch as the Village Land use Survey (VLUS) or previous Impact surveys and through field investigation theSynergy team identifies the real land users. The objective of this process is to focus as much as possible theattention of the project on the land users and thus stream line the process. Not doing so would result inwasting resources on the investigation of individuals who could not truly benefit from the resettlementprogram.With the acceleration of the land return process it became necessary to track returned facilities and identifythe users of these plots. Here again the identification of the real user is a critical issue as it makes it possibleto measure the positive impact the project is having on households as it returns land. It should never beforgotten that the ultimate goal of the Resettlement Program is to restore the livelihood of impactedhouseholds, and that the best way of doing so is to return land to them as rapidly as possible. It is alsoimportant to identify these vulnerable individuals as fast as possible, in order to integrate them in theappropriate Resettlement Program.1. As part of the land acquisition Synergy strategy the teaminvestigated 976 individuals (members of 572households), between November 1st 2011 and October31st 2012*. These compensated individuals wereaffected by the creation of 179 new facilities requiring196.4 ha. 634 compensated individuals were thus foundnot to be real land users and ineligible to resettlement.(Figure 6)2. 35.0% of individuals that were compensated will besurveyed as part of the land take impact survey.3. Avoid to survey 634 individuals who are not real landusers. As the Resettlement process starts in November of the year it is necessary to close the eligibility list onOctober 31st, resulting in an operating year which does not correspond to the calendar yearEMP’s Annual Individual Livelihood Restoration Report 2012Page 13
4. Impact survey (Identifying eligibles)The main purpose of the Impact Process is to identify eligibles. While the Impact survey per say makes itpossible to collect a vast array of information regarding real land users who have been impacted by theproject, whether negatively through a land take or positively through a land return, its main goal is to collectdata on the two key factors used in the calculation of the eligibility factor, being: Size and make-up of the household. As a household grows or shrinks it requires more or less land tosustain itself. The number of members in households has been shown to be the dominant driver indetermining the eligibility factor.Land basket available to the household in order to sustain itself, as theland basket changes through transactions between members of anextended family or land take and return by the project.Between November 1st 2011 and October 31st 2012, 453 HHs were touched atleast once by the Project in the 16 core villages of the OFDA. Of these, 218 hadbeen surveyed in 2011 either through a VLUS or a prior Impact Survey.To gain a better understanding of the situation of individuals who interactedwith the Project over the last year, we must consider the information presentedin figure 7. This information can be summarized in the following way: The eligibility factor class (EFC) of 174 households remained unchangedbetween the latest survey in 2011 and the latest survey in 2012. 22 households went down 1 eligibility factor class. Only 2 of thesebecoming non-viable. 22 improved their situation by going up one EFC. More HHs left the non-viable EFC than entered it (3 leaving vs 2 entering)Figure 8 presents the distribution of the households impacted by the Project by EFC in both 2011 and 2012.While there is not a large difference one must note that the project has been able to reduce or limit its impacton those most at risk, the non-viable. The accelerated land return process put in place in the early part of 2012as had, we believe, a role in this improved performance.The information presented in Figure 7 has brought us to believe thatwe must monitor the condition of individual households as they arecontinuously evolving. In order to do so the EnvironmentalManagement Plan’s Information System (EMPIS) must be able tomonitor HHs in real time and in a relatively continuous fashion.To work in real time, is to deal with an issue or an individual at thetime the event takes place, whether it be a land take or a landreturn. Changes in the processes which took place in late 2010 and2011 have made it possible to all but eliminate the backlog andaddress issues when the need arises. The EMPIS has been operatingin real time throughout 2012.In October 31st the EMPIS team was able to produce the list of the 21 individuals that were deemed to beeligible for resettlement during the 2013 program. These individuals were slated to participate in the Steps ofReflection process in late 2012. (See section 6, page 18)EMP’s Annual Individual Livelihood Restoration Report 2012Page 14
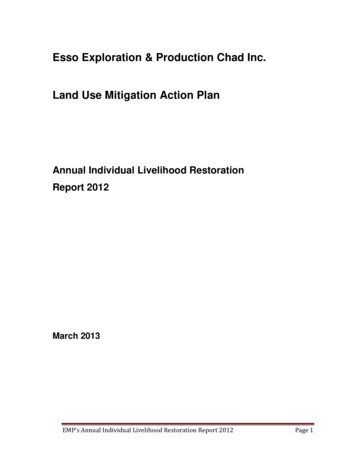
5. Land return surveys 2012As is the case for the impact surveys the land surveys are presently being done in real time, or during the nextproduction season following land return. 430 Land Return surveys were completed during 2012. Most of thesurveys performed during the last year related to land return activities in the villages of Bero, Begada, Madjo,Mbanga and Ngalaba.Over 2012 we will thus have identified thebeneficiary and level of use of the landassociated with the return of 217 facilities.In view of the fact that the return of onefacility may benefit multiple households theinterview process collected information onthe state of 353 households.Figure 9: Land use of returned parcelsAbandonned0.3%Cultivated,An analysis of the information collected44.7%indicated that 99.7% of the returned landFallowed,was incorporated into the land basket of the55.1%surveyed households. While 44.7% of thereturned land was put into productionimmediately, 55.1% of the land was left infallow to be brought into production in thenear future. The remainder, or 0.3%, isslated to be abandoned. It must be notedthat the decision to classify a returned parcel of land as fallow (thus usable for agriculture) or abandoned(unusable for agriculture) is left solely to the discretion of the beneficiary. (See figure 9)As one household may receive land from a number of facilities the status of one household may have beenmeasured a number of times during the year. As some of these 353 households have been surveyed morethan once, we have monitored 430 distinct impacts.Before we tak
CFA COFEMAB CRCP ECMG EEPCI EMP EMP IS GIS GoC IFC ITRAD KPI LCC LMM LUMAP MARP NGO ONDR SSP WARDA . 4 Impact survey (Identifying eligibles) 14 5 Land Return Surveys 2012 15 . Compensation project to village of Missimadji, a flour mill. Completed the SSP, the selection process (Mini-MARP) and started construction of Supplemental .