Transcription
12th Brazilian Workshop on Real-Time and Embedded Systems63Performance Characterization ofReal-Time Operating Systems for Systems-on-SiliconDouglas P. B. Renaux1,3, Rafael E. De Góes3, Robson R. Linhares2,31Departamento Acadêmico de Eletrônica (DAELN)Universidade Tecnológica Federal do Paraná (UTFPR)Av. Sete de Setembro 3165 – Curitiba – PR – Brasil2Departamento Acadêmico de Informática (DAINF)Universidade Tecnológica Federal do Paraná (UTFPR)Av. Sete de Setembro 3165 – Curitiba – PR – Brasil3eSysTech – Embedded Systems TechnologiesTravessa da Lapa 96, cj 73 – Curitiba – PR - om.br;robson@dainf.ct.utfpr.edu.brAbstract. An RTOS is a software component that is used in the majority of thereal-time embedded systems. It has a significant effect on the system’sperformance and reliability. This paper addresses the issue of publishingparameterized performance characteristics of an RTOS in a platformindependent manner.Concepts of parametric timing analysis were extended to consider theperformance of the processor, memory and peripherals in a parameterizedway. The proposed method was applied to a commercial RTOS. Validation ofthe method shows results with a precision better than 10%.Key-words: timing analysis, WCET (Worst Case Execution Time), RTOS(Real-Time Operating System) performance characterization, COTS(Commercial Off The Shelf) software component performance.1. IntroductionAs embedded systems complexity and diversity are constantly increasing, developersface a number of opposing needs in the design cycle. The development time and effortcan be reduced with the use of both hardware and software COTS components,however, these components must be appropriately integrated and characterized inadvance. High-volume production costs can be reduced with the use of the highintegration Systems-On-Silicon (SOS), however, this poses stringent demands on thedesign process and tools, demanding the use of hardware-software co-design and heavyuse of modeling, simulation and estimation, since the actual hardware is available onlynear the end of the design cycle.Current fabrication technologies allow for dies with less than 30 mm2 to implement over50 million transistors using below-40 nm processes. Complete systems can beimplemented in a single die, including multiple processor cores, RAM, Flash, dynamic
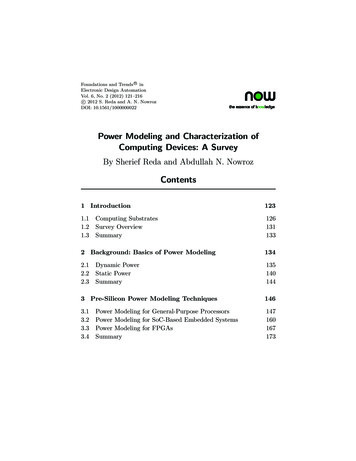
64ProceedingsRAM, and several types of generic and special purpose peripheral units that implementcommunication channels, audio and video processing, interfaces to data storage devices,among many others.An essential COTS component used in most of current embedded systems designs is theRTOS. It provides an abstraction of the hardware and manages its resources allowingthe software development team to focus on the application specific software. Althoughthe RTOS contributes heavily to the performance and robustness of the final system, itsperformance is usually described very coarsely, mainly citing the context switch timesand latencies. In most embedded system’s designs, and particularly in those using SOS,a much more detailed performance characterization is required, so that the finalsystem s performance can be accurately predicted in early phases of the design. Designcycles are too lengthy and costly to allow for a second attempt to achieve the desiredperformance.The aim of this paper is to propose a means of describing the performance of an RTOS.The rationale for such a description is fourfold:1. RTOS execution times and blocking times are essential information to be used inthe schedulability analysis of real-time systems;2. when comparing different RTOSes as alternatives for a design, specific RTOSconfigurations can be compared from a performance point of view;3. the application programmer can identify which RTOS services are timeconsuming or have execution times that are not compatible with given responsetime requirements;4. when combined with the performance data of the other components of thesystem, the performance of the whole system can be accurately predicted andchecked against the performance requirements.It is important to notice that the performance characterization of an RTOS is severelydependant on the HW platform where it runs. The embedded world is characterized by avery large variety of hardware platforms, as opposed to the standardized hardwareplatforms of general computing (such as PCs and Macs). To encompass such a largevariety of hardware platforms we use parameterized generic hardware models, as noRTOS provider would be able to provide performance data for every possible embeddedhardware platform and their various configurations.2. Problem StatementA typical embedded systems development process is illustrated at a high level in Figure1. Such a process may be used both when silicon is designed for a specific applicationas well as when COTS HW components are used. It is important to realize that in thisprocess, HW and SW are designed and implemented concurrently (HW/SW co-design).Actual measurements of performance can only be done on the final HW platform in theIntegration phase, however, particularly when specific SOS is designed for thisapplication, a good estimate of system performance must be already available during theSystem Design phase.
12th Brazilian Workshop on Real-Time and Embedded Systems65Figure 1 - Typical SOS development processIn Figure 1, the activities preceding Sys Specs and those after System Tests are notshown. In the System Design phase, the identification and characterization of COTSHW components (from libraries and catalogs of HW components), COTS SWcomponents (including RTOS), custom HW component definition (including glue logicand application specific HW), and custom SW component definition (SW wrappers andapplication specific SW) is done. In this phase, the performance of the final system mustbe estimated based on the documented performance of its COTS components andestimated performance of the HW and SW components to be developed.During the design and development phases, models, simulators and evaluation boardsmay be used to support prototyping and performance evaluations. The level of precisionof the simulators and the similarities of the evaluation boards when compared to theactual hardware will define how accurate these performance estimates are.The problem we are addressing in this research is to identify a way that an RTOSprovider (or any other SW component provider) can document the performancecharacteristics of his product. Since RTOS are used in a wide range of HW platforms,and since the performance of the HW platform strongly affects the RTOS performance,a means is required to parameterize the performance characteristics of the RTOS. In thispaper we propose such a means, and we evaluate the proposed means on a commercialRTOS.3. Literature ReviewThe determination of the Worst Case Execution Time of real-time software is a subjectof study for over a decade. Many conferences deal with this subject. Since 2001 aWCET Workshop is held along to the Euromicro conference. Among the vast literatureavailable, the papers most closely related to our research are described in this section.Colin, A., and Puaut, I. (2001) analyzed the RTEMS RTOS and identified severalproblems that made the analysis difficult and imprecise: unstructured code in the RTOS,use of dynamic function calls, and unknown bounds in loops. They reported an 86%overestimation on the WCET.Sandell, D., Ermedahl, A., Gustafsson, J., and Lisper, B. (2004) reported other types ofproblems when analyzing the WCET of RTOS services: high dependency of executiontimes on the RTOS configuration; high dependency of loop bounds on the RTOS state;and high variation of execution times depending on the current mode of the RTOS.Puschner, P. and Schoeberl, M. (2008) proposed a means of avoiding unpredictabilityof execution times by rethinking HW and SW implementations: (1) use of single pathprogramming; (2) simplifying HW design; and (3) perform static scheduling of accesses
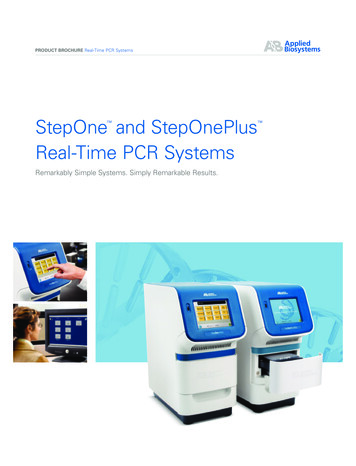
66Proceedingsto shared memory. The achieved gain in predictability came at a high cost of alwaysexecuting both the “then” and the “else” part of a decision, and discarding the results ofone of the parts, as well as significantly reducing the performance of the HW.Lv, M., Guan, N., Zhang, Y., Deng, Q., Yu, G., Zhay, J. (2009) present a survey on thefive most prominent techniques for WCET analysis of RTOS. They also identified threechallenges still to be resolved: (1) Parametrization of WCET; (2) Combining the WCETof the application with the WCET of the RTOS; and (3) Combining WCET analysis andschedulability analysis.A significant step forward was achieved by Altmeyer, S., Hümbert, C., Lisper, B., andWilhelm, R. (2008) who developed a parametric timing analysis. Instead of thetradicional way of representing the WCET of a service by a single value, they representit by a formula that includes the service call parameters that affect the execution time.The dependency of the RTOS state was not modeled.4. Proposed RTOS Performance ModelingThe aim is to characterize the performance of the kernel. To do that in a broad andprecise manner the following information is required:1. Execution characteristics of each service on a generic hardware platform. This isprocessor’s architecture specific since a change to the architecture implies inchanges the machine code.2. A model of how the service calls arguments and the RTOS state affect theservice’s execution time.3. A characterization of the memory regions that are used and their latencies, forsingle read, single write, burst read and burst write.4. A model of blocking during the execution of each service. Blocking, if it occursat all during calls to a given service, can be in forms such as: masking allinterrupts, masking specific interrupts, and preventing context-switches, i.e.preventing preemption.The RTOS performance characterization proposed here is based on a parameterizedgeneric hardware model (Figure 2). Hence, all performance data that is provided isdependent of the parameters of the hardware, such as clock frequency, memorylatencies, and peripheral latencies.4.1. Performance Parameters Definition ProcessThe process to be used to determine the performance parameters of an RTOS is depictedin Figure 3. Starting with the source code of the RTOS under analysis, a static analysisis performed to determine the path that determines the worst-case execution time ofeach service. Then, a test case is build that exercises this path. This test case is executedand its execution is logged, at instruction level. The log, or execution trace, is thenanalyzed to extract information about the number of accesses to each peripheral ormemory section (PRi and MRj in Figure 2). The sections of source code that causeblocking or that are dependent on arguments or state are identified during the staticanalysis and their execution parameters are identified as well.
12th Brazilian Workshop on Real-Time and Embedded SystemsParameters:Linker Information:- bus width- bus clock- .aicPRn- bus width- bus clock- .timer2.uart-.textMR1PR167.Parameters:- core clock-.Processorbus widthbus clockwait statesburst characteristics .MRm.x thread stack-bus widthbus clockwait statesburst characteristics.bss.dataPRi Peripheral addressing region iMRj Memory addressing region jFigure 2 - Parameterized Generic Hardware ModelThe process described in Figure 3 is executed by the RTOS provider (or any other SWcomponent provider) to obtain the performance characterization of the RTOS. The useof this information is described in Section 4.2.Figure 3 - Performance parameters definition processThis process combines static and dynamic techniques, aiming at obtaining the bestpossible results from each one. In our validation (Section 5), we used LDRA Testbed[LDRA Testbed (2010)] and PERF [Renaux, D. P. B. ; Góes, J. A. ; Linhares, R. R.(2002)] for the static analysis; here, the possible execution paths are extracted and theWCET path is identified. Then, a SW developer elaborates a test case that exercises the
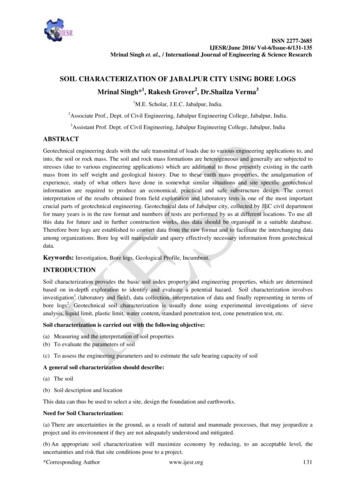
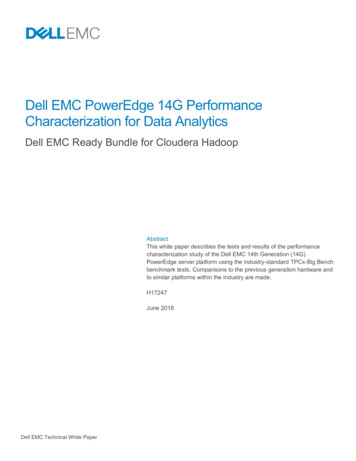
68ProceedingsWCET path. This test case is executed on real hardware, or on a instruction levelsimulator. The execution is monitored by a trace tool that records the execution trace. ASegger s J-Trace unit [Segger(2010)] was used as well as the trace recordingfunctionality of the IAR s EWARM IDE [IAR(2010)].At this stage of our research, we are evaluating the proposed method; hence, there areno tools yet to support the analysis of the trace. As such, the two final steps wereperformed manually. The execution traces of the service calls range from less than teninstructions execution to around 600 instructions. This is the case of a call toCreateThread, which is analyzed in Section 5.4.2. System Performance EstimationThe performance of the final system can be estimated by combining information fromthree different sources:1. The RTOS provider. Using the process depicted in Section 0, the RTOSprovider publishes the performance parameters of all the RTOS services as wellas RTOS internal activities.2. The Hardware designer. During the design phase the hardware designeridentifies the performance characteristics of the processor as well as the accesscharacteristics to each memory/peripheral region.3. The Software integrator. He provides the mapping between the linker sections(listed in the RTOS performance characterization) and the correspondingphysical memory/peripheral regions.Once these three sets of information are available, it is possible to estimate the WCETof each service of the RTOS on the final system, as well as the WCET of the internalactivities of the kernel, such as the timer interrupt handler.Furthermore, it should be noted that the RTOS traces change for every processorarchitecture, and for different configurations of the RTOS (if this is the case). Hence,the RTOS provider must perform this analysis, and publish their results, many times.For the case described here, the traces are for the X Real-Time Kernel[eSysTech(2008)] configured for ARM7TDMI processors. Hence, these traces representthe execution of this RTOS on any HW platform based on this processor core.5. ValidationThe RTOS used as testbed in this research is the X Real-Time Kernel, developed byeSysTech Embedded Systems Technologies. A technical cooperation agreementbetween UTFPR and eSysTech resulted in a long term collaboration between the LIT(Laboratory for Innovation and Technology in Embedded Systems) at UTFPR andeSysTech. The X Real-Time Kernel, or simply X, is representative of microkernels usedin deeply embedded systems. It is basically composed of the following modules:microkernel, hardware abstraction layer (X-HAL), shell, event tracing, TCP/IP stack,USB stack, FAT 16/32 and graphics library. The structure of this kernel is depicted inFigure 4 – see eSysTech (2008).
12th Brazilian Workshop on Real-Time and Embedded Systems69Figure 4 - X Real-Time Kernel StructureX is being used extensively in embedded systems designed by eSysTech and by itscustomers. Concerning the first case (systems designed by eSysTech), the companyreports [eSysTech(2010)] that, in given applications, over 95% of the embedded code ispart of the kernel, hence less than 5% of the code needs to be developed to produce anew system. In such a case, where the application logic is relatively simple compared tothe RTOS functionalities (scheduling, USB stack, etc) the latter plays an even moresignificant role in determining the performance of the system.
70Proceedings5.1. Performance Characterization of the CreateThread Service CallAs a result of this research, the characterization of all calls to the X’s microkernel(called the microkernel s methods in the X literature) is being performed. One of suchmethods was selected to be presented here: CreateThread. It concerns access to theinternal data structures of the microkernel, as well as to the thread’s stack. It is one ofthe most complex and lengthy of the microkernel’s methods. It was selected asrepresentative of the effectiveness of the proposed performance characterization.Definition of the CreateThread Service Call:TId X::CreateThread(void (* t main) (uint32 t, uint32 t),uint32 t arg1,uint32 t arg2,const char * name,uint32 t stack size,uint32 t put queue size,uint32 t config,uint32 t priority)Following the process described in Section 4.1, the first activity is the static analysis.The flowgraph of CreateThread was extracted by the LDRA Testbed tool (Figure 5).The analysis of this flowgraph indicates no timing dependency to any of the parametersof the call. The only timing dependecy is to the state of the kernel’s internal heap: to thecurrent number of segments present in a linker section named x heap. A test case iselaborated aiming at creating a given number of segments in the heap before the call toCreateThread is performed. The test case is then executed and its trace is recorded.The kernel accesses the following linker sections, i.e. logical addressing spaces that aremapped to physical addressing spaces at link time are:.iram text: a code section with functions that require fast execution times;.text: code section with most of the functions of the kernel;.const: read only data section;.stack: section for the stack;.x heap: a heap section used only for the internal data structures of the kernel.The trace is then analyzed to identify its sections and the characterize the accesses donein each section. A trace section is a part of the trace that has the same repetition andblocking characteristics. The table below presents the result of the analysis of the traceof the execution of the test case of CreateThread. It is divided in three sections: the firstis executed once without blocking; the second is executed once with blocking(interrupts are disabled), and the third is executed N times and also with blocking (againinterrupts are disabled). The number of executions of the third section (N) is given bythe number of segments in the x heap.
12th Brazilian Workshop on Real-Time and Embedded Systems71Figure 5 - LDRA Testbed Static Analysis - Flowgraph of CreateThreadThe process in Section 4.1 finishes by publishing the following performance parametersfor CreateThread. The values in columns “i” to “w8” are the number of accesses to eachof these linker sections in each of the trace sections.Performance characterization for the sections of 741000Y492687325412361925Y0180022000Where:Sec code section of CreateThread; each section has different repetition and blockingcharateristics.Rep number of times the execution of this section is repeated (N represents thecurrent number os segments in kernel’s internal heap).Block indicates if this section of code blocks preemption by disabling interrupts.
72ProceedingsLogical sections (also known as linker sections):i iram text – frequently used kernel code, usually allocated to fast memory;t text – code area;c const – constants in code area;s stack;b number of branches (jumps);r32 32-bit wide read accesses to the x heap area;w32 32-bit wide write accesses to the x heap area;r8 8-bit or 16-bit wide read accesses to the x heap area;w8 8-bit or 16-bit wide write accesses to the x heap area.5.2. Performance ValidationGiven the performance parameters from Section 5.1, the values of WCET of a call toCreateThread were estimated for three different hardware platforms using the sectionmapping information provided by the software integrators of each test program (one testprogram per hardware platform) and the hardware access times provided by eachhardware designer. The execution times were also measured on real hardware, since thethree hardware platforms are available. The comparison of the estimated and measuredresults are shown below.In these experiments, the call to CreateThread was performed when the kernel’s heapwas fragmented into 13 segments. Hence, N 13 for the third section.Hardware platforms description:1. ARM7TDMI@72MHz with 16 MBytes of external 32-bit wide SDRAM and32KBytes of internal SRAM;2. ARM7TDMI@72MHz with 64KBytes of internal SRAM;3. ARM7TDMI@72MHz with 1 MByte of external 16-bit wide SRAM and32KBytes of internal SRAM.Test on hardware platform ime14147070250200200200200Total time72872105603430210007800720038005000Total estimated execution time: 56,728 ns (addition of values in last row).Measured execution time: 51,111 nsnsns
12th Brazilian Workshop on Real-Time and Embedded Systems73Test on hardware platform ime141414144514141414Total time72872101126863780546504266350nsnsTotal estimated execution time: 14,182 ns (addition of values in last row).Measured execution time: 14,137 nsTest on hardware platform ime1416016018045016020080120Total time7288240012808820378006240720015203000nsnsTotal estimated execution time: 148,988 ns (addition of values in last row).Measured execution time: 146,400 nsAn analysis of these results show that the estimated performance is both safe (estimatedexecution times are never lower than actual execution times) and have a lowoverestimation (maximum of 10%). When the memory accesses are more predictable,such as the case of internal SRAM, the overestimation was lower than 1%.At the current stage of development, the effects of the SDRAM access buffers andcache memories are not modeled. Once this models are developed and included in ourperformance characterization data, we expect to achieve even better results.6. ConclusionThis paper presents a significant contribution of considering the performance ofhardware components in the characterization of the performance of an RTOS. This wasachieved in a three step process: (1) the RTOS provider publishes the parameterizedperformance characteristics of his RTOS; (2) the HW designer provides the accesstime characterization of a specific hardware platform; and (3) the SW integratorprovides the mapping of the logical sections listed by in the RTOS characteristics to thephysical devices of the actual system’s hardware. From the combination of theinformation provided by these three sources precise performance estimations can beobtained.This research extends previous parametric timing analysis by considering the effects ofthe internal RTOS state and data structures and the characteristics of hardwarecomponents to obtain more accurate performance estimations.To illustrate the method, a representative kernel service was selected: CreateThread.The same method applies to the other services of the kernel.
74ProceedingsThe process presented here was experimented on microcontrollers using anARM7TDMI core. These cores do not use cache memories, hence, these were notconsidered in the model so far. Future versions of the proposed model will considerother architectures, such as the Cortex-M4 and the Cortex-A8 and will include theeffects of the cache in the performance characterization. Also, we are evaluating thedevelopment of tools that would automate some of the activities (mainly PerformanceParameters Identification and Extraction) that are currently performed by hand.ReferencesAltmeyer, S., Hümbert, C., Lisper, B., and Wilhelm, R. (2008) “Parametric timinganalysis for complex architectures” In: The 14th IEEE International Conference onEmbedded and Real-Time Computing Systems and Applications (RTCSA).Colin, A., and Puaut, I. (2001) “Worst-case execution time analysis of the RTEMS realtime operating system” 13th Euromicro.eSysTech (2008) X Real-Time Kernel, Programmer s Manual, 2008.eSysTech (2010) “Code functionality assessment and performance measurements forthe ISPI project”, Internal Report, Feb 2010.IAR (2010) “IAR Embedded Workbench for A (2010) “Software Development and Testing with LDRA Testbed”http://www.ldra.com/testbed.asp.Lv, M., Guan, N., Zhang, Y., Deng, Q., Yu, G., Zhay, J. (2009) “A Survey of WCETAnalysis of Real-Time Operating Systems”, In: 2009 International Conference onEmbedded Software and Systems. IEEE.Puschner, P. and Schoeberl, M. (2008) “On composable system timing, task timing,and WCET analysis” In: WCET 2008.Renaux, D. P. B. ; Góes, J. A. ; Linhares, R. R. (2002) “WCET Estimation from ObjectCode implemented in the PERF Environment” In: Second International Workshop onWorst-Case Execution Time Analysis, 2002, Viena. WCET'2002 - 2nd InternationalWorkshop on Worst-Case Execution Time Analysis, 2002. v. 1. p. 28-35.Sandell, D., Ermedahl, A., Gustafsson, J., and Lisper, B. (2004) “Static timing analysisof real-time operating system code” In: 1st International Symposium on LeveragingApplications of Formal Methods.Segger (2010) “J-Trace ARM”. http://www.segger.com/cms/j-trace-arm.html
at all during calls to a given service, can be in forms such as: masking all interrupts, masking specific interrupts, and preventing context-switches, i.e. preventing preemption. The RTOS performance characterization proposed here is based on a parameterized generic hardware model (Figure 2). Hence, all performance data that is provided is