Transcription
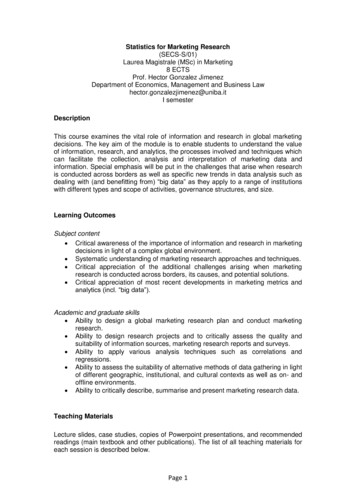
Q.1 Differentiate between Data warehouse and Data mining.Data Mining and Data Warehousing both are used to holds business intelligence and enable decision making.But both, data mining and data warehousing have different aspects of operating on an enterprise’s data. On theone hand, the data warehouse is an environment where the data of an enterprise is gathering and stored in aaggregated and summarized manner. On the other hands, data mining is a process; that apply algorithms toextract knowledge from the data that you even don’t know exist in the database.Data Warehouse is a central location where information gathered from multiple sources are stored under asingle unified schema. The data is initially gathered, different sources of enterprise then cleaned andtransformed and stored in a data warehouse. Once data is entered in a data warehouse, it stays there for a longtime and can be accessed overtimes.Data Warehouse is a perfect blend of technologies like data modelling, data acquisition, data management,metadata management, development tools store managements. All these technologies support functionslike data extraction, data transformation, data storage, providing user interfaces for accessing the data.Key Differences between Data Mining and Data WarehousingThere is a basic difference that separates data mining and data warehousing that is data mining is a process ofextracting meaningful data from the large database or data warehouse. However, data warehouse provides anenvironment where the data is stored in an integrated form which eases data mining to extract data moreefficiently.Q.2 Explain the K-mean and K-medoid algorithm with example.k-means is one of the simplest unsupervised learning algorithms that solve the well-known clustering problem.The procedure follows a simple and easy way to classify a given data set through a certain number of clusters(assume k clusters) fixed apriori. The main idea is to define k centers, one for each cluster. These centers shouldbe placed in a cunning way because of different location causes different result. So, the better choice is to placethem as much as possible far away from each other. The next step is to take each point belonging to a given dataset and associate it to the nearest center. When no point is pending, the first step is completed and an earlygroup age is done. At this point we need to re-calculate k new centroids as barycenter of the clusters resultingfrom the previous step. After we have these k new centroids, a new binding has to be done between the samedata set points and the nearest new center. A loop has been generated. As a result of this loop we may notice
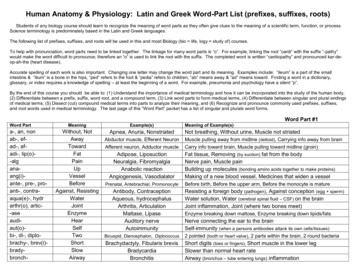
that the k centers change their location step by step until no more changes are done or in other words centers donot move any more. Finally, this algorithm aims at minimizing an objective function knows as squared errorfunction given by:where,‘ xi - vj ’ is the Euclidean distance between xi and vj.‘ci’ is the number of data points in ith cluster.‘c’ is the number of cluster centers.Algorithmic steps for k-means clusteringLet X {x1,x2,x3, .,xn} be the set of data points and V {v1,v2, .,vc} be the set of centers.1) Randomly select ‘c’ cluster centers.2) Calculate the distance between each data point and cluster centers.3) Assign the data point to the cluster center whose distance from the cluster center is minimum of all thecluster centers.4) Recalculate the new cluster center using:where, ‘ci’ represents the number of data points in ith cluster.5) Recalculate the distance between each data point and new obtained cluster centers.6) If no data point was reassigned then stop, otherwise repeat from step 3).The k-medoids algorithm is a clustering algorithm related to the k-means algorithm and the medoidshiftalgorithm. Both the k-means and k-medoids algorithms are partitional (breaking the dataset up into groups). Kmeans attempts to minimize the total squared error, while k-medoids minimizes the sum of dissimilaritiesbetween points labeled to be in a cluster and a point designated as the center of that cluster. In contrast to the kmeans algorithm, k-medoids chooses data points as centers ( medoids or exemplars).K-medoids is also a partitioning technique of clustering that clusters the data set of n objects into k clusterswith k known a priori. A useful tool for determining k is the silhouette.
It could be more robust to noise and outliers as compared to k-means because it minimizes a sum of generalpairwise dissimilarities instead of a sum of squared Euclidean distances. The possible choice of the dissimilarityfunction is very rich but in our applet we used the Euclidean distance.A medoid of a finite dataset is a data point from this set, whose average dissimilarity to all the data points isminimal i.e. it is the most centrally located point in the set.The most common realization of k-medoid clustering is the Partitioning Around Medoids (PAM) algorithmand is as follows:1. Initialize: randomly select k of the n data points as the medoid2. Assignment step: Associate each data point to the closest medoid.3. Update step: For each medoid m and each data point o associated to m swap m and o and compute thetotal cost of the configuration (that is, the average dissimilarity of o to all the data points associatedto m). Select the medoid o with the lowest cost of the configuration.Repeat alternating steps 2 and 3 until there is no change in the assignments.Q.3 Explain the multidimensional data model with example.The databases that are configured for OLAP use multidimensional data model, enabling complex analysis andad hoc queries at a rapid rate. The multidimensional data model is analogous to relational database model with avariation of having multidimensional structures for data organization and expressing relationships between thedata. The data is stored in the form of cubes and can be accessed within the confines of each cube. Mostly, datawarehousing supports two or three-dimensional cubes; however, there are more than three data dimensionsdepicted by the cube referred to as Hybrid cube.Data warehouses and OLAP tools are based on a multidimensional data model. This model views data in theform of a data cube. “What is a data cube?” A data cube allows data to be modeled and viewed in multipledimensions. It is defined by dimensions and facts. In general terms, dimensions are the perspectives or entitieswith respect to which an organization wants to keep records. Each dimension may have a table associated withit, called a dimension table, which further describes the dimension. A multidimensional data model is typicallyorganized around a central theme, like sales, for instance. This theme is represented by a fact table. Facts arenumerical measures.
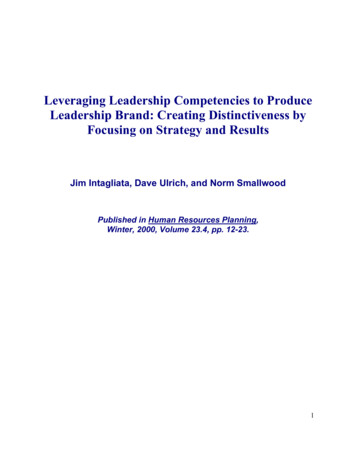
Table: A 2-D view of sales data according to the dimensions time and item, where the sales are from brancheslocated in the city of Vancouver. The measure displayed is dollars sold (in thousands).Q.4 Explain the tuning and testing of Data Warehouse.A data warehouse keeps evolving and it is unpredictable what query the user is going to post in the future.Therefore it becomes more difficult to tune a data warehouse system. In this chapter, we will discuss how totune the different aspects of a data warehouse such as performance, data load, queries, etc. There is little that can be done to tune any business rules enforced by constraints. If the rules areenforced by using SQL or by triggers code, that can needs to be tuned to maximal efficiency.The load can be also improved by using parallelism.The data warehouse will contain two types of query. There will be fixed queries that are clearly definedand well understood, such as regular reports, common aggregations, etc.Often the correct tuning choice for such eventualities will be to allow an infrequently used index oraggregation to exist to catch just those sorts of query.To create those sorts of indexes or aggregations, you must have an understanding that such queries arelikely to be run.Before you can tune the data warehouse you must have some objective measures of performance towork with. Measures such as Average query response times Scan rates I/O throughput rates Time used per query Memory usage per process These measure should be specified in the service level agreement (SLA).ETL or Data warehouse testing is categorized into four different engagements:New Data Warehouse Testing – New DW is built and verified from scratch. Data input is taken fromcustomer requirements and different data sources and new data warehouse is build and verified with thehelp of ETL tools.Migration Testing – In this type of project customer will have an existing DW and ETL performingthe job but they are looking to bag new tool in order to improve efficiency.Change Request – In this type of project new data is added from different sources to an existing DW. Also,there might be a condition where customer needs to change their existing business rule or they might integratethe new rule.Report Testing – Report are the end result of any Data Warehouse and the basic propose for which DW isbuild. Report must be tested by validating layout, data in the report and calculation.Q.5. Differentiate between KDD and Data mining.KDD is a field of computer science, which deals with extraction of previously unknown and interestinginformation from raw data. KDD is the whole process of trying to make sense of data by developing appropriatemethods or techniques. This process deal with the mapping of low-level data into other forms those are morecompact, abstract and useful. This is achieved by creating short reports, modeling the process of generating dataand developing predictive models that can predict future cases. Due to the exponential growth of data,especially in areas such as business, KDD has become a very important process to convert this large wealth of
data in to business intelligence, as manual extraction of patterns has become seemingly impossible in the pastfew decades.Data Mining is only a step within the overall KDD process. There are two major Data Mining goals as definedby the goal of the application, and they are namely verification or discovery. Verification is verifying the user’shypothesis about data, while discovery is automatically finding interesting patterns. There are four major datamining task: clustering, classification, regression, and association (summarization). Clustering is identifyingsimilar groups from unstructured data. Classification is learning rules that can be applied to new data.Regression is finding functions with minimal error to model data. And association is looking for relationshipsbetween variables.Although, the two terms KDD and Data Mining are heavily used interchangeably, they refer to two related yetslightly different concepts. KDD is the overall process of extracting knowledge from data while Data Mining isa step inside the KDD process, which deals with identifying patterns in data. In other words, Data Mining isonly the application of a specific algorithm based on the overall goal of the KDD process.Q.6 What are the advantages and disadvantages of association rules?Association is one of the best-known data mining technique. In association, a pattern is discovered based on arelationship between items in the same transaction. That’s is the reason why association technique is alsoknown as relation technique. The association technique is used in market basket analysis to identify a set ofproducts that customers frequently purchase together.Retailers are using association technique to research customer’s buying habits. Based on historical sale data,retailers might find out that customers always buy crisps when they buy beers, and, therefore, they can put beersand crisps next to each other to save time for the customer and increase sales.Q.7 What are the types of Regression? Explain.Numeric prediction is the task of predicting continuous (or ordered) values for given inputFor example: We may wish to predict the salary of college graduates with 10 years of work experience, or thepotential sales of a new product given its price. The mostly used approach for numeric prediction is regressionA statistical methodology that was developed by Sir Frances Galton (1822-1911), a mathematician who wasalso a cousin of Charles Darwin. In many texts use the terms “regression” and “numeric prediction”synonymously Regression analysis can be used to model the relationship between one or more independent orpredictor variables and a dependent or response variable (which is continuous value). In the context of datamining, the predictor variables are the attributes of interest describing the tuple. The response variable is whatwe want to predict.Types of RegressionThe types of Regression are as: Linear Regression Nonlinear RegressionLinear RegressionStraight-line regression analysis involves a response variable, y, and a single predictor variable, x.It is the simplest form of regression, and models y as a linear function of x.
That is,y b wxWhere the variance of y is assumed to be constant, and b and w are regression coefficients specifying the Yintercept and slope of the line, respectively.The regression coefficient, w and b, can also be thought of as weight, so that we can equivalent write,y w0 w1x.The regression coefficient can be estimated using this method with the following equations:[Refer to write board:]Example Too:Multiple Linear RegressionThe multiple linear regression is an extension of straight-line regression so as to involve more than onepredictor variable. An example of a multiple linear regression model based on two predictor attributes orvariables, A1 and A2, isy w0 w1x1 w2x2,Where x1 and x2 are the values of attributes A1 and A2, respectively, in X. Multiple regression problems areinstead commonly solved with the use of statistical software packages, such as SPSS(Statistical Package forthe Social Sciences), etc.Nonlinear RegressionThe straight-line linear regression case where dependent response variable, y, is modeled as a linear function ofa single independent predictor variable, x. If we can get more accurate model using a nonlinear model, such as aparabola or some other higher-order polynomial? Polynomial regression is often of interest when there is justone predictor variable. Consider a cubic polynomial relationship given byy w0 w1x w2xsq2 w3xcu3Nonlinear RegressionIn statistics, nonlinear regression is a form of regression analysis in which observational data are modeled by afunction which is a nonlinear combination of the model parameters and depends on one or more independentvariables. The data are fitted by a method of successive approximations.Q.8 Explain the application of mining used in www.Most previous studies of data mining have focused on structured data, such as relational, transactional, and datawarehouse data. However, in reality, a substantial portion of the available information is stored in text database( or document databases) as news articles, research papers, books, digital libraries, e-mail message, and Webpages.Text databases are rapidly growing due to the increasing amount of information available in electronic form,such as electronic publications, various kinds of electronic documents, e-mail, and WWW.Data stored in the most text databases are semi-structured data in that they are neither completelyunstructured nor completely structured. Text mining can be used to make the large quantities of unstructureddata accessible and useful, thereby generating not only value, but delivering ROI from unstructured datamanagement as we’ve seen with applications of text mining for Risk Management Software and Cybercrimeapplications.
There is a basic difference that separates data mining and data warehousing that is data mining is a process of extracting meaningful data from the large database or data warehouse. However, data warehouse provides an environment where the data is stored in an integrated form which eases data mining to extract data more efficiently.