Transcription
2014Pocket Guide toLarge Truck and Bus StatisticsOffice of Analysis, Research, and Technology
For additional copies of this guide or information about theFederal Motor Carrier Safety Administration’s Office of Analysis,Research, and Technology, please contact:E-mail:FMCSA Host@dot.govMail:Federal Motor Carrier Safety AdministrationOffice of Analysis, Research, and Technology1200 New Jersey Avenue, SE6th FloorWashington, DC 20590Information Service:Phone: 1-800-832-5660May 2014
2014Pocket Guide toLarge Truck and Bus StatisticsMay 2014Office of Analysis, Research, and Technology
Letter from the AdministratorThe Federal Motor Carrier Safety Administration’s (FMCSA)2014 Pocket Guide to Large Truck and Bus Statisticshighlights our role in collecting and analyzing crash dataand statistics to support our mission to prevent commercialmotor vehicle-related fatalities and injuries. It can serve asa valuable, compact resource for industry representatives,Federal agencies, and other individuals interested in motorcarrier safety regulations and performance data.The primary mission of FMCSA is to reduce crashes,injuries, and fatalities involving large trucks and buses.In carrying out its safety mandate, FMCSA develops andenforces data-driven regulations that balance motor carriersafety with efficiency. The successes we have realized inreducing crashes, injuries, and fatalities are great, but thereis more to be done. Every life is precious, and even onefatality is one too many.Anne S. Ferro, FMCSA Administrator4Pocket Guide to Large Truck and Bus Statistics
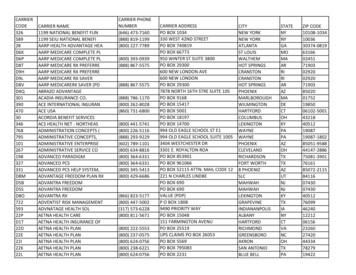
Location of Large Truck and BusFatal Crashes, 2012Note: In 2012, there were 3,702 fatal crashes involving large trucks and buses.Data Source: National Highway Traffic Safety Administration (NHTSA), Fatality AnalysisReporting System (FARS), 2012.Pocket Guide to Large Truck and Bus Statistics5
ContentsThe Motor Carrier Management Information System. 6Section 1. Overview: Large Trucks and Buses. 7Section 2. Roadside Inspections and Violations.15Section 3. Reviews.21Section 4. Crashes.24Section 5. Data Quality.40Section 6. Agency Resources.44Glossary and List of Acronyms.45The Motor Carrier ManagementInformation SystemFMCSA created and currently maintains the Motor CarrierManagement Information System (MCMIS). MCMIScontains information on the safety fitness of commercialmotor carriers (large trucks and buses) and hazardousmaterials (HM) carriers subject to the Federal Motor CarrierSafety Regulations (FMCSRs) and Hazardous MaterialsRegulations (HMRs). This system contains crash, census,and inspection files created to monitor and develop safetystandards for commercial motor vehicles (CMVs) operatingin interstate commerce. The crash file includes informationon all trucks and buses involved in reportable crashes.The census file includes all descriptive information onevery motor carrier in MCMIS and is updated weekly.The inspection file contains data from State and Federalinspection actions involving motor carriers operating in theUnited States. Most of the data included in MCMIS arecollected at the roadside by State personnel under the MotorCarrier Safety Assistance Program (MCSAP).6Pocket Guide to Large Truck and Bus Statistics
1. Overview: Large Trucks and BusesIn 2012, among the 253,639,386 total registered vehiclesin the United States, 8,190,286 were single-unit trucks(straight trucks), 2,469,094 were combination trucks (tractortrailers), and 764,509 were buses. FMCSA regulates allregistered commercial motor vehicles (CMVs) that operateinterstate or that carry hazardous materials (HM).As of December 2013, there were 539,033 interstate motorcarriers and intrastate HM motor carriers with recent activityoperating in the United States: 251,817 were for-hire carriers 230,596 were private carriers 43,654 were both for-hire and private carriers 12,966 were neither for-hire nor private carriers (e.g.,government).FMCSA regulates all drivers involved in interstate commerceor intrastate transportation of HM, as well as all CommercialDriver’s License (CDL) drivers both interstate and intrastate.Approximately 5.6 million CMV drivers operate in the UnitedStates: 3.5 million operate interstate- 3 million hold CDLs 2.2 million operate intrastate- 900,000 hold CDLs.Notes: The number of carriers and/or drivers in operation at any given time is subjectto change, due to enforcement actions, business failures, licensing issues, and otherfactors. Interstate and some intrastate driver counts are based on motor carrierregistration data contained in the Motor Carrier Management Information System(MCMIS); intrastate driver counts for States that do not require intrastate carriers toregister with FMCSA are estimated via extrapolation of State data.Data Sources: Registration Data - Federal Highway Administration (FHWA), HighwayStatistics 2012; Carrier Counts - FMCSA, MCMIS, data snapshot as of December 27,2013; CMV Driver Counts - FMCSA, MCMIS, data snapshot as of January 24, 2014.Pocket Guide to Large Truck and Bus Statistics7
1-1Registered Vehicles in the United States, 2009-2012YearAll VehiclesLarge 666,0642012253,639,38610,659,380764,509Data Source: Federal Highway Administration (FHWA), Highway Statistics 2012,Table VM-1.1-2Million Vehicle Miles Traveled (VMT) in the UnitedStates, 2009-2012YearAll VehiclesLarge 15268,31814,755Data Source: Federal Highway Administration (FHWA), Highway Statistics 2012,Table VM-1.1-3Motorcoach Passenger Trips in the United States andCanada by Fleet Size, 2012Passenger Trips:Average Passenger Trips per:MotorcoachFleet SizeTotalPercentMotorcoachCarrier100 or %22,5001,493,90025 to 4984,773,00013.3%14,000543,40010 to 24103,982,00016.3%13,500221,7001 to 9154,261,00024.2%11,60047,300Industry Total637,442,000100.0%16,100161,20050 to 99Note: Percentages may not sum to 100 percent because of rounding.Data Source: Motorcoach Census 2013: A Study of the Size and Activity of theMotorcoach Industry in the United States and Canada in 2012; prepared for theAmerican Bus Association (ABA) Foundation by John Dunham and Associates,February 27, 2014.8Pocket Guide to Large Truck and Bus Statistics
1-4Commercial Motor Vehicle (CMV) Drivers Operating inthe United States, 2013Intrastate NonCDL icense(CDL)Drivers3,000,00053%Intrastate CDLDrivers900,00015%Interstate NonCDL Drivers500,0009%Notes: The number of carriers and/or drivers in operation at any given time is subjectto change, due to enforcement actions, business failures, licensing issues, andother factors. Interstate and some intrastate driver counts are based on motor carrierregistration data contained in the Motor Carrier Management Information System(MCMIS); intrastate driver counts for States that do not require intrastate carriers toregister with FMCSA are estimated via extrapolation of State data.Data Source: FMCSA, MCMIS, data snapshot as of January 24, 2014.1-5Active Motor Carriers by Type, 2009-2013Year2009Interstate Freight2010201120122013493,505 501,338 500,905 507,690 511,211Interstate Passenger11,31311,80411,81912,18412,384Intrastate Hazardous 1 527,370 527,846 535,423 539,033Notes: Company counts are estimates based on motor carriers in the Motor CarrierManagement Information System (MCMIS) with recent activity, defined as thosecarriers that have had an inspection, a crash, a compliance review, a safety audit,an FMCSA Motor Carrier Identification Report (Form MCS-150) update, a vehicleregistration activity, or a Unified Carrier Registration (UCR) system payment activity inthe past 3 years, or have current operating authority indicated in the FMCSA Licensingand Insurance (L&I) database.Data Source: FMCSA, MCMIS, data snapshots as of December 18, 2009, December17, 2010, December 16, 2011, December 14, 2012, and December 27, 2013.Pocket Guide to Large Truck and Bus Statistics9
1-6Carriers by Headquarters (Domicile) Location, 2013Notes: Domicile refers to the headquarters location for a carrier. This map displaysonly interstate carriers and intrastate hazardous materials (HM) carriers. Intrastatenon-HM carriers are not displayed. The number of carriers depicted in this map maynot be the same as reported elsewhere by FMCSA. Due to potential differences inreporting dates and quality issues with carrier addresses, this map may not includeall current carriers. Additionally, the number of carriers that operate at any given timeis subject to change due to enforcement actions, business failures, and other factors.Data Source: FMCSA, Motor Carrier Management Information System (MCMIS),as of March 2013.10Pocket Guide to Large Truck and Bus Statistics
1-7FMCSA-Regulated Carriers, 2009-2013Motor CarrierCensus DataActive Carriers witha USDOT NumberPower 423539,0333,971,773 4,116,259 4,176,144 4,279,988 4,604,338Commercial Drivers 2,994,043 3,031,032 3,062,967 3,100,006 3,174,105Total DriversMexico CommercialZone Carriers4,100,819 4,216,408 4,266,852 4,357,244 4,409,2425,6497,3607,0707,9308,296Power Units25,87529,78329,40331,79033,009Commercial Drivers20,47523,36723,07125,03225,984Total Drivers24,00427,69827,29129,57730,618Note: Only interstate carriers and intrastate hazardous materials (HM) carriers withrecent activity are included in this table.Data Source: FMCSA, Motor Carrier Management Information System (MCMIS),data snapshots as of December 18, 2009, December 17, 2010, December 16,2011, December 14, 2012, and December 27, 2013.1-8FMCSA-Regulated Carriers by Domicile, 2013Motor CarrierCensus DataActive Carriers withUSDOT 34,604,338Commercial Drivers 3,060,08926,62687,2391513,174,105Total Drivers31,743106,8251,0594,409,242Power Units4,269,615Note: Only interstate carriers and intrastate hazardous materials (HM) carrierswith recent activity are included in this table.Data Source: FMCSA, Motor Carrier Management Information System (MCMIS),data snapshot as of December 27, 2013.Pocket Guide to Large Truck and Bus Statistics11
1-9Average Daily Truck Traffic on the National HighwaySystem, 2007Note: In this map, both private and for-hire trucks are included; trucks that are part ofmultiple modes and mail, or trucks that move in conjunction with domestic air cargoare not included.Data Source: Federal Highway Administration (FHWA), Freight Analysis Framework(FAF), June 2012 update (FAF Version 3.4), accessed January 2014.12Pocket Guide to Large Truck and Bus Statistics
1-10 Freight Shipments within the United States by Modeand Weight (in Millions of Tons)ModeTruckRailWaterAir*PipelineMultiple ,05364561,91258349917,622*Includes air and truck-air.**Includes other, unknown, and no domestic mode.Note: Includes domestic trade and the domestic portion of imports and exports.Data Source: Federal Highway Administration (FHWA), Freight AnalysisFramework (FAF), Version 3.4, available at http://faf.ornl.gov as of October 2013.1-11 Percent of Total Domestic Freight Moved by Mode, 2011Multiple .7%Rail:11.7%Truck:67.7%Note: Includes domestic trade and the domestic portion of imports and exports.Data Source: Federal Highway Administration (FHWA), Freight AnalysisFramework (FAF), Version 3.4, available at http://faf.ornl.gov as of October 2013.Pocket Guide to Large Truck and Bus Statistics13
1-12 Household Goods Carriers and Brokers Operating inthe United States, 2009-2013YearActive HouseholdGoods CarriersHousehold GoodsBrokers RegisteredProperty 213,710Note: A broker is an individual, partnership, or corporation that receives paymentfor arranging the transportation of property or household goods belonging to othersby using an authorized motor carrier.Data Source: FMCSA, Licensing & Insurance (L&I), data snapshots as ofDecember 18, 2009, December 17, 2010, December 16, 2011, December 14,2012, and December 27, 2013.1-13 New Entrant Safety Audits, 2009-2013YearSafety AuditsSafety Audit Pass 0%201234,24675.40%201332,36180.14%Note: A new entrant is a motor carrier that applies for a U.S. Department ofTransportation (USDOT) number in order to initiate operations in interstatecommerce or the intrastate transportation of hazardous materials (HM). Carriersremain in the new entrant program until passing the safety audit and have been inbusiness for 18 months.Data Source: FMCSA, Motor Carrier Management Information System (MCMIS),data snapshots as of December 18, 2009, December 17, 2010, December 16,2011, December 14, 2012, and December 27, 2013.14Pocket Guide to Large Truck and Bus Statistics
2. Roadside Inspections and ViolationsWhat is a Roadside Inspection?A roadside inspection is an examination of an individualcommercial motor vehicle (CMV) and/or driver by anauthorized safety inspector. Approximately 95 percent ofall inspections are conducted by State inspectors, with theremainder conducted by Federal inspectors. The inspectiondetermines whether the driver and/or the CMV is incompliance with the Federal Motor Carrier Safety Regulations(FMCSRs) or the Hazardous Materials Regulations (HMRs),as appropriate. Serious violations result in the issuance ofvehicle or driver out-of-service (OOS) orders. These violationsmust be corrected before the affected driver or vehicle canreturn to service.2-1Roadside Inspection OOS Rates, 2009-2013Type ofRoadside Inspection20092010201120122013Driver Inspections*3,456,814 3,500,238 3,473,037 3,426,482 3,387,479With OOS Violation191,860 182,946 172,659 167,643 165,068Driver OOS Rate5.55%5.23%4.97%4.89%4.87%Vehicle Inspections** 2,364,001 2,433,846 2,420,935 2,429,783 2,394,977With OOS Violation502,677 481,801 492,706 489,044 477,057Vehicle OOS Rate21.26% 19.80% 20.35% 20.13% 19.92%Hazmat Inspections***222,985 211,219 205,920 203,675 202,989With OOS Violation10,2079,0397,8417,6407,917Hazmat OOS Rate4.58%4.28%3.81%3.75%3.90%*Driver Inspections were computed based on inspection levels I, II, III, and VI.**Vehicle Inspections were computed based on inspection levels I, II, V, and VI.***Hazmat Inspections were computed based on inspection levels I, II, III, IV, V,and VI when hazardous materials were present.Note: Roadside inspection OOS rates depicted in this table include both largetrucks and buses. For more information on roadside inspections and inspectionlevels, please refer to https://csa.fmcsa.dot.gov.Data Source: FMCSA, Motor Carrier Management Information System (MCMIS),data snapshot as of January 24, 2014.Pocket Guide to Large Truck and Bus Statistics15
2-2Roadside Inspections by Inspection Level, 2009-2013Inspection LevelI. FullWith OOS Violation(s)*II. Walk-AroundWith OOS Violation(s)*III. Driver OnlyWith OOS Violation(s)*IV. Special StudyWith OOS Violation(s)*V. TerminalWith OOS Violation(s)*VI. Radioactive MaterialsWith OOS ,674113,497,937*Out-of-service (OOS) violation numbers are based on roadside inspections. Forexample, in 2012, there were 1.1 million Level I inspections. Out of all the Level Iinspections completed, 284,242 resulted in at least one OOS violation.Note: For more information on roadside inspections and inspection levels, please referto https://csa.fmcsa.dot.gov.Data Source: FMCSA, Motor Carrier Management Information System (MCMIS), datasnapshot as of January 24, 2014.2-3Roadside Inspections by Inspection Level, 2013Special Study9,9260.3%Terminal100,5322.9%Radioactive Materials1,6740.05%Driver 02,91834.4%Note: For more information on roadside inspections and inspection levels, please referto https://csa.fmcsa.dot.gov.Data Source: FMCSA, Motor Carrier Management Information System (MCMIS), datasnapshot as of January 24, 2014.16Pocket Guide to Large Truck and Bus Statistics
2-4Roadside Inspections by Carrier Fleet Size, 2009-2013Carrier Fleet Size20092010201120122013Very Small(1-6 Power Units)953,618 1,016,442 1,022,176 1,019,098 1,015,492Small(7-20 Power -100 Power Units)695,191715,865723,876726,249722,373Large( 100 Power 8,657388,775370,774328,286298,320Total3,553,337 3,603,291 3,591,789 3,541,408 3,497,937Note: Carriers listed as having zero power units are included in the “Unknown” category.Data Source: FMCSA, Motor Carrier Management Information System (MCMIS), datasnapshot as of January 24, 2014.2-5Roadside Inspections by Carrier Operation, 2009-2013Carrier 20132,964,068 3,018,946 2,966,096 2,918,833 337 3,603,291 3,591,789 3,541,408 3,497,937Data Source: FMCSA, Motor Carrier Management Information System (MCMIS), datasnapshot as of January 24, 2014.2-6Roadside Inspections by Gross Combination WeightRating (GCWR), 2009-2013GCWR 10,000 pounds10,000 - 26,000 17,018322,701399,489418,517418,241423,108 26,000 pounds1,629,869 2,242,437 2,441,367 2,509,338 2,520,301Unknown1,589,744Total3,553,337 3,603,291 3,591,789 3,541,408 3,497,937948,369713,553596,591537,510Note: GCWR are based on Roadside Inspection Reports as reported in MCMIS.Data Source: FMCSA, Motor Carrier Management Information System (MCMIS), datasnapshot as of January 24, 2014.Pocket Guide to Large Truck and Bus Statistics17
2-7Most Frequent Driver Violations in RoadsideInspections, 2013Number ofViolationsNumberof OOSViolationsLog Violation (General/Form and Manner)156,920137Driver’s Record of Duty Status Not olation Description395.8No Log/Log Not Current395.8F1No Log/Log Not Current391.11B2All Other Driver Violations Non-English Speaking Driver392.2SLLS2 Traffic EnforcementState/Local Laws - Speeding 6-10 MilesPer Hour Over the Speed Limit64,6355392.16Seat BeltFailing to Use Seat Belt While OperatingCMV55,6246391.41AFMedical CertificateOperating a Property-Carrying Vehiclewithout Possessing a Valid MedicalCertificate52,287945395.3A2PROP11/14 HoursDriving beyond 14 Hour Duty Period(Property-Carrying Vehicle)51,91122,437392.2CTraffic EnforcementFailure to Obey Traffic Control Device41,88526391.41AMedical CertificateDriver Not in Possession of MedicalCertificate41,0762,497395.8ENo Log/Log Not CurrentFalse Report of Driver’s Record of DutyStatus35,70726,860395.8ANo Log/Log Not CurrentNo Driver’s Record of Duty Status28,83525,446395.3A3PROP11/14 HoursDriving beyond 11 Hour Driving Limit in a14 Hour Period (Property-Carrying Vehicle)28,20712,526395.8K2No Log/Log Not CurrentDriver Failing to Retain Previous 7 Days’Logs26,67522,541392.2SLLS1 Traffic EnforcementState/Local Laws - Speeding 1-5 Miles PerHour Over the Speed Limit26,3912392.2SLLS3 Traffic EnforcementState/Local Laws - Speeding 11-14 MilesPer Hour Over the Speed Limit24,3361391.45BMedical CertificateExpired Medical Examiner’s Certificate23,056771392.82A1All Other Driver Violations Using a Hand-Held Mobile TelephoneWhile Operating a CMV15,965415,0384392.2SLLS4 Traffic EnforcementState/Local Laws - Speeding 15 or MoreMiles Per Hour Over The Speed Limit383.23A2All Other Driver Violations Operating a CMV without a CDL14,82913,957392.2LVTraffic Enforcement13,5802Lane Restriction ViolationNotes: Total number of driver inspections in calendar year (CY) 2013: 3,387,479.Total number of driver violations in CY 2013: 1,047,496. Total number of driver outof-service (OOS) violations in CY 2013: 192,072. Only the top 20 driver violations(based on frequency of occurrence) are listed in this table.Data Source: FMCSA, Motor Carrier Management Information System (MCMIS),data snapshot as of January 24, 2014.18Pocket Guide to Large Truck and Bus Statistics
2-8Most Frequent Vehicle Violations in RoadsideInspections, 2013ViolationCodeCategoryViolation DescriptionNumberNumber ofof OOSViolations Violations393.9LightingOperating Vehicle Not Having theRequired Operable Lamps503,61444,356393.75CTiresTire—Other: Tread Depth Less than2/32 of Inch209,60017,302393.11LightingNo/Defective Lighting .47EBrakes, All OthersClamp/Roto-Chamber Type Brake(s) Outof Adjustment204,911277396.3A1All Other Vehicle Defects Inspection/Repair and Maintenance Partsand Accessories177,49824,847396.5BAll Other Vehicle Defects Oil and/or Grease Leak173,1612,119393.95AEmergency EquipmentNo/Discharged/Unsecured FireExtinguisher151,15024393.45B2 Brakes, All OthersFailing to Secure Brake Hose/TubingAgainst Mechanical Damage149,93014,919396.17CPeriodic InspectionOperating a CMV Without PeriodicInspection146,890122393.53BBrakes, All OthersAutomatic Brake Adjuster - CMVManufactured on or After 10/20/1994—Air Brake100,0836393.9TSLightingInoperative Turn Signal99,94743,018393.78WindshieldWindshield Wipers Inoperative/Defective87,047352396.3A1B Brakes, All OthersBrakes (General)71,29513,401393.25FLightingStop Lamp Violations70,81423,445393.48ABrakes, All OthersInoperative/Defective Brakes68,71418,303393.95FEmergency EquipmentNo/Insufficient Warning Devices65,52349393.60CWindshieldDamaged or Discolored Windshield61,41592393.9HLightingInoperative Head Lamps57,161711393.75A2 TiresTire—Tread and/or Sidewall Separation57,0635,778393.45DBrake Connections with Leaks/Constrictions54,4093,907Brakes, All OthersNotes: Total number of vehicle inspections in calendar year (CY) 2013: 2,394,977.Total number of vehicle violations in CY 2013: 4,118,869. Total number of vehicleout-of-service (OOS) violations in CY 2013: 660,334. Only the top 20 vehicleviolations (based on frequency of occurrence) are listed in this table.Data Source: FMCSA, Motor Carrier Management Information System (MCMIS),data snapshot as of January 24, 2014.Pocket Guide to Large Truck and Bus Statistics19
2-9Traffic Enforcement Inspections, 2009-2013Activity SummaryNumber of Traffic EnforcementInspectionsWith Moving ViolationsWith Drug & AlcoholViolationsWith Railroad CrossingViolationsWith Non-specified State Law/Miscellaneous Violations20092010201120122013720,699 622,184 569,077 470,600 380,830255,584 231,639 211,791 193,662 68 415,248 376,222 290,724 189,612Notes: One inspection may result in more than one violation; therefore, totals maynot equal the sum of all components. The traffic enforcement program involves theenforcement of 24 moving and non-moving driver violations, which are includedin the driver violation portion of the roadside inspection procedures. Roadsideinspections that result in only drug- or alcohol-related violations are excluded astraffic enforcement type inspections. Due to the variation in descriptions of trafficenforcement violations among the States, it is often difficult to aggregate andreport them on a national level.Data Source: FMCSA, Motor Carrier Management Information System (MCMIS),data snapshot as of January 24, 2014.2-10 Traffic Enforcement Violations, 2009-2013Activity Summary20092010201120122013Number of Traffic900,328 757,731 683,605 554,628 428,520Enforcement ViolationsMoving Violations264,678 240,025 219,359 199,609 207,980Drug & Alcohol Violations1,8691,5411,4211,3691,112Railroad Crossing Violations376376409395286Non-specified State Law/Miscellaneous Violations633,405 515,789 462,416 353,255 219,142Notes: The traffic enforcement program involves the enforcement of 24 movingand non-moving driver violations, which are included in the driver violationportion of the roadside inspection procedures. Roadside inspections that resultin only drug- or alcohol-related violations are excluded as traffic enforcementtype inspections. Due to the variation in descriptions of traffic enforcementviolations among the States, it is often difficult to aggregate and report them ona national level.Data Source: FMCSA, Motor Carrier Management Information System (MCMIS),data snapshot as of January 24, 2014.20Pocket Guide to Large Truck and Bus Statistics
3. ReviewsThis chapter provides summarized data for the past 5years on all types of reviews conducted on motor carriersthat transport property or passengers in interstate orintrastate commerce. Reviews are conducted to investigatepotential safety violations, to investigate complaints, orin response to a carrier’s request for a change in safetyrating. It is intended that through education, heightenedsafety regulation awareness, and the enforcement effectsof reviews, motor carriers will improve the safety of theircommercial vehicle operations and, ultimately, reduce theirinvolvement in crashes.The reviews covered include, but are not limited to, MotorCarrier Safety Reviews, Cargo Tank Facility Reviews,Shipper Reviews, Compliance Reviews (CRs), andCompliance, Safety, Accountability (CSA) Reviews. CSAis an FMCSA safety program designed to improve largetruck and bus safety and prevent crashes, injuries, andfatalities related to commercial motor vehicles (CMVs).It has introduced an enforcement and compliance modelthat allows FMCSA and its State Partners to contact morecarriers earlier in order to address safety deficiencies beforecrashes occur. The CSA program provides a nationwidesystem for making the roads safer for motor carriers and thepublic alike.For more information on reviews, please refer px.Pocket Guide to Large Truck and Bus Statistics21
3-1Reviews by Type, 2009-2013Review TypeMotor Carrier Safety ComplianceReviews (CRs)2009201020112012201316,178 13,7845,513002,8166,7395,8278,228 10,7068,709Compliance, Safety, Accountability(CSA) Onsite Comprehensive544994CSA Onsite Focused / Focused CR6621,320CSA Offsite406698597541401Cargo Tank Facility Reviews109143948986Shipper -Rated Reviews (excludesSecurity Contact Review & CSA)Total Reviews20,258 19,748 19,033 20,107 17,922Data Source: FMCSA, Motor Carrier Management Information System (MCMIS),data snapshot as of January 24, 2014.3-2Passenger Carrier Reviews, 2009-2013Carriers by Vehicle Type20092010201120122013Any Passenger Vehicles*MotorcoachesSchool BusesVansMini 72,6361,938334645763271*The “Any Passenger Vehicles” row might not equal the sum of subcategories fora given row due to carriers applying for multiple passenger authority at the time ofthe application.Notes: Passenger carriers were those carriers who registered to transportpassengers and owned or leased at least one passenger vehicle (motorcoach,school bus, van, mini-bus, or limousine) at the time of the review.Data Source: FMCSA, Motor Carrier Management Information System (MCMIS),data snapshot as of January 24, 2014.22Pocket Guide to Large Truck and Bus Statistics
3-3Reviews by Reason for Review, 2009-2013Reason for Review20092010201120122013Compliance, Safety, Accountability(CSA) 100% ,4789217475514,374Carrier RequestComplaintCompliance ReviewConditional CarrierEnforcement Follow-UpFocused Compliance Review (CR)Priority ListSafety Audit ConversionUnsatisfactory 72622771748426295,7736,2872,8322,0542,22320,258 19,748 19,033 20,107 17,922*CSA 100% States include States that have implemented the complete suite ofCSA Investigations that were conducted due to deficiencies identified by the CSASafety Measurement System (SMS).Data Source: FMCSA, Motor Carrier Management Information System (MCMIS),data snapshot as of January 24, 2014.3-4Reviews by Carrier Fleet Size, 2009-2013Carrier Fleet Size20092010201120122013Very Small (1-6 Power Units)8,6038,2888,2578,6707,976Small (7-20 Power Units)5,7645,5945,5145,7355,050Medium (21-100 Power Units)4,1143,9743,6543,9113,382Large ( 100 Power ownTotal20,258 19,748 19,033 20,107 17,922Notes: Carriers listed as having zero power units are included in the “Unknown”category.Data Source: FMCSA, Motor Carrier Management Information System (MCMIS),data snapshot as of January 24, 2014.Pocket Guide to Large Truck and Bus Statistics23
4. CrashesIn 2012, there were 30,800 fatal crashes on the Nation’sroadways, 3,702 (12.0 percent) of which involved at leastone large truck or bus. In addition, there were an estimated5,584,000 nonfatal crashes, 367,000 (6.6 percent) of whichinvolved at least one large truck or bus.Data Sources:FARS: Maintained by the National Highway Traffic SafetyAdministration (NHTSA), the Fatality Analysis ReportingSystem
Federal Motor Carrier Safety Administration's Office of Analysis, Research, and Technology, please contact: E-mail: FMCSA_Host@dot.gov Mail: Federal Motor Carrier Safety Administration Office of Analysis, Research, and Technology 1200 New Jersey Avenue, SE 6th Floor Washington, DC 20590 Information Service: Phone: 1-800-832-5660 May 2014
![DEPARTMENT OF TRANSPORTATION [4910-EX-P] Federal Motor Carrier Safety .](/img/57/unified-carrier-registration-plan-fees.jpg)