Transcription
JUNE 2016SUSTAINABILITY2015SUSTAINABILITY REPORTMeasuring VTA’sEnvironmental Progressi
This document was prepared with the support and guidanceof VTA’s Sustainability Program Team:Kevin Balak, Real Estate & Joint DevelopmentHassan Basma, Engineering & Transportation Infrastructure DevelopmentAnn Calnan, Environmental Programs & Resources ManagementTracy Casimiro, Environmental Health & SafetyMarc DeLong, Engineering & Transportation Infrastructure DevelopmentCasey Emoto, Project DevelopmentInez Evans, Operations AdministrationTom Fitzwater, VTA’s BART Silicon Valley ProgramLyndsey Fujii, Environmental Health & SafetyRobert Furber, Environmental Programs & Resources ManagementRon Golem, Real Estate & Joint DevelopmentLani Ho, Environmental Programs & Resources ManagementKarly Hutchinson, Environmental Health & SafetyChristina Jaworski, Environmental Programs & Resources ManagementKevin Kelley, PurchasingKathleen Podrasky, Community EngagementBaljit Pannu, Human ResourcesJohn Ristow, Planning & Project DevelopmentKris Sabherwal, Rail EngineeringHeidi Samuels, Operations MaintenanceRajwinder Sehdev, Engineering & Transportation Infrastructure DevelopmentJesse Soto, Facilities MaintenanceRobert Victor, TechnologyKendall Whitson, Facilities MaintenanceFor more information, contact:Environmental Programs and Resources Management3331 N. First Street, B-2San Jose, CA 95134(408) 321-5789vta.org/sustainability
TABLE OF CONTENTSExecutive Summary . . . . . . . . . . . . . . . . . . . .1Background . . . . . . . . . . . . . . . . . . . . . . . . 2About VTA . . . . . . . . . . . . . . . . . . . . . . . . . . . . . . .2VTA’s Sustainability Program . . . . . . . . . . . . . . . . . . . . . . . . 2Report Purpose and Scope . . . . . . . . . . . . . . . . .3Purpose . . . . . . . . . . . . . . . . . . . . . . . . . . . . . . . .3Scope . . . . . . . . . . . . . . . . . . . . . . . . . . . . . . . . .3Environmental Performance . . . . . . . . . . . . . . . . . 5Fuel . . . . . . . . . . . . . . . . . . . . . . . . . . . . . . . . . .5Electricity, Renewable Energy, and Natural Gas . . . . . . . . . . . . . . . . 5Water . . . . . . . . . . . . . . . . . . . . . . . . . . . . . . . . .7Waste and Recycling . . . . . . . . . . . . . . . . . . . . . . . . . . . 7Accomplishments . . . . . . . . . . . . . . . . . . . . .9Accomplishment Area 1: Responding to Drought Emergency . . . . . . . . . 9Accomplishment Area 2: Reducing Vehicle Emissions . . . . . . . . . . . . 10Accomplishment Area 3: Retrofitting Existing Facilities . . . . . . . . . . . 10Accomplishment Area 4: Promoting Technology over Paper . . . . . . . . . 11Accomplishment Area 5: Incorporating Sustainability Principles in Project Design .12Accomplishment Area 6: Reducing Waste . . . . . . . . . . . . . . . . . 12Accomplishment Area 7: Improving Environmental Awareness . . . . . . . . 12Accomplishment Area 8: Environmental Management System . . . . . . . .13Past Accomplishments . . . . . . . . . . . . . . . . . . . . . . . . . 14Future Projects . . . . . . . . . . . . . . . . . . . . . . 15
EXECUTIVE SUMMARYSince 2009, VTA has produced an annual sustainability report to summarize its continualefforts to achieve higher environmental performance and meet or exceed sustainability goals.This report is a continuation of this effort andreflects VTA’s sustainability achievements for the2015 calendar year.measures and recycling improvements. Duringthis same reporting period, VTA increased fueluse by 6%, grid electricity usage by 5%, andnatural gas usage by 17%. These increases areprimarily attributed to the continuing restorationof bus and light rail service since it was reducedin 2010, and special events.VTA’s Sustainability Program achieved manyaccomplishments in 2015. These accomplishments are grouped into eight key areas as shownbelow. Overall, the accomplishments in 2015 areestimated to save VTA 356,092 per year.Funding for the Sustainability Program isdependent on the two-year budget process.Future funding would enable VTA to continuecurrent efforts in the areas listed above, achieveISO certification for VTA’s EnvironmentalManagement System, quantify GHG emissionsto enable preparation of a Climate Action Plan,and provide electricity data for Low Carbon FuelStandard credits.In comparison to the previous reporting year(2014), VTA decreased potable water use by39% and solid waste by 13%. These savings wereachieved by implementing drought responseACCOMPLISHMENT AREASUMMARYResponding to drought emergencyReduced potable water use by 21% compared to 2013Reducing vehicle emissions20% of revenue fleet is hybrid diesel-electric, installed 5 electricvehicle charging stations, installed electric bike stationRetrofitting existing facilitiesReplaced over 600 light fixtures, saving 24,775 per yearPromoting technology over paperReduced imaging devices by 65%, saving 190,437 per yearIncorporating sustainability principles in project designLED lighting, solar, drought tolerant landscaping, using recycledmaterialsReducing solid wasteInstalled solar trash and recycling containers, Reuse Center,community partnership to recycle textilesImproving environmental awarenessNew stormwater management trainings, continued outreachand annual eventsEnvironmental Management SystemEliminated 277,000 polystyrene cups, saved 140,880, reducedwaste by 66%Total estimated savings: 356,092 per year1
BACKGROUNDAbout VTAThe Santa Clara Valley Transportation Authority(VTA) is an independent special district thatprovides bus, light rail, and paratransit services,as well as participates as a funding partner inregional rail service. VTA serves the municipalities of Campbell, Cupertino, Gilroy, Los Altos, LosAltos Hills, Los Gatos, Milpitas, Monte Sereno,Morgan Hill, Mountain View, Palo Alto, San Jose,Santa Clara, Saratoga and Sunnyvale. As SantaClara County’s congestion management agency,VTA is responsible for countywide transportation planning, including congestion management,design and construction of specific highway,pedestrian, and bicycle improvement projects, as well as promotion of transit-orienteddevelopment.VTA FACTSTotal Ridership FY’14 . . . . . . . . . . . . . . . . . . . . . . . . . . . 43,428,492Service Area . . . . . . . . . . . . . . . . . . . . . . . . . . . . . 346 square milesTotal County Population . . . . . . . . . . . . . . . . . . . . . . . . . 1.8 millionBus Ridership (avg weekday FY’14) . . . . . . . . . . . . . . . . . . . 105,969Light Rail Ridership (avg weekday FY’14) . . . . . . . . . . . . . . . 35,012# of Buses . . . . . . . . . . . . . . . . . . . . . . . . . . . . . . . . . . . . . . . . .505# of Light Rail Cars . . . . . . . . . . . . . . . . . . . . . . . . . . . . . . . . . . . 99Bus Routes . . . . . . . . . . . . . . . . . . . . . . . . . . . . . . . . . . . . . . . . . 70Bus Stops . . . . . . . . . . . . . . . . . . . . . . . . . . . . . . . . . . . . . . . .3,832Light Rail Lines . . . . . . . . . . . . . . . . . . . . . . . . . . . . . . . . . . . . . . 3Light Rail Stations . . . . . . . . . . . . . . . . . . . . . . . . . . . . . . . . . . . .62Miles of Bus Routes (round trip) . . . . . . . . . . . . . . . . . . . . . . . 1,236Miles of Light Rail Track . . . . . . . . . . . . . . . . . . . . . . . . . . . . . . 42.2Total Operating Budget . . . . . . . . . . . . . . . . . . . . . . . . 380 millionTotal Capital Program Budget . . . . . . . . . . . . . . . . . . . . 4.5 billion# of Employees . . . . . . . . . . . . . . . . . 2,100 (70% are in Operations)On Time Performance . . . . . . . . . . . . . . 86% (Bus), 85% (Light Rail)VTA’sSustainability ProgramIn 2008, the Sustainability Program wasapproved by VTA’s Board of Directors with thefollowing goal and operating strategies:Goal: to strengthen VTA’s commitment to theenvironment by reducing the consumption ofnatural resources, the creation of greenhousegases, and the generation of pollution in the provision of public transportation services.Strategies: educational programs and outreach,transit-oriented development, increasing sustainability at existing facilities, incorporating greenbuilding practices in new facilities, developingenvironmentally preferable procurement strategies, and establishing a means of measuring theprogress of the Sustainability Program.VTA became a signatory to the AmericanPublic Transportation Association’s (APTA)Sustainability Commitment in 2009 and achievedGold Level Recognition in 2016. Through thisundertaking, VTA commits to core principles ofeconomic, social, and environmental sustainability and towards a path of continual improvement.2
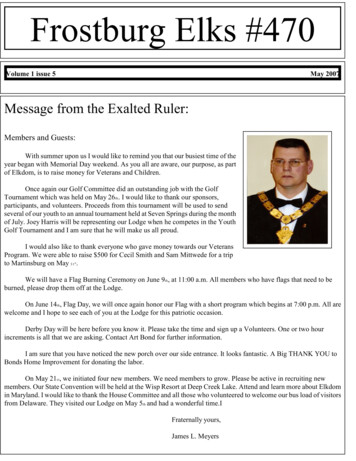
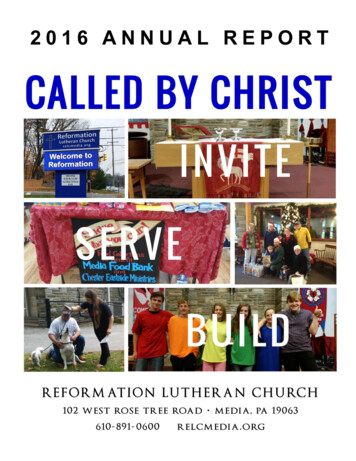
REPORT PURPOSE AND SCOPEPurposeThe purpose of this report is to measure currentand future Sustainability Program initiatives.Annual reporting was adopted as part of VTA’sSustainability Program in February 2008. Theapplicable strategy states: “Establish benchmarks to measure the progress and performanceof VTA’s Sustainability Program and report backto the VTA Board of Directors on an annual basis.Among other actions, this report will involvereassessing VTA’s fuel, electrical, and waterusage on a regular basis.”ScopeThis report measures VTA’s environmental performance in providing bus, light rail, and paratransit services. Therefore, the scope of thisreport extends to transit centers, stations, tractionpower facilities, and operating divisions. VTA hasfive main operating divisions. These divisions aregrouped as follows: Cerone, Chaboya, and North Divisions arededicated to the maintenance, cleaning, andfueling of VTA’s bus fleet. Guadalupe Division is responsible for all lightrail operations and maintenance functions,including major vehicle overhaul, historic trolley maintenance, and light rail operator andmaintenance training. River Oaks Division includes the Officesof the General Manager, Board, GeneralCounsel, Public Affairs, Planning andProgram Development, Engineering andTransportation Infrastructure Development,Finance and Budget, Operations, BusinessServices, and System Safety and Security.VTA also participates as a funding partner inregional rail service including Caltrain, CapitalCorridor, and the Altamont Corridor Express.These services are not included in the scope ofthis report.VTA’s Sustainability Program Team3
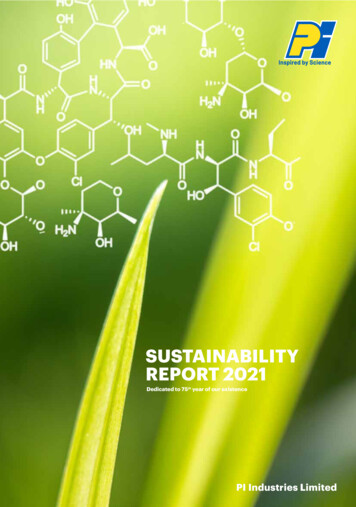
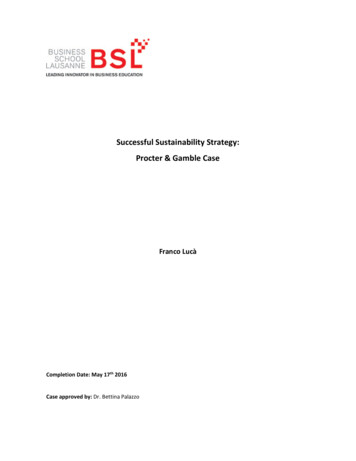
ENVIRONMENTAL PERFORMANCEAnalyzing VTA’s environmental performancerequires large amounts of data from a variety ofsources. Since 2014, VTA has used a utility management system to keep track of this data andmonitor costs. The system helps identify potential issues and opportunities for improvement.Implementation of this system has been instrumental in preparing the 2015 report.enue fleet breakdown by fuel type is 97% diesel,3% biodiesel, and less than 1% gasoline.In 2015, the non-revenue fleet consumed 82,414gallons of fuel and the paratransit fleet used360,130 gallons of gasoline. Fuel use by the nonrevenue fleet was approximately 6% higher thanthe previous year and 24% higher than the baseline year. Fuel used by paratransit service wasapproximately 9% higher than the previous yearand 10% lower than the baseline year.This report measures VTA’s environmental performance in providing bus, light rail, and paratransit services by comparing usage and costsfrom the previous reporting year (2014) to thecurrent reporting year (2015). Fuel, electricity,natural gas, water, and solid waste are evaluated.Where historical data is available, the report alsoVTA’s electricity and natural gas is supplied bycomparesto the baseline year which is ChaboyaNorthRiver OaksGuadalupeNon-Revenue usageRevenuePacific Gas and Electric (PG&E), City of Palo Alto,Recycling200,0002008, unless noted ara).180,000160,000Electricity use includes electricity supplied2,500 by140,000solar installations at Cerone, Chaboya, and .SolarIn 2015, VTA consumed 4.2 million gallons100,000 of ecosting approximately 9,185,000 for 80,000the revenueagreement, and excess electricity generatedis1,00060,000fleet. This is approximately the same asthe previfed into PG&E’s power grid in exchange for credit.40,000year.ous year and 8% higher than the baseline500This credit is used to offset the cost of electricityThe baseline year (2011) was selected 20,000based on0 is less0purchased during times when solar energydata 2014available at the2015200820142015time of this report. The rev- 2008available due to weather.Electricity, RenewableEnergy, and Natural GasParatransitWasteFigure 2: Total VTA Electricity UsageFigure 1: VTA Fuel Usage from 0,0004,400,0004,200,000kWhGallons of Solar Chaboya Traction larTons2011TonsThermsFuel2011Cerone2014River Oaks20155,000,00020,000002008200820142014201520155
0140,0004,200,000In 2015, total VTA electricity use was 39.8 million4,000,000kilowatt hours (kWh), enough to power 3,6403,800,000homes for one year. This is approximately 5%3,600,000higher than the previous year, but 3% lower than3,400,00020112015 in usagethe 2008 baselineyear.2014The increase2,000120,000TonsThermsGallons of Fuel4,800,000100,0001,500over last year is due to additional traction powerusage as a result of more frequent service and1,00060,00040,000special events at Levi’s Stadium. In 2015, VTA50020,000spent 6.4 million on electricity, which is approx0020152014 the previousimately 200810% higher thanyear.80,000Grid electricity use in 2015 was 36.5 million kWh, 5% higher than the previousyear, but 11% lower than 2008.Figure 3: 2015 Electricity Use at Operating River OaksFigure 4 shows the annual solar electricity generation in kWh from 2012, the firstyear of production, through 2015. Overall,ChaboyaNorthCeronetotal VTA1,800,000solar electricity production1,600,000 in 2015, as compared towas 4% higher2014, due1,400,000to more favorable weather1,200,000conditions.Figure 4: Solar Electricity r ,0002,500,00010,000,0002,000,0008,000,000In 2015, VTAused 127,874 therms and600,000spent 115,708400,000 on natural gas. Naturalgas is used200,000primarily at Chaboya, North0 Divisions for heating.and Guadalupe2012River Oaks Division uses a small amountof natural gas for heating 0500,0000020122008201320132014201420152015Figure 5: Natural Gas Usage at Operating DivisionsDrought AllocationChaboyaNorthRiver Grid (Excl. TP)The 2015 electricity use at VTA’s main40,000,000operating divisions, excluding light rail, is35,000,000shown30,000,000in Figure 3. The majority of electricity25,000,000consumed at all three bus divi20,000,000sions is supplied by solar power. In 2015,15,000,000as comparedto 2014, total electricity10,000,000use dropped by 1.6% at Cerone, 2.9% at5,000,000Chaboya, 1.2%at North, and 1.2% at River0200820152014Oaks.3,500,0002013Traction 82014201502013The natural gas use at VTA’s operating divisions, excluding Cerone Divisionwhich uses propane, is shown in Figure 5.RecyclingWasteSince the 2008 baseline year, natural gasuse decreased by 29%. Usage increasedby 17% compared to the previous year,resulting in a cost increase of 5,035.This increase was primarily due to coolerweather in November and December2015 compared to the same monthsin 2014.2008201420156
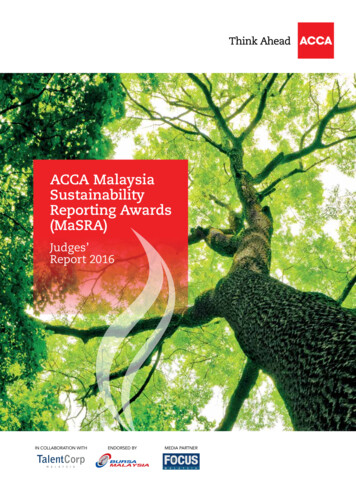
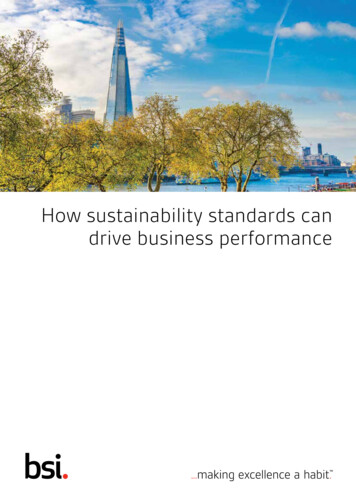
rDrought 008River OaksCeroneNorth201320142015Figure 7: Potable Water Use at VTA’s Operating DivisionsChaboyaNorthCeroneRiver 2,000,0002008201320142015WaterVTA’s water is supplied by the Great Oaks WaterCompany, San Jose Water Company, and the cities of San Jose, Santa Clara, Sunnyvale, Milpitas,Morgan Hill, Mountain View, and Palo Alto.Potable and recycled water use throughout theentire VTA system is shown in Figure 6. Since theChaboyaNorthRiver OaksGuadalupe2008200,000baseline year, total water use has decreasedby180,0009 million gallons, or 17%, which is enough water160,000to fill 14 Olympic-size swimming pools. Since 2014,140,000potablewater use has decreased by 39%. This120,000decrease is due to efforts to respond to manda100,000tory drought restrictions.NorthCeroneFigure 8: Waste and 000ChaboyaHazardous1,800,000 waste is generated at Chaboya,North,1,600,000Cerone, and Guadalupe Divisions.1,400,000Waste streams include steam cleaner and1,200,000bus wash sump interceptor waste and1,000,000absorbent800,000 pads used to remove oil andgrease600,000and clean small spills. In com400,000parison to the 2006 baseline year, haz200,000ardous waste decreased by 130 tons. In020132015, these divisions2012generated 179 tonsof waste, a 26% reduction compared tothe previous year. The reduction in wasteresults from fluctuations in maintenance activities, improvements in waste management, andincreased employee education and awareness.kWh12,000,000GallonsGrid (Excl. TP)kWh50,000,0002,000,000ThermskWhPotableTraction Power45,000,000VTA’ssolid waste and recycling provid40,000,000ers are Republic Services and the City of35,000,000MountainView. In 2015, approximately 77430,000,000tonsofmaterials(mixed paper, plastic,25,000,00020,000,000aluminum,glass, wood, and metal) were15,000,000recycled and 1,212 tons of waste were10,000,000collected by VTA’s solid waste provid5,000,000ers, representinga waste diversion rate020082015of 39%. Overall, VTA has 2014reduced wasteby approximately 2% compared to theprevious year and 50% compared to thebaseline 002,500,00020Waste and RecyclingFigure6: Total VTA Water 60,000Potable water use at VTA’s operating divisions is40,000shown in Figure 7. All divisions worked diligently20,000to reducepotable water consumption to meet0200820152014 decrease, whichdrought restrictions.The largestoccurred at Chaboya, is due to the recycled waterconnection installed in December 2014.1,00050002008201420157SolarTraction PowerGrid (Excl. TP)
ACCOMPLISHMENTSVTA’s Sustainability Program achieved manyaccomplishments in 2015. Each accomplishmentis a validation of VTA’s commitment to increasingenvironmental performance and efficiency. Eightkey accomplishment areas for 2015 are summarized in this section. A summary table of pastaccomplishments is also provided.Sustainability initiatives are identified by VTA’sSustainability Team and funded through theSustainability Program. The Team is comprisedof employee representatives from across theagency. Since 2007, the Team has met monthlyto identify initiatives and report on progress. Inaddition, approximately five employees allocate aportion of their time to support the Program.Accomplishment Area 1:Responding to DroughtEmergencyCalifornia is currently in its fifth year of severedrought. On April 1, 2015, Governor Brown calledfor mandatory water reductions averaging 25%BEFOREAFTERthroughout the state. In response to local waterconditions, the Santa Clara Valley Water Districtset a water use reduction target of 30% relativeto water use in 2013 and placed a restriction onirrigating outdoor landscapes and lawns withpotable water to two days per week.In response to water reduction requirements,VTA formed a Water Working Group to developand implement water conservation strategies.As a result, VTA reduced potable water use by21% compared to 2013 by taking the followingactions: Bus washing was reduced from two times perweek to one time per week, if needed. Irrigation use was cut back by 10 to 20%(or completely shut off in some locations)and schedules were adjusted to meet localrestrictions. Monthly reporting was conducted to identifyhigh and abnormal use. Leaks were identifiedand repaired at several light rail stations andpark-and-ride lots. Grass at the River Oaks Division was replacedwith drought tolerant landscaping. The project was completed in early 2016 and includedwater wise plants, a drip irrigation system,and mulch. A rebate from the Santa ClaraValley Water District covered approximatelyhalf the project cost. Trees that were overly stressed by thedrought were replaced with native trees atthe River Oaks Division. Cuttings from thefelled trees were reused on-site and repurposed as benches or mulch. The bus wash at Chaboya Division was connected to recycled water, reducing potablewater consumption by 90%.9
Funding for the charging stations was provided by a grant from the Bay Area AirQuality Management District. VTA purchased and installed four electricbicycles for use by VTA employees aroundthe River Oaks campus. The chargers are connected to small solar panels, and the bikescarry enough energy to travel approximately20 miles per charge.Accomplishment Area 3:Retrofitting Existing FacilitiesVTA continues to replace fluorescent and highpressure sodium light fixtures with LED fixtures.The benefits of LED lighting include: lower wattage and energy use, better quality lighting, andlower maintenance costs. Achievements for thisAccomplishment Area 2:Reducing Vehicle Emissionsreporting year include: A total of 140 light fixtures were replaced ateight light rail station platforms (Baypointe,Greenhouse gas (GHG) emissions are emit-Gish, Great America, Lick Mill, Metro,ted, in part, through the burning of fossil fuel.Mountain View, Old Ironsides, and Tasman).Approximately 79% of VTA’s GHG emissions dur-These retrofits are estimated to save 9,400ing 2015 were related to the operation of the rev-per year with return on investment period ofenue fleet. VTA seeks to reduce GHG emissions3.4 years.that contribute to climate change by greeningthe agency’s fleet, adding electric vehicle charging stations, and promoting bicycling.Accomplishments for this reporting year include: A total of 506 light fixtures were replacedat six light rail station platforms in thedowntown transit mall (northbound andsouthbound Santa Clara, St. James, and SanAntonio). The retrofits included replacing 46 In 2015, diesel-electric hybrids made up250-watt high pressure sodium lights with20% of VTA’s revenue fleet. Currently, VTA65-watt LED fixtures and 406 21-watt fluo-is applying for funding to purchase electricrescent bulbs with 7-watt LED bulbs. Thesebuses as part of a pilot program. When aretrofits are estimated to save 15,400 perrevenue or non-revenue vehicle exceeds itsyear with return on investment period of 2.4useful lifespan, VTA replaces it with a fuelyears.efficient vehicle according to the agency’sSustainable Fleet Policy.In addition, several improvements were madeto the River Oaks Division. The cafeteria was Five electric vehicle charging stations wereinstalled at the Eastridge Transit Center.remodeled with flooring certified by the SCSGlobal Services, gently used chairs purchased10
A Print-Copy-Scan Policy was approved toreduce the consumption of paper and promote the use of technology in lieu of printing or copying. Pursuant to this Policy, blackand white duplex was set to the agency-widedefault print and copy setting. Duplex usagehas increased by 10-15% as a result. Select departments within VTA converted toelectronic timekeeping system. The eTimesystem automates timekeeping workflow,from Yahoo! Inc., and coffee and side tables builtfrom wood pallets. Piping and other necessarycomponents were installed on the roofs to allowfor the use of natural gas for heating. HVAC unitswere replaced with more energy efficient modelsthereby eliminating printed time cards, leaverequest forms, and timekeeper reports. Theestimated paper savings includes 134,920sheets or 1,349 pounds per year. The Copy Center improved their online order-that allow more flexibility to control temperature.ing system, and held an employee lunch-LED lighting and ceiling tiles, made with recycledand-learn to promote the use of Copy Centercontent, continue to be installed as needed.services and increase efficient, smart printing.The Copy Center continues to accept scrapAccomplishment Area 4:Promoting Technology overPaperpaper which it turns into notepads. Maps of conference rooms with audio-visualresources were developed and posted on theemployee intranet. These resources enablepaperless meetings by displaying documentsOver the last few years, VTA has been work-on-screen.ing towards reducing the consumption of officepaper and implementing paperless technolo- Human Resources reduced paper by updat-gies. In 2010, VTA performed an assessment ofing forms to be more concise, eliminating673 imaging devices. The assessment led to thetriplicate forms, sending offer letters anddecision to consolidate outdated stand-alone faxannouncement memos electronically, andmachines, printers, scanners, and copiers intoconducting application and open enrollmentenergy efficient multi-functional devices. In 2014,processes electronically.VTA initiated the Managed Document ServicesProject to promote the use multi-functionaldevices, scanning, and other technologies overprinting and copying. As a result, the total devicecount was reduced by 65% which equates to anestimated cost savings in consumables and electricity of 190,400 per year.To further promote the use of technology in lieuof printing or copying, VTA took the followingactions in 2015:11
Accomplishment Area 5:A space for VTA employees to freely exchangeIncorporating SustainabilityPrinciples in Project DesignCenter is a simple, sustainable way to share andoffice supplies was created in 2015. The Reusereuse supplies. Before discarding perfectly usableitems, employees are encouraged to bring themSustainability principles are integrated intoto the Reuse Center. Before buying new, employ-the design of capital projects when feasible.ees can check for existing supplies at the ReuseSustainable design features for VTA’s BARTCenter. This cycle reduces waste at VTA by reus-Silicon Valley Berryessa Extension Project includeing what we have.LED lighting, skylights, photovoltaic parkingstructures, variable speed escalators, drought-VTA partners with agencies like the Greentolerant landscaping, and water efficient fixtures.Education Foundation (GEF) and Goodwill toTire derived aggregate (made out of shreddedprovide a convenient way for people to recycletires) is being installed under the BART tracks totheir used household items and textiles. In 2015,reduce vibration.VTA partnered with GEF to install NeighborhoodDonation Recycling Stations at three park-and-Sustainable design features for the Santa Clara-ride-lots. The stations are made from recycledAlum Rock Bus Rapid Transit Project includeshipping containers, which have been paintedthe use of LED lighting, rubberized asphalt,and retrofitted with solar to power LED lights, areclaimed asphalt pavement for subbase mate-wireless monitoring system, and touchscreen dis-rial, and Cold In-Place Recycling (CIPR) for pave-play. Proceeds from textile recycling are used toment rehabilitation. CIPR is an on-site method ofprovide environmental curriculum and resourcesapplying recycled asphalt. It consists of grindingto K-12 students and teachers.the existing asphalt, mixing the ground materialwith a recycling agent on-site, and applying itto the roadway. The process eliminates the needto transport old asphalt from the site to a recycling plant and back again for use on the job site,thereby reducing emissions.Accomplishment Area 7:Improving EnvironmentalAwarenessVTA implementedAccomplishment Area 6:a stormwater man-Reducing Wasteto comply withagement programMunicipal SeparateA pilot program to replace traditional open-airStorm Sewer Systemtrash cans with solar-powered trash and recy-(MS4s) permitcling containers was initiated in 2014. The high-requirements. Thetech units hold five times the amount of wastefocus of the program is to increase awarenessdue to solar powered compaction. Staff is noti-of Best Management Practices to prevent pollu-fied electronically when the units need to betion from stormwater runoff. Stormwater runoffemptied. Additional Big Belly units were installedoccurs when excessive water from irrigation, carat Mountain View and Tasman Light Rail Stationswashing and other sources carries litter, pesti-in October 2015.cides, oil, and other pollutants into the stormdrain system, which then flow directly to local12
waterways. Employee trainings were conductedVTA began implementing a pilot EMS programagency wide. Other outreach efforts includedat the Cerone Division in 2013. An EMS Coreposters, surveys, and posting on VTA’s website.Team was establish
in 2010, and special events. Funding for the Sustainability Program is dependent on the two-year budget process. Future funding would enable VTA to continue current efforts in the areas listed above, achieve ISO certification for VTA's Environmental Management System, quantify GHG emissions to enable preparation of a Climate Action Plan,