Transcription
Using online social networksto measure consumers’ brandperceptionReceived (in revised form): 9th December, 2016Jennifer Cutleris an assistant professor of marketing at Northwestern University’s Kellogg School of Management.Her research focuses on using social media to understand consumer behaviour and the effects ofmarketing communications. She received her PhD in business administration from Duke University witha specialisation in quantitative marketing.Northwestern University, Kellogg School of Management, 2001 Sheridan Rd., Evanston, IL 60208, USATel: 1 847 491 3522; E-mail: jennifer.cutler@kellogg.northwestern.eduAron Culottais an assistant professor of computer science at the Illinois Institute of Technology in Chicago, wherehe leads the Text Analysis in the Public Interest lab. His research focuses on extracting socially valuableinsights from online social networks. He is a former Microsoft Live Labs Fellow with a PhD in computerscience from the University of Massachusetts, Amherst. More than 40 of his research articles have beenpublished, and his work has received best paper awards at the Association for the Advancement ofArtificial Intelligence conference and the Conference on Computer-Supported Social Work and SocialComputing.Department of Computer Science, Illinois Institute of Technology, Chicago, IL 60616, USATel: 1 312 567 5261; E-mail: aculotta@iit.eduAbstract The ability to measure and monitor specific dimensions of brand image hasa range of useful applications in marketing, from developing competitive strategy toidentifying strength and weaknesses to evaluating the effectiveness of marketing initiatives.Nevertheless, obtaining reliable measurements is an ongoing challenge for marketers.Traditional methods such as administering surveys can be expensive and biased, and arelimited in scale, both in terms of the number of brands and dimensions that can be tracked,and the frequency with which the measurements can be updated. The explosion of socialmedia in recent years has created an enormous secondary data trail that is available foranalysis. However, the most common analytics approaches, such as those that rely onuser-generated text, are difficult to apply due to the scarcity of relevant conversations,as well as the ambiguity, variety, and often rapid changes in linguistic terms used byconsumers. This paper describes a recent advance in marketing science that makes use ofbrand social network connections to make highly scalable inferences about brand image.This promising new approach provides many potential advantages, including the ability tofully automate monitoring for a large number of brands over a wide range of dimensions.KEYWORDS: social media, brand image, social networks, Big Data, perceptual mapsINTRODUCTIONUnderstanding how consumers perceivedifferent brands within a competitive set isintegral to many marketing goals. However,312brand image can comprise a wide range ofdimensions relevant to sales. In additionto traditional attributes such as qualityand price,1 consumers consider aspects ofApplied Marketing Analytics Vol. 2, 4 312–321 Henry Stewart Publications 2054-7544 (2017)
Using online social networks to measure consumers’ brand perceptiona brand’s personality, such as its sincerityand sophistication,2 and, increasingly, thebrand’s alignment with social causes suchas environmental friendliness, health andsocial responsibility.3,4 For example, in a2015 survey of 30,000 global consumersadministered by the Nielsen Company,nearly three-quarters of millennials — andtwo-thirds of consumers overall — indicateda willingness to pay a premium forenvironmentally responsible productsand services.5Measuring and monitoring suchincreasingly dimensional aspects of brandimage presents a real challenge for marketers.By and large, marketers have relied uponsurveys or choice tasks administered toa sample of customers to measure brandperceptions. However, reliance on acquiringconsumer responses hinders measurementcapabilities: surveys are costly to administer;respondent pools are often sparse anddeplete quickly, particularly for certaindemographics; participants may be unableor unwilling to reveal their true beliefs;participant attention may wane in the face oftoo many questions; and results may becomeoutdated quickly, particularly if there is ashock or campaign to shift brand image.6–9The explosion of social media in thepast decade has raised hope among manymarketers that the ‘Big Data’ trail onplatforms such as Twitter, Facebook, andAmazon could be mined to uncover richerand more scalable insights about consumerbehaviour and perceptions. While much hasbeen accomplished on this front, managersstill frequently find themselves unable toextract meaningful, reliable and actionableinsights from the sea of available data.The goal of this paper is to describe apromising new methodological developmentin the space — the use of a brand’s socialmedia network connections to estimate thestrength of specific dimensions of brandimage, such as eco-friendliness.10 The paperwill provide both a general conceptualoverview of this new approach, which canbe flexibly adapted and implemented for arange of goals, as well as detailed instructionsfor how to utilise Twitter’s applicationprogramming interface (API) to generateperceptual maps automatically.WHY USE SOCIAL NETWORKS?To many marketers, ‘mining social mediadata’ is synonymous with ‘mining usergenerated text’. Indeed, there is a lot ofvalue to be gained from looking at whatconsumers are writing about brands inonline spaces (for an overview, see Faderand Winer11). However, there are limitationsto relying on user text. On many socialmedia platforms, fewer than half the userswrite their own content;12 fewer still writeabout the brands to be monitored; and evenfewer write about brands in conjunctionwith topics or attributes of interest. Yet,every user who connects with a brand viaan online platform (whether by followingthe brand on Twitter, liking the brand onFacebook, or even by liking or sharing abrand’s post) provides information by theirvoluntary ‘mere virtual presence’13 in thatonline brand community. While liking orfollowing a brand is not always indicativeof affinity for the brand, it appears to be thecase most of the time.14,15 Furthermore,each member of a brand’s online communityis likely to be a part of many other onlinecommunities (ie to follow other accounts).By tracing network relationships to learnmore about who a brand’s fans are — whatthey value and are interested in — one cangain insights about brand image that remaininvisible in user-generated text.CONCEPTUAL APPROACHThe general approach to measuring thestrength of association between a brandand a topic or cause of interest is to lookat the communities forming online aroundthe brand and the topic, and to measurethe similarity, or overlap between thesecommunities. Henry Stewart Publications 2054-7544 (2017) Vol. 2, 4 312–321 Applied Marketing Analytics313
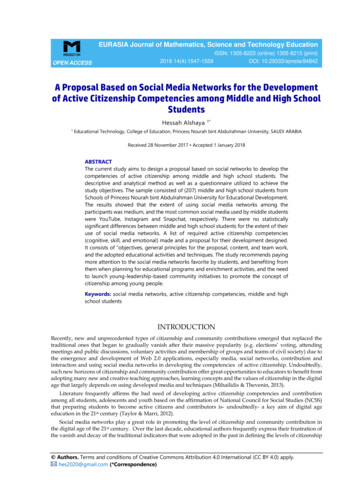
Cutler and CulottaBrand AEnvironmental Exemplar Accounts(eg, green non-profits)Brand BFollowersFigure 1: Here, the overlap between follower community and environmental community is greater for Brand Bthan for Brand A; one can therefore infer that Brand B is likely to have a stronger reputation for environmentalfriendliness than Brand AFor example, if a manager is interestedin comparing the relative perceived ecofriendliness of two brands (Brand A andBrand B), they can: identify a sample of social media followersof Brand A and Brand B;identify a sample of social media followersof organisations, such as Greenpeace or theConservation Fund, that exemplify interestin eco-friendliness (how to identify suchaccounts will be discussed in the nextsection); andmeasure which brand’s communityoverlaps more with the eco-friendlycommunity (a range of network similaritymetrics can be used and will be discussedin the next section).This approach is conceptually illustrated inFigure 1.The approach rests on a simpleassumption: that brand perceptions arereflected in the brand’s followership.More specifically, it assumes that a specificdimension of brand image is reflected in theoverlap between a brand’s followership andthe followership of accounts known to beperceived as strong in that dimension. Thereare many reasons to think that this might notwork — that follower overlap would notreliably reflect perceptions. One objection314is that not all follow relationships indicateaffinity; a devoted environmentalist, forexample, might follow the accounts of someorganisations known to be environmentallyunfriendly in order to keep abreast ofnews. Another is that there may not alwaysbe overlap in the types of organisationsindividuals follow; some environmentallyconscious consumers, for example, mightnot follow any environmental ‘exemplar’accounts. Yet despite the noise created bysuch cases, the results obtained throughthis method have been shown to havea high correlation with directly-elicitedsurvey responses16 — while being easierand less expensive to obtain. Thus, whileindividual motivations for following brandscan be varied and complex, the aggregatesignal obtained over millions of followerrelationships appears to be quite informative.METHODThe social media platform Twitter isideal for this kind of analysis because it iswidely used by marketers and consumersto build brand communities, and becauseit has an open API that allows relevantinformation about social networks tobe programmatically extracted for freeusing common scripting languages such asApplied Marketing Analytics Vol. 2, 4 312–321 Henry Stewart Publications 2054-7544 (2017)
Using online social networks to measure consumers’ brand perceptionPython. This section will describe a specificimplementation of this approach usingTwitter; however, the conceptual approachcould be applied many ways, including onother platforms.How to extract brand followersTo begin, a list of Twitter handles forthe brands to be monitored is needed.Presumably, marketing managers are alreadyaware of the handles for their brands andtheir primary competitors. Handles foradditional brands can be easily searched formanually, either on Twitter itself, or onthe brand’s website. Once a list of brandhandles has been created, the Twitter SearchAPI can be invoked to create a list of userIDs (or screen names) for the n most recentfollowers of each brand.As of the writing of this paper, accessto the Twitter Search API is free and welldocumented.17 However, Twitter limits thenumber of user IDs that can be extractedevery 15 minutes. Many popular brandshave millions of Twitter fans: for example,Pepsi, Whole Foods and McDonalds eachhave over 3 million followers, and celebritybrands such as Britney Spears and KimKardashian approach 50 million. Due toTwitter’s rate limit, collecting all of a brand’sfollowers may take a prohibitively long timefor such popular icons; fortunately, studieshave shown that accurate brand perceptionmeasures can be obtained using just samplesin the range of few hundred thousandfollowers.18 Capping follower collection alsoensures that it is the most recent followers,whose follow connections are likely mostindicative of current brand perceptions,that are factored into the measure, asTwitter returns account followers in reversechronological order of follow data.How to identify exemplar accountsThe next step is to identify a set of Twitteraccounts for organisations that exemplifythe attribute of brand image to be measured.The most straightforward way is to usedomain knowledge to identify a list ofexemplar organisations (potentially with theaid of a committee of experts or a writtenguide) and to look up each organisation’sTwitter handle manually. Many aids exist forsuch tasks. For example, CharityNavigator.org maintains lists of nonprofit organisations,organised by the primary cause theysupport; these lists can be used to identifyhigh-quality exemplars for causes suchas environmental friendliness or socialresponsibility. In many cases, however,an automated approach to exemplaridentification is feasible and preferable tosuch manual curation; details on automatingthe process are described next.Fully automating the processIn many cases, manually curating highquality exemplar lists may be a difficultand labour-intensive task (particularly ifa manager is interested in tracking manyperceptual attributes). Furthermore, theaccounts that most exemplify an attribute ofinterest may change over time, requiring thelists to be updated. Fortunately, the crowdorganisation of Twitter can be leveraged toautomatically identify accounts that usershave already identified as relevant to anattribute of interest.Since 2009, Twitter has maintained a‘Lists’ feature19 through which users canorganise the accounts they follow intotopic-cohesive lists. This allows them tocreate different newsfeeds that map todifferent interests, and to share lists withother users who are interested in the sametopics. Managers can leverage this crowdorganisation by using a search engine tosearch through Twitter Lists for a keywordof interest (this search process can beautomated through scripting). Keywords canrange from a single word to a longer, morespecific phrase; managers can vary the queryaccording to their goals. Searching for akeyword will return a set of user-curated lists Henry Stewart Publications 2054-7544 (2017) Vol. 2, 4 312–321 Applied Marketing Analytics315
Cutler and Culottathat map to that keyword, and each list willcontain a set of accounts. Managers can takethe top y lists returned for a keyword, andretain as exemplars accounts that appear onat least z lists. Requiring that accounts be onmore than one relevant list reduces the riskof false positives, ie accounts idiosyncraticto a particular user, that do not accuratelyreflect a more general association betweenthe account and the keyword-specifiedattribute. Finally, if any of the brandaccounts (from the set of brands for whichbrand image is to be measured) happen toappear in the exemplar set, they should beeliminated from the exemplar set.For example, a search through TwitterLists for ‘environment’ returns hundreds oflists users have created that are relevant tothat term. Retaining accounts that appearin at least two of the top 50 lists leads to aset of 74 exemplar accounts, with examplesincluding @GreenPeace, @SierraCluband @Epa.There are many benefits to this automatedapproach. First, it enables the identificationof accounts that consumers see as relevantto a topic, but that might not be knownto those doing the measurement (this isparticularly relevant where consumers areof a different demographic from themarketing researchers). This is likely toimprove the quality of resulting brand imagemeasures, as small, esoteric exemplars —the kind perhaps less likely to be knownby non-enthusiasts — tend to be the mostinformative. Secondly, it opens the doorto scalability. With one script, exemplaraccounts can be identified for a wide rangeof brand image dimensions, and exemplarscan be automatically updated over timeas the perceptual landscape changes.However, the approach has limitationsas well. The quality of accounts returnedfor a given keyword query (that is, theextent to which those accounts have afollowership that values the brand imagedimension represented by the keyword)may vary and is a priori unknown. Studies316have shown success with keywords suchas ‘environment’, ‘nutrition’ and ‘luxury’to identify exemplars of environmentalfriendliness, nutrition and luxury,20 buthave not yet probed the boundaries ofwhen keyword-based matches break down(for example, for very broad terms such as‘quality’) — or how they can be improved(for example, with sector-specific keywordadditions). Managers are encouraged toexperiment with the queries and selectionalgorithms to find implementations bestsuited to their specific goals.How many exemplar accounts areneeded?For more specific keyword queries, or formanual exemplar curation, it may be difficultto obtain large numbers of exemplars. Ofcourse, the number of exemplars neededis not independent from the dimensionbeing tested or the quality of exemplarsidentified. Studies have shown success withexemplar sets ranging from 30 to 400, andthe marginal increments in accuracy foradding additional exemplars seems to plateauquickly.How to compute network similarityOnce exemplar accounts have beenidentified, a list of user IDs for the followersof each exemplar account can be collectedfollowing the same process as described forthe brand accounts. At this point, each brandand each exemplar has a list of followersassociated with it. The goal is now to createa single quantitative measure that indicatesthe ‘similarity’ between each individualbrand’s community and the full set ofexemplar communities.There are a wide range of standardnetwork similarity metrics that could beemployed at this point; a range of testssuggests that many different metrics willproduce substantively similar results.This paper will describe in detail oneApplied Marketing Analytics Vol. 2, 4 312–321 Henry Stewart Publications 2054-7544 (2017)
Using online social networks to measure consumers’ brand perceptionimplementation that has worked particularlywell.To quantify the perceived strengthof association between a brand Bx andan attribute Ak (for which there areidentified exemplar accounts Eki to Ekj),the first step is to compute the similaritybetween Bx and each exemplar Eki to Ekjindividually. Because the brands in the setbeing monitored may vary a great deal inthe number of followers they have, it isimportant not to rely simply on the rawnumber of followers that overlap — suchcounts are likely to be higher for extremelypopular brands with millions of followers.Instead, one can employ a commonmeasure of set similarity called the Jaccardindex, which is defined as the size of theintersection of two sets divided by the sizeof the union of the same two sets. Moreformally:J(X,Y ) X Y X Y Thus, J(Bx, Eki ), is the ratio of the number ofunique followers who follow both accountsto the full number of unique followers in thepooled communities, as follows:Similarity (Brand Bx, Exemplar Eki ) # of unique users that follow both Bx and Eki# of unique users that follow either Bx or EkiBecause there are many exemplars(Eki Ekj) associated with an attribute Ak,the next step is to roll up these individualsimilarities between the brand and eachexemplar into a single quantification forthe attribute. A simple and direct approachwould be to calculate the mean of thesimilarities between Bx and each exemplar.However, such an approach treats allexemplars as equally informative, whileboth theory and prior research suggest thataccounts with fewer followers are likely tobe more informative for topic associations(see Culotta and Cutler21 and Manninget al.22). For example, @AlGore appears onmany user-generated ‘environment’ lists,and is clearly an account that is relevantto environmental issues — but his countof nearly 3 million followers reflectsthat his appeal is likely broader than justenvironmental. As many of his followersmay follow him for reasons other than theenvironment, the environmental signal ofhis followership is diluted. In contrast,@DarrenGoode, an environmental reporter,also appears on multiple user-generate‘environment’ lists — and his count of only8,000 followers signals that his draw may bemore targeted. Thus, it is recommended touse a weighted average of Jaccard similarities,where the similarities are weighted by theinverse of the exemplar’s follower count. Itis further recommended to take the squareroot of the final sum, to reduce the skewof the resulting distribution of similaritymeasures.Specifically:jSPS(Bx, Ak ) 1*J(Bx, Ekn )Σn i Ekn j1Σn i Ekn Where Ekn is the number of followersof exemplar Ekn, and SPS(Bx, Ak) is the‘social perception score’ of Bx forattribute Ak, ie the estimated strength ofBx’s brand image along the specific attributeof Ak. Each brand’s social perception scorewill range from zero to one, with greaternumbers indicating stronger brand imagefor that attribute. While the raw scorereturned for a single brand is, on its own,generally difficult to interpret, the relativescores of different brands provide meaningfulinformation about relative associations, andcan be used to populate perceptual maps.Although the above equation is presentedas an example of a similarity calculation thathas worked well, it is not a prescriptionthat must be followed in all cases; theprimary goal is to use a consistent methodof quantifying the similarity between thefollower base of a brand, and that of a group Henry Stewart Publications 2054-7544 (2017) Vol. 2, 4 312–321 Applied Marketing Analytics317
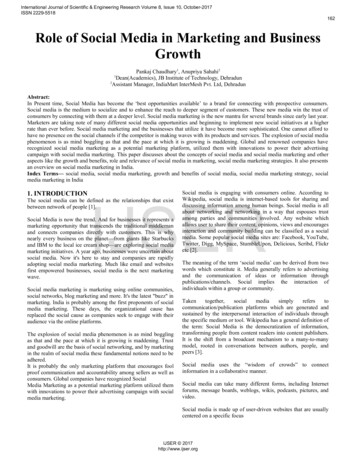
Cutler and Culottaof exemplar accounts — and this generalmethod appears to be robust to a range ofdifferent similarity metrics.Extending to other platformsWhile tested primarily on Twitter, theapproach could be applied in any contextin which brand network information canbe obtained. For example, Facebook alsohas an open API that can be used toextract information about user activityon brand fan pages. While the API doesnot currently provide access to the listof users that ‘like’ a fan page (whichwould be the most direct corollary to the‘follow’ relationship on Twitter), networkscan be constructed in other, accessibleways — for example, by using lists ofusers who have liked or commented onmarketing-generated posts that appear onthe brand’s fan page (such lists are easilyretrievable for all fan pages through the API).In cases where brands do not maintaincentralised social accounts, networks couldpotentially be constructed based on theauthoring of user-generated posts thatmention the brand, or relevant forumparticipation.EXAMPLESImplementing the above process for a setof brands and a keyword representing adimension of brand image will result in aseries of scores for the brands, indicatingestimates of the relative strength of eachbrand’s image in that dimension. Thesescores can then be used to generateperceptual maps or other market structurevisualisations. Below, this method isapplied to two examples (eco-friendlinessperceptions of personal care brands andnutrition perceptions of food brands) andthe resulting estimates compared againstconsumer surveys, which are a moretraditional method of estimating brandperceptions.318Eco-friendliness perceptions of personalcare brandsFor the first example, the perceivedeco-friendliness of 20 personal carebrands is measured (using the keyword‘environment’ to automatically identifyexemplar accounts), and compared againstthe average responses of a questionnaireadministered to 500 people (via AmazonMechanical Turk) asking them to directlyrate the eco-friendliness of each brand ona scale of 1 to 5. The resulting scatter plotis shown in Figure 2.Overall, the correlation between theTwitter-based estimates and the surveybased estimates is 0.79 (Pearson method,p 0.0001), indicating a strong — thoughnot perfect — similarity between thetwo measures. Survey-based methods aregenerally considered to be the gold standardfor measuring consumer perceptions,although even these are not perfect: first,there is often wide variance in consumerbeliefs, and summary statistics such asmean and median values may not alwaysrepresent general perceptions well; andsecondly, consumers do (or can) not alwaysaccurately indicate their beliefs throughthe questionnaire (they may not be awareof their own beliefs, or may falter intranslating them to a linear scale). Thus,it is not entirely clear that the Twittermethod is fully in error when it does notalign perfectly with the survey scores; it islikely that both the survey and the Twittermethod are approximations. Nonetheless,the strong similarity between the measures isencouraging that there is meaningful signalin the Twitter-based estimates. Lookingat the scatter plot in Figure 2, one canobserve that both the Twitter and surveymethods reveal similar market structures:Burt’s Bees stands out as having a verystrong green image, followed by Aveda(which is perceived as green, but not asstrongly), followed by the rest of the brandsin a cluster, which all receive near-averagegreen ratings. Within this cluster of relativelyApplied Marketing Analytics Vol. 2, 4 312–321 Henry Stewart Publications 2054-7544 (2017)
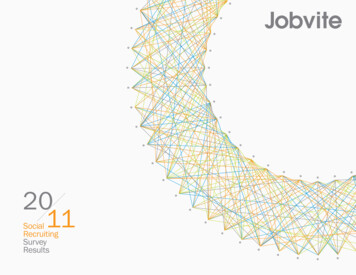
Using online social networks to measure consumers’ brand perceptionFigure 2: Comparing survey vs Twitter network based estimates of the perceived eco-friendliness of twentypersonal care brands. Scores have been standardised for easier comparison (mean 0, standard deviation 1).Each point represents the scores of a single brand, labelled with its Twitter handle. Some labels are omitted forreadability.neutral perceptions, the survey and Twittermethods do not always align on the preciserankings of the brands; this may be due toerror in one or both measures, or it maysimply be that the differences in green imageamong the brands in this cluster are not clearin the population. Either way, the overallmarket structure and the key outliers areclear via both methods.Nutrition perceptions of food brandsAs a second example, the nutritionperceptions of 43 food brands is measuredand compared against survey results obtainedin a manner similar to that describedabove, using the keyword ‘nutrition’ toautomatically identify exemplar accounts.This scatter plot is shown in Figure 3.Here, the correlation between Twitterand survey based estimates is also 0.79(Pearson method, p 0.0001). Lookingbroadly, one can see that both measurespredictably show health-oriented brandssuch as Organic Valley, Nature’s Path andGreen Giant at the top, and candy/snackfood brands such as Oreo, Doritos andSnickers at the bottom. One can also makeout some sub-structures. For example,looking specifically at cereal brands, onecan see through both measures that whilenone of the brands appear on the extremeends of the spectrum, brands such as SpecialK, Cheerios and Kellogg’s are substantiallyhigher up the nutrition scale than, forexample, Cap’n Crunch, which is ratedmore closely to candy and junk food. As inthe prior example, disagreements betweenthe Twitter and survey measures appearmore pronounced in the middle of thescale. Again, some of this seeming error Henry Stewart Publications 2054-7544 (2017) Vol. 2, 4 312–321 Applied Marketing Analytics319
Cutler and CulottaFigure 3: Comparing survey vs Twitter network based estimates of the perceived nutritional value of 43 brands.Scores have been standardised for easier comparison (mean 0, standard deviation 1). Each point representsthe scores of a single brand, labelled with its Twitter handle. Some labels are omitted for readability.may be a by-product of more inconsistentperceptions/ratings for brands that are notstrongly differentiated by the perceptualattribute at hand, rather than a systematicdifference between measurement techniques.However, there are also individual caseswhere the Twitter method appears tosubstantially over or underestimate nutritionperceptions, such as for Wheat Thins (whereit is underestimated) and Pepperidge Farms(where it is overestimated). Such instancesmay reflect strategic marketing campaignsdesigned to change/amend prevailingimage (the effects of which may be moreapparent through Twitter followershipthan surveys of the general population);may reflect idiosyncrasies in followermotivations (ie users may follow oneaccount for substantially different reasonsthan other accounts in the sector, such asfor news updates); or they could simply320reflect noise. It may be possible to improveaccuracy by adjusting the search keyword(here, the single word ‘nutrition’ was used),by manually reviewing and filtering thereturned exemplar accounts, or otherwiseadjusting the implementation. While theoverall correlation between Twitter-basedand survey-based estimates is high in thedefault implementation, the disconnectedexamples serve as a reminder that thismethod is nascent — a tool to add to themarketing analyst’s arsenal, but not to beapplied blindly.CONCLUSIONA large amount of information is revealedby who follows a brand on social media —and whoever else they in turn follow.Harnessing this information providesexciting new opportunities for monitoringApplied Marketing Analytics Vol. 2, 4 312–321 Henry Stewart Publications 2054-7544 (2017)
Using online social networks to measure consumers’ brand perceptionbrand image. Compared with traditionalmethods for measuring brand image, suchas administering consumer surveys, thisapproach allows for unprecedented scale;full automation over freely available dataallows for a large number of brand imagedimensions to be tracked over time fora large number of brands. Comparedwith more common social media-basedapproaches, such as analysing the text ofuser-generated posts, this approach drawsinferences from a wider range of brandfans (the majority of whom generally donot contribute content) and can measureassociations unlikely to be discussed directlyon public platforms.A specific, tested implementation wasdescribed in detail to help marketers hit theground running when trying out this newapproach. But this is just a starting point.The main takeaway is the general additionof social media community-based measuresinto the marketer’s broader analytics toolkit.Community membership and communitysimilarity can be measured a number ofdifferent ways, and marketers are encouragedto explore and test implementation decisionsthat work best in different contexts.ACKNOWLEDGMENTSThis research was funded in part by supportfrom the National Science Foundation undergrant #IIS-1618244. Any opinions, findingsand conclusions or recommendationsexpressed in this material are those of theauthors and do not necessarily reflect thoseof the sponsor.References1.2.3.Zeithaml, V. A. (1988) ‘Consumer perceptions ofp
312 Applied Marketing Analytics Vol. 2, 4 312321 Henr Stewart Publications 2444 21 Using online social networks to measure consumers' brand perception Received (in revised form): 9th December, 2016 Jennifer Cutler is an assistant professor of marketing at Northwestern University's Kellogg School of Management.