Transcription
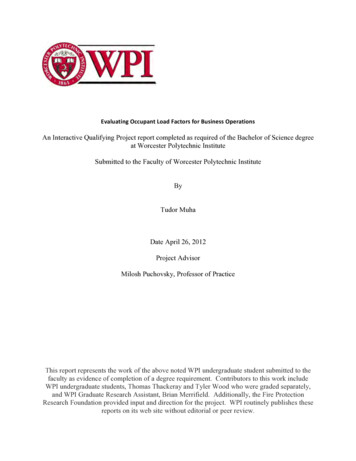
An Interactive Qualifying Project report completed as required of the Bachelor of Science degreeat Worcester Polytechnic InstituteSubmitted to the Faculty of Worcester Polytechnic InstituteByTudor MuhaDate April 26, 2012Project AdvisorMilosh Puchovsky, Professor of PracticeThis report represents the work of the above noted WPI undergraduate student submitted to thefaculty as evidence of completion of a degree requirement. Contributors to this work includeWPI undergraduate students, Thomas Thackeray and Tyler Wood who were graded separately,and WPI Graduate Research Assistant, Brian Merrifield. Additionally, the Fire ProtectionResearch Foundation provided input and direction for the project. WPI routinely publishes thesereports on its web site without editorial or peer review.
AbstractThe current occupant load factor of 100ft2/person, as specified by NFPA 101, Life Safety Code,and NFPA 5000, Building Construction and Safety Code, for business uses has been in effectsince the 1930’s. Business use areas, specifically office environments, have changed since thattime, and questions have arisen regarding the appropriateness of the 100ft2/person factor for alltypes of business use areas. This study investigates the origins of the 100ft2/person factor,previous occupant load studies, changes in office space planning and use, availability of officefurnishings, and current office occupant load preferences, then recommends alternate occupantload factors and business use categories.2 P a g e
Table of ContentsAbstract . 2Table of Contents . 31. Executive Summary . 52. Background . 73. Methodology . 84. First Appearance of the Occupant Load Factor . 105. Variation of the Occupant Load Calculations . 126. Evolution of the Office Space . 167. Typical Office Furniture . 208. Review of Previous Occupant Load Studies and Planning Guides . 238.1. 1935: . 238.2. 1960-1990: . 248.3. 1990-2010: . 288.4. 2010-2012. 379. Future Trends of Office Space Design. 4310. Business use categories . 4711. Questionnaires. 5211.1. Architects . 5211.2. Real estate contacts . 5411.3. Building owners . 5512. Other References . 5713. Conclusion . 6114. Recommendation . 63Bibliography . 64Acknowledgements . 67Appendix A: 1922 Committee on Safety to Life Proceedings . 68Appendix B: 1924 Committee on Safety to Life Proceedings. 69Appendix C: Other References . 823 P a g e
Table of FiguresFigure 1 “Taylorism” Office Layout. 16Figure 2 “Open Office” Layout . 17Figure 3 Year 1960’s Office Organization Diagram . 17Figure 4 Year 1985 Action Office Cubicles . 18Figure 5 Open Office Low Partitions. 19Figure 6 Typical Modular Office Furniture . 20Figure 7 Typical Pinwheel desks . 21Figure 8 Typical Executive Furniture . 22Figure 9 Occupant Load Factors from BOMA Surveys . 27Figure 10 Averages from previous studies and planning guides of the Occupant load factor(ft2/person) over time (years) . 41Figure 11 Questionnaire sent to architects . 53Figure 12 Questionnaire sent to real estate people . 54Figure 13 Questionnaire sent to building owners/managers . 55Figure 14 Other references: Private Offices vs. Time . 57Figure 15 Other references: Open Plan Spaces with Seats vs. Time . 58Figure 16 Other references: Open Plan Spaces without Seats vs. Time . 59Figure 17 Other references: Public Spaces vs. Time . 59Figure 18 Other references: Laboratory Spaces vs. Time. 604 P a g e
1. Executive SummaryEffectively determining the number of people that can occupy a building is a critical designconsideration. The proposed occupant load directly impacts the safety of building occupants,and affects other building features such as the means of egress, permitted construction types,required fire protection systems, etc.Building and fire regulations such as NFPA 101 specify occupant load densities (load factors),based upon the intended use of the space, that architects, designers and engineers must apply indetermining the number of people expected within the building. The current occupant loadfactor of 100ft2/person of floor area for business operations has remained unchanged since the1930’s, and is based upon traditional office layouts and functions at that time. However,questions have been raised concerning the appropriateness of the current business use occupantload factor for some types of contemporary business operations.In determining the appropriateness of the current 100ft2/person occupant load factor for businessuses, this study investigated the historical basis for the 100ft2/person load factor; examinedchanges in office space function, planning, layout and furnishings; analyzed available data onoffice space occupant load trends; and conducted a questionnaire of architects, building ownersand managers and real estate agents to obtain current data.This research project recommends i) an increase in the value of the occupant load factor forgeneral business use in the Life Safety Code from 100 ft2/person to 150ft2/person, and ii) a newcategory of business use in the form of high density business use spaces, such as call centers,with an occupant load factor of 100 ft2/person with an advisory note suggesting that types offurnishings proposed for the space need to be prudently considered as work stations as small as25 ft2 in size are available.5 P a g e
6 P a g e
2. BackgroundThe need to evaluate the validity of the current occupant load factor of 100ft2/person for a varietyof business use areas became apparent during the code revision cycle for the 2012 edition ofNFPA’s Life Safety Code, NFPA 101. During their 2011 Report on Proposals (ROP)1 meeting,the Technical Committee (TC) on Mercantile and Business Occupancies voted to change theoccupant load from the current 100ft2/person to 150ft2/person, for all business occupancies. Attheir 2011 Report on Comments (ROC) meeting2, the TC voted to change the occupant load backto 100ft2/person based upon several comments that were received and the committee's need to bepresented with more documentation and justification. The committee was in agreement that thisis an issue they need to address in the future, but that they did not possess sufficient justificationto support a change for the 2012 edition of the rtonComments2011)7 P a g e
3. MethodologyFor parts of this project, the project team comprised of 3 undergraduate WPI student members:Thomas Carlyle Thackeray, Tyler William and Tudor Muha. The project represented theirInteractive Qualifying Project (IQP), required by their curriculum. During the later and finalstages of the project, the project team consisted of Tudor Muha and Brian Merrifield, a graduatestudent research assistant in WPI’s Department of Fire Protection Engineering. The projectadvisor was Professor of Practice, Milosh Puchovsky, from the Department of Fire ProtectionEngineering. A Project Technical Panel from the Fire Protection Research Foundation (FPRF)also provided input and direction to the project team. Members of the Panel included: Amanda Kimball, FPRF Ken Bush, Maryland State Fire Marshal’s Office Kristin Collette, National Fire Protection Association Josh Elvove, General Services Administration Dave Frable, General Services Administration Nancy Hurley, National Fire Protection Association Erica Kuligowski, National Institute of Standards & Technology Dan O’Connor, Aon Fire Protection Engineering Corp. John Tello, Boston PropertiesThe project started on August 23rd 2011, and the following tasks were proposed for completion: Origin and first appearance of the occupant load factor Investigate the evolution of the occupant load factor Identify trends for the design of business office space8 P a g e
Determine the validity of using only one category for business occupancy use, byconducting questionnaires Conclude by stating the validity of the value of 100ft2/person for the business occupantload factor Recommend changes to be made to the Life Safety CodeThe following methods were used to successfully complete the steps presented above:1) Literature research investigating:a) Previous editions of the Life Safety Codeb) Previous studies analyzing the design and use of office spacec) General guidelines of institutions concerning the design of office spaced) Office space planning guides2) Gathering data using questionnaires sent to the following groups of people:a) Architectsb) Real estate peoplec) Building owners/managersThe paper is organized following the methodology presented above.9 P a g e
4. First Appearance of the Occupant Load FactorIn 1922 Committee on Safety to Life Proceedings3, an interest was shown to establish an exitscode for office buildings. The committee said that it was “logical after the factory anddepartment store codes already approved in 1918 and 1921 respectively”. However there weresome problems with establishing the exits code for office buildings. The first problem, the onlyone on which we will focus, was not having sufficient data regarding “the maximum populationof a building at any one time”. In other words the first thing that they needed to know, was howmany square feet of office space was allocated per person. To do this they stated that the bestmethod was to count all persons in and out the buildings. By recording the difference betweenthe two values at frequent intervals, they could assess the number of people that were actually inthe building at that time. They did this for twelve office buildings in Philadelphia, “including allthe largest and several representative older and moderate sized structures” and in New Yorkwhere “the fire department made counts of the number of persons in several representativebuildings during business hours.” 4The committee concluded that although it did not have sufficient data to justify an exact valuefor the occupant load factor for business occupancy, they recommend the value of 922)(NFPA,ExitsCodeforOfficeBuildings1922)10 P a g e
The following is the passage from the 1922 Proceedings5 of the Committee on Safety to Lifesaying exactly that (Appendix A: 1922 Committee on Safety to Life Proceedings):“While the committee has not yet sufficient data to justify any finalconclusion, it believes tentatively that it will be wise to figure 100sq. ft. of gross area per person as the basis upon which staircapacity shall be established. The gross area rather than rentablearea has been selected as a basis, because rentable area may varyfrom time to time and, because generally speaking there is a fairlyconstant ratio between gross and rentable area.”In the study conducted in 1996 by James A. Milke and Tony Caro6 of the Department of FireProtection Engineering from the University of Maryland, it was stated that the occupant loadfactor first appeared in the Building Exits Code in the 3rd edition published in 1934. While thatwas the first time the 100ft2/person was in the Building Codes, as seen in the previous paragraph,this was not the first time the committee had reported on this topic, nor was the requirementsimply based off preliminary information taken from the NBS study7 conducted that same 1996)7(Courtney1935)611 P a g e
5. Variation of the Occupant Load CalculationsThe next mention of business occupant load was found in the 1924 Proceedings Report8 of theCommittee on Safety to Life, where they explain the use of an equation to calculate the numberof people permitted on each floor based off the stair width, building construction, protection ofvertical openings, sprinkler protection, horizontal exits, occupancy and number of exits:“The number of persons allowed on each floor (except groundfloors, which are treated separately) is in general determined bythe formula given which it will be noted varies the relationbetween the population and the exits in accordance with theoccupancy, character of construction, protection and various otherfeatures which have bearing on life safety.”This is important to mention, in order to have a more accurate evolution and especially the use ofthe occupant load factor. As this case presents, the occupant load factor was used in a differentway from how it is used today. This equation is far different from how occupancy is calculatednow since it essentially calculated in reverse order compared to today’s code. Present day designstarts with an architect and owner deciding how large they want their building to be. Theoccupant load factor is then used to find out how many people can fit in said area, and then thelife safety and egress requirements are based off the total occupant load. This equationessentially states that given that you already chose your floor area, AND that you already choseall your egress features (sprinklers, stair widths, number of stairs, etc.), how many people canyou fit in the given pre-design building. As a result, the equation inherently increases the8(NFPA,ExitsCodeforOfficeBuildings1924)12 P a g e
occupant load if: the stairs are wider, fire resistive construction is used, vertical openings areprotected, protected by sprinklers, there are multiple horizontal exits, it is a low hazardoccupancy, and the closer it is to the ground floor.Here, we are given the equation (see Appendix B: 1924 ):N A B C D E FHWhere:N No. of persons permitted on each floor above the firstA No. of units of stair width (One unit 22 inches)B – Building ConstructionOrdinary . . B 4Mill or Fire Resistive . . B 5C – Protection of Vertical OpeningsOpen Stairs C 2Enclosed Stairs (other vertical openings not protected).C 3Enclosed Stairs (All vertical openings protected) . C 4D – Automatic Sprinkler ProtectionUnsprinklered .D 1Sprinklered . D 2E – Horizontal ExitsNone . E 2One . . E 3Two . . E 4F – Occupancy13 P a g e
Low Hazard. . F 3Moderate Hazard . . F 2High Hazard. . . F 1H Number of StoriesBasement. . H 3Sub-Basement . . H 5A quick reference table was created in the 1924 Proceedings9 giving the results of this equationin number of persons per floor, per unit of stair width. After the equation for the upper floors, weare given the following formula for the street or ground floor exits:N 60 A FWhere:N Maximum number of persons on street of ground floorA No. of units of doorway widthF – Occupancy (Business use considered Low Hazard)Low Hazard. . F 3Moderate Hazard . . F 2High Hazard . . . F 1The proceedings remained with that function method until 1934 when the Committee on Safetyto Life incorporated it into Section 2013A of the Building Exits Code. Table 1 tracks theprogression of the 100ft2/person requirement throughout the various code changes without anychange to the value arguably since 1922 when the committee first released its counts of roughly adozen representative business 4 P a g e
History of Occupant Load Changes in NFPA CodesStatus relevant top-down (i.e. newest version is true until the year below it)Year:2012Code Update:Table 7.3.1.2 states “Occupant Load” as 100ft2/person for a business occupancy- Section 38.1.7 and 39.1.7 reference Table 7.3.1.2 but states “or shall be determinedas the maximum probable population of the space under consideration, whichever isgreater”.2006Still 100ft2/person but subdivision of Air Traffic Control Towers (40 sq. ft. perperson) added.1997Table 7.3.1.2 does not exist in this edition but 100ft2/person requirement still statedunder business occupancy Section 26 – 1.71976100ft2/person requirement in Chapter 13 – 1.4.11973100ft2/person requirement in Chapter 13 – 13.111970100ft2/person “Office Occupancy” requirement in Chapter 13 – 11.311963100ft2/person requirement in Section 11: Table 11021942100ft2/person requirement in Section 2013A1934First recorded 100ft2/person requirement in Section 2013A1929No separate business section found. No 100ft2/person requirements found.Table 1 History of Occupant Load Factor changes in the NFPA codesHaving clarified the origin and history of the occupant load factor, the evolution of office spaceis key to understanding whether the occupant load factor for 1922 design is still relevant to thebusiness office design in modern day business occupancies.15 P a g e
6. Evolution of the Office SpaceThe history of office design typically begins in 1904 with an American Engineer named FredrickTaylor. In an effort to make his business more efficient, he often put workers in the center of theroom in very organized rows, then assigned one specific job to each person (similar to anassembly line on a factory floor). This style of office layout is referred to as “Taylorism” asshown in Figure 1. Typical businesses such as mail-order forms, insurance companies,government agencies, clerks, typists, engineers, and other repetitive work types utilized thismethod to save time and money10. Using a top-down approach, the workers were often closelysupervised by managers on the perimeter of the building from their offices.Figure 1 “Taylorism” Office Layout11The next and probably greatest change in regards to office design came around 1960, when astyle named “Bürolandschaft”12 or “Office Landscape” was brought from Germany to NorthAmerica emphasizing an “open office” layout as shown in Figure 2, where the desks umn.d.)12(Kuangn.d.)1116 P a g e
grouped based on function (Figure 3) (i.e. side by side for clerks whereas a pinwheelarrangement for designers). Hierarchy was less important in this style which increasedcommunication between members of a group.Figure 2 “Open Office” Layout13Figure 3 Year 1960’s Office Organization hnArchitectsn.d.)1417 P a g e
While still considered “open office”, starting in 1968 and culminating around 1980 the rise anddomination of modular furniture with fixed partitions around employee’s desks occurred similarto Figure 4, more commonly known as the cubicle.15 First introduced by Robert Propst andHerman Miller in 1964, the main benefits of the cubicle were that it prevented workers fromgetting distracted, and it gave each worker more privacy and room for personalization. It waslater viewed as a way to give a middle ranked worker an “office” before gaining an official outeroffice space.Figure 4 Year 1985 Action Office Cubicles16In an attempt to break free from the sea of cubicles, office furniture manufacturers and designersaround the year 2000 began to minimize the cubicle partition heights to promote collaborationbetween workers and to maximize the natural light usage further into the building. Supervisorfixed offices began to move away from the outer perimeter to allow for more natural light andgive a more open atmosphere.15(Schlosser2006)(Schlosser2006)1618 P a g e
The open office concept remains the key design method of present day offices where thepartition height remains low (if any partition at all), and focus is on sustainability and open sightlines within the office (Figure 5). Office layout is dictated mostly by function with variousconcentrated sections throughout based on the type of business. For example in design firmswhere collaboration and teamwork concepts are encouraged, desks are loosely grouped together,often divided into teams and without partitions. On the other hand, where independent work isthe key focus, smaller, partitioned off, and often squared off (cubicle style) layouts are preferredto maximize floor area and productivity.Figure 5 Open Office Low Partitions1717(Schlosser2006)19 P a g e
7. Typical Office FurnitureIn modern day office design for new businesses, architects and interior designers have access to awide variety of furniture materials, shapes, and styles to specifically match the goals andfunctions required by each company.There are a few categories of office furniture that most designs can be broken into. Typically fordenser packed occupancies, cubicle style modular furniture, which usually consists of squaredoff partitioned sections (both low and high partitions) similar to Figure 6 below are used to giveeach worker enough space to be efficient, but still keep the area per person smaller. Thesetypically come in a variety of sizes according to the business needs. For the carrel type desks onthe left of Figure 6, typical widths and depths range from 36”, 48”, to 60” per person.18 Thetypical cubicle on the right used to always be a 9’ x 9’, but now are becoming smaller into 8’ x8’, 7.5’ x 7.5’, 6.5’ x 6.5’, 5’ x 6’ cubicles and every dimension down to 2x’3’ fortelemarketing.19Figure 6 Typical Modular Office Furniture2018(EverythingOfficeFurniture ,CubicleSystems- ‐RizePanelSystemwithPrivacyStations- niture ,CubicleSystems- ‐RizePanelSystemwithPrivacyStations- ‐OFM2012),(Cubicle.comn.d.)1920 P a g e
Another type of furniture available to designers is if they plan to have more of a spread outdesign or group divided layout to the office where teams can use low partition desks joinedtogether in smaller groups to facilitate open communication (Figure 7). Often times this style isin a “pinwheel” or X-shaped design that may be more free-flowing rather than ridged 90 degreeangles. It can be created in a wide variety in sizes depending on the client’s needs.Figure 7 Typical Pinwheel desks21And lastly we have the style of furniture executives of managers would have in their solid walloffices which is usually consists of multiple larger and more spread out furniture pieces,sometimes one larger work area, other times multiple pieces (Figure 8). While these areas are nottypically all throughout the office, they are still taken into account in the area per personcalculation. The size of the desks themselves are surprising close to the size of a cubicle, but it’sthe area around the desk for seating and additional furniture/meeting tables, etc. that willtypically increase the area per person calculations. Two typical style executive desks are shownbelow with the dimensions of 6’x 8.5’ for the U-shaped desk on the left, and 6’ x 8.5’ for theseparated htChoiceForYou2011),(Project2010)21 P a g e
Figure 8 Typical Executive Furniture22The purpose of looking at office furniture in respect to occupancy load is simply that if amanufacturer is making a 24” x 36” cubical, there are likely businesses that are currently usingthem and therefore have only a 6ft2 of desk space for each worker. While in some types ofbusinesses, this may be counterbalanced with a larger amenity areas for employees (i.e. breakrooms, lounges, group meeting rooms, etc.) this may not be true for all businesses with highdensity seating arrangements and therefore strongly must be taken into consideration.22(EverythingOfficeFurniture 2012)22 P a g e
8. Review of Previous Occupant Load Studies and Planning GuidesIn this section we will present the evolution of office space and implicitly the space assigned perworker in an office. We will do this by analyzing previous conducted studies, surveys, generalplanning guides as well as specific guidelines. The time intervals considered will be 1935, 19601990, 1990-2010, and 2010-2012. These intervals were picked depending mainly on the shifts inoffice design and use as well as material found to reflect these eras.8.1. 1935:The study representative for this time was the study conducted by Courtney J., Houghton H.,Thompson G., in 193523 “Design and Construction of Building Exits”. The study involvedanalyzing the design and construction of building exits in buildings of various occupancy types.The population on typical floors for the office buildings was determined by actual counts ofbuilding occupants. In their study, building walk-throughs were conducted to count the numberof building occupants in factories and schools, in addition to the offices.24A total of 22 office buildings were surveyed (Table 2) in Atlanta, GA, Greenville, SC,Greensboro, NC, Roanoke, VA, Washington, DC, Frederick and Baltimore, MD, and tney1935)2423 P a g e
BuildingNumberNumber ofstoriesFloor AllAllAllAllFloor Area(ft2)Populationon 01,594,37018,302Table 2 Office Building Measurements by Courtney, et al.264567910111213141718TotalGross 87.1The study found that the average load factor in the buildings surveyed ranged from 66 to160ft2/person, the average being 87.2ft2/person (Table 3).Year1935Name and Type of Reference(study, planning guideDesign and Construction ofBuilding Exits (study)Author(s)Courtney J.,Houghton H.,Thompson G.,Table 3 Summary of references from 1935Value of occupant loadfactor (ft2/person)87.28.2. 1960-1990:1969, Nelson investigated the space utilization in federal government office buildings27. Hecollected space planning data from federal office buildings located in Philadelphia, PA oldE.,toJ.H.McGuir
Thomas Carlyle Thackeray, Tyler William and Tudor Muha. The project represented their Interactive Qualifying Project (IQP), required by their curriculum. During the later and final stages of the project, the project team consisted of Tudor Muha and Brian Merrifield, a graduate student research assistant in WPI's Department of Fire Protection .