Transcription
24 February 2022Processing plant, QuellavecoAnglo American
Introductory commentsStuart ChambersChairmanAnglo American2
Cautionary statementDisclaimer: This presentation has been prepared by Anglo American plc (“Anglo American”) and comprisesthe written materials/slides for a presentation concerning Anglo American. By attending this presentationand/or reviewing the slides you agree to be bound by the following conditions. The release, presentation,publication or distribution of this document, in whole or in part, in certain jurisdictions may be restricted by lawor regulation and persons into whose possession this document comes should inform themselves about, andobserve, any such restrictions.and undue reliance should not be placed on forward-looking statements. These forward-looking statements speak only as ofthe date of this presentation. Anglo American expressly disclaims any obligation or undertaking (except as required byapplicable law, the City Code on Takeovers and Mergers, the UK Listing Rules, the Disclosure and Transparency Rules of theFinancial Conduct Authority, the Listings Requirements of the securities exchange of the JSE Limited in South Africa, the SIXSwiss Exchange, the Botswana Stock Exchange and the Namibian Stock Exchange and any other applicable regulations) torelease publicly any updates or revisions to any forward-looking statement contained herein to reflect any change in AngloAmerican’s expectations with regard thereto or any change in events, conditions or circumstances on which any such statementis based.This presentation is for information purposes only and does not constitute, nor is to be construed as, an offer tosell or the recommendation, solicitation, inducement or offer to buy, subscribe for or sell shares in AngloAmerican or any other securities by Anglo American or any other party. Further, it should not be treated asgiving investment, legal, accounting, regulatory, taxation or other advice and has no regard to the specificinvestment or other objectives, financial situation or particular needs of any recipient.Nothing in this presentation should be interpreted to mean that future earnings per share of Anglo American will necessarilymatch or exceed its historical published earnings per share. Certain statistical and other information about Anglo Americanincluded in this presentation is sourced from publicly available third party sources. As such it has not been independentlyverified and presents the views of those third parties, but may not necessarily correspond to the views held by Anglo Americanand Anglo American expressly disclaims any responsibility for, or liability in respect of, such information.No representation or warranty, either express or implied, is provided, nor is any duty of care, responsibility orliability assumed, in each case in relation to the accuracy, completeness or reliability of the informationcontained herein. None of Anglo American or each of its affiliates, advisors or representatives shall have anyliability whatsoever (in negligence or otherwise) for any loss howsoever arising from any use of this material orotherwise arising in connection with this material.Forward-looking statements and third party informationThis presentation includes forward-looking statements. All statements other than statements of historical facts included in thispresentation, including, without limitation, those regarding Anglo American’s financial position, business, acquisition anddivestment strategy, dividend policy, plans and objectives of management for future operations, prospects and projects(including development plans and objectives relating to Anglo American’s products, production forecasts and Ore Reserve andMineral Resource positions) and sustainability performance-related (including environmental, social and governance) goals,ambitions, targets, visions, milestones and aspirations, are forward-looking statements. By their nature, such forward-lookingstatements involve known and unknown risks, uncertainties and other factors which may cause the actual results, performanceor achievements of Anglo American or industry results to be materially different from any future results, performance orachievements expressed or implied by such forward-looking statements.Such forward-looking statements are based on numerous assumptions regarding Anglo American’s present and futurebusiness strategies and the environment in which Anglo American will operate in the future. Important factors that could causeAnglo American’s actual results, performance or achievements to differ materially from those in the forward-looking statementsinclude, among others, levels of actual production during any period, levels of global demand and commodity market prices,mineral resource exploration and project development capabilities and delivery, recovery rates and other operationalcapabilities, safety, health or environmental incidents, the effects of global pandemics and outbreaks of infectious diseases,natural catastrophes or adverse geological conditions, climate change and extreme weather events, the outcome of litigation orregulatory proceedings, the availability of mining and processing equipment, the ability to produce and transport productsprofitably, the availability of transport infrastructure, the development, efficacy and adoption of new technology, the impact offoreign currency exchange rates on market prices and operating costs, the availability of sufficient credit, the effects of inflation,political uncertainty, tensions and disputes, and economic conditions in relevant areas of the world, evolving societal andstakeholder requirements and expectations, the actions of competitors, activities by courts, regulators and governmentalauthorities such as in relation to permitting or forcing closure of mines and ceasing of operations or maintenance of AngloAmerican’s assets and changes in taxation or safety, health, environmental or other types of regulation in the countries whereAnglo American operates, conflicts over land and resource ownership rights and such other risk factors identified in AngloAmerican’s most recent Annual Report. Forward-looking statements should, therefore, be construed in light of such risk factorsAnglo AmericanGroup terminologyIn this presentation, references to “Anglo American”, the “Anglo American Group”, the “Group”, “we”, “us”, and “our” are to refer toeither Anglo American plc and its subsidiaries and/or those who work for them generally, or where it is not necessary to refer to aparticular entity, entities or persons. The use of those generic terms herein is for convenience only, and is in no way indicative ofhow the Anglo American Group or any entity within it is structured, managed or controlled. Anglo American subsidiaries, andtheir management, are responsible for their own day-to-day operations, including but not limited to securing and maintaining allrelevant licences and permits, operational adaptation and implementation of Group policies, management, training and anyapplicable local grievance mechanisms. Anglo American produces group-wide policies and procedures to ensure best uniformpractices and standardisation across the Anglo American Group but is not responsible for the day to day implementation ofsuch policies. Such policies and procedures constitute prescribed minimum standards only. Group operating subsidiaries areresponsible for adapting those policies and procedures to reflect local conditions where appropriate, and for implementation,oversight and monitoring within their specific businesses.No Investment AdviceThis presentation has been prepared without reference to your particular investment objectives, financial situation, taxationposition and particular needs. It is important that you view this presentation in its entirety. If you are in any doubt in relation tothese matters, you should consult your stockbroker, bank manager, solicitor, accountant, taxation adviser or other independentfinancial adviser (where applicable, as authorised under the Financial Services and Markets Act 2000 in the UK, or in SouthAfrica, under the Financial Advisory and Intermediary Services Act 37 of 2002 or under any other applicable legislation).Alternative Performance MeasuresThroughout this presentation a range of financial and non-financial measures are used to assess our performance, including anumber of financial measures that are not defined or specified under IFRS (International Financial Reporting Standards), whichare termed ‘Alternative Performance Measures’ (APMs). Management uses these measures to monitor the Group’s financialperformance alongside IFRS measures to improve the comparability of information between reporting periods and businessunits. These APMs should be considered in addition to, and not as a substitute for, or as superior to, measures of financialperformance, financial position or cash flows reported in accordance with IFRS. APMs are not uniformly defined by allcompanies, including those in the Group’s industry. Accordingly, it may not be comparable with similarly titled measures anddisclosures by other companies.3
2021 results agenda2021 overview and look aheadMark CutifaniThe numbersStephen PearcePositioned for a sustainable futureMark CutifaniAnglo American4
‘WeCare’ approach: Covid & resilienceResponsible & holistic approachprotecting lives & livelihoods in our workforce & communitiesRobust operating protocols & controlsRigorous testing approachMental health & gender-based violence supportSuccessful vaccine program deliveredAnglo American5
SHE performance – drive for a safe & healthy futureSafetyGroup TRCFR1,2Fatalities1HealthEnvironmentOccupational health – new cases1,3Level 3 & above significant 2018420192.14H1: 2.33392.2430H2: 2018111201920202021Elimination of Fatalities TaskforceElimination of hazards at sourceUpgraded planning & controls driving our improvement journey key focus for sustainable improvementCovid and managing its impactRecord low exposuresESG factors being integrated in asset plans re-established downward trend in H2Anglo American upgraded work environments & controls supports continuous improvements support effective social engagement6
Driving a healthy environment & thriving communitiesEnergyGHG emissionsSocial Way CompliancemGJCO2 equivalent emissionsSocial Way 1%96%Social Way 3.0standards farexceed SocialWay 1201720182019Social Way 2.020202021Social Way 3.0Increase from 2020 reflects increasedBrazil, Chile and Peru - 100% renewablemains electricity supply secured from 2022job on the mine by 2030Operating efficiency, technology &innovation drive longer term improvementsDeveloping our hydrogen strategy, usingSchools in host communities to performproduction & Quellaveco construction ramp upAnglo Americanrenewable energy sourcesTargeting 5 jobs in the community for everywithin the top 20% of state schools nationally7
FY 2021 resultsProduction65%Unit cost, FX neutral910%EBITDA7Mining EBITDA margin8 20.6bn56%EPS7ROCE10 7.22/sh43%Up 16% including FXAnglo American8
2021 – solid operating performanceDiamondsBase Metals11Ongoing demand recoverySolid Copper performanceBusiness transformation accelerated2021 water challenges mitigatedSolid unit cost performanceStable Nickel performancePGMsAnglo AmericanBulks12Significantly improved productionRobust Iron Ore performanceRecord processing performanceGrosvenor restarted13WIP at more normal levelsAquila online on schedule & budget9
Our improvement journeyPortfolio restructuringP101 cost & volumeTechnical reconfigurationIncremental growth & debottleneckingOperating Model & processesNew projectsMining EBITDA margin8Margin based on longterm consensuscommodity prices (whichare 36% lower than the2021 basket price)56%45-50%35%2013Anglo American20212023F10
Significant improvement in our cost curve positionAverage margin adjusted cost curve14 position over time-20%-21%-8%49%45%43% 3%37% 13%41%39%36%29%27%22%Peer 1Peer 2201314Anglo AmericanPeer 3Peer 42021F11
The numbersStephen PearceAnglo AmericanHong Kong, Central District
FY 2021 resultsEBITDA7EPS7Net debt 20.6bn 7.22/sh 3.8 bnUnit cost, FX neutral910%Up 16% including FXAnglo AmericanShareholder returns15Free cash flow16 6.2bn 9.6bnOrdinary & special dividendsand buyback13
Strong margins drive record EBITDADiamondsBase Metals 1.1bn 4.3bn47% mining EBITDA margin860% mining EBITDA margin812 20.6bn17Anglo AmericanPGMsBulks 7.1bn 8.1bn62% mining EBITDA margin855% mining EBITDA margin81314
Prices, operational recovery/improvement drive earningsEBITDA7 bn(1.5)10.20.90.3(0.2)1.120.619.61089.82020Anglo AmericanPrice18Currency& CPI19CovidrecoveryACPrecoveryCost &volume20Other202115
Cyclical inflationary headwinds driven by strong prices2021 unit cost performance92022 unit cost outlookProducer country FX headwinds6%3%4%Inflation & input costs expectedto increase in 202216%(4%)2%Partly offset by higher expectedvolumes10%5%CPIAnglo AmericanInput costsVolumes MaintenanceOther212021 FXneutralFX202116
Capex recovering post initial Covid impactCapex22 bn5.22021 higher due to partial recovery fromCovid delays / supply chain disruptions4.1Growth1.8Growth capex includes 0.8bn forQuellaveco & 0.5bn for Woodsmith1.52.23.4Sustaining2.62022 capex to increase by 0.9-1.4bndue to Covid rollover & higher sustainingspendInflation & FX impacts likely in 20222020Anglo American202117
Strong cash generation drives robust balance sheetNet debt bn 1.7bn reduction in net debt5.51.13.82.4PGM prices & customerprepayment result in workingcapital reductionRobust cash generation acrossall business units(1.8)Supporting disciplined,value-adding growth202023Anglo AmericanWorkingcapitalCashgenerationGrowth capex22202110% gearing18
Healthy dividend pay-out with additional returns499 c/sh50 c/sh 0.6 bn H2 special dividend80 c/sh 1.0 bnBuyback80 c/sh 1.0 bnH1 special dividend 0.6bnSpecial dividend announced for H2 2021leading to 69%Total payout ratio in 2021289 c/sh 3.6bnBase dividend1540% of underlying earningsThungelaIn-specie capital return: 250% increase in its share price2021Anglo American19
Transparent taxes & royalties in host countries builds trust 7.1 bnUK 0.4bnTaxes and royalties24Paid in host countryBrazil 0.5bnChile 1.0bnAnglo AmericanOther Africa 0.7bnAustralia/Asia 0.4bn89%24 increase from 2020South Africa 4.0bn20
Balanced capital allocation framework2021 allocation of capitalSustaining attributable free cash flow162021 dividend at 40% of underlying earnings15Growth capex22 ( 1.8bn) &additional shareholder returns ( 2.6bn15)Anglo American21
Cost and volume improvements on track 3.5-4.5bnUp to 2.0bnProjects: 2022-23QuellavecoMarine Diamonds Namibia2021 deliveryvs 2017Technology & Innovation: 2020-23 Predictive MaintenanceBulk Ore Sorting rolloutUp to 2.5bnCoarse Particle RecoveryOperating Model & P101: 2017-23Copper mine & plant performance 1.4bnMinas-Rio ramp upOperational stabilityDelivered improvement25Anglo American2023 target22
Balanced, disciplined and sustainable approachCash returnsAttractive growth 18 % 12.3bnDividends & buybacks since 201715Resilient balance sheetProduction growth by 20236Capital employed by geography26Other0.2x2021 Net debt:EBITDA7Australia13%23%Chile& Peru9%Botswana 12%& Namibia22%21%BrazilSouth AfricaAnglo American23
Simple conversion ofexisting divider. Looks a bitold fashioned now I thinkcompared to the rest of thefresh, modern stylePositioned for asustainable futureMark CutifaniOdaiba - Tokyo
Driving towards a sustainable futureGreener WorldElectrified WorldMet CoalCu Eq production6Consumer WorldDiamondsTransitionenablingHigh qualityIron OreCopper 85%FutureenablingCropNutrientsNickel &ManganeseAnglo AmericanPGMs25
By 2040 - operations carbon neutral & 50% cut in Scope 3See footnotes 27 & 28Anglo American26
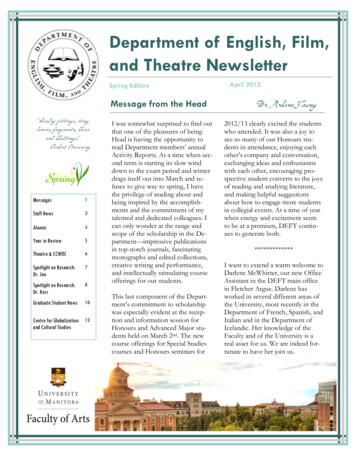
Quellaveco videoPapujune processing plantPlease click here for videoAnglo American27
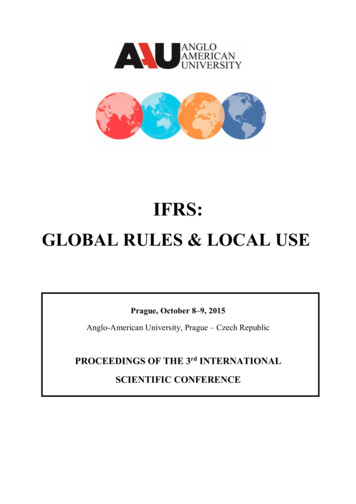
Quellaveco on track for mid 2022 deliveryOperations – Autonomous haul trucksQuellavecoGreenfield copper projectOn track for mid 2022 delivery despite Covid challenges First ore delivered October 2021 Processing plant – Line 1 90% complete, pre-commissioning underway Water dam complete – provider of year round freshwater to communities 100% renewable electricityOn budget: 0.7-0.8bn22 capex to go (our share)FY 2021 capex 0.8bn22(our share)Upcoming 2022 milestones on track Completion of 95km freshwater pipeline Primary crusher commissioning Completion of processing plantAnglo American28
Quellaveco – a world class assetPapujune processing plantGrowth: 10% CuEq growth ( 300ktpa29)Unit costs: since approval, first 5 years’ unit cost down from 96c/lb to 85c/lb (2018 real basis)(nominal: 105c/lb to 95c/lb)Production: 400kt29 of production brought forward –significant value enhancementValue: 4 year payback period; 50% EBITDA marginOre reserves: 18% uplift in contained metal leading to6 years additional LOMGuidanceProduction (kt)C1 unit cost – nominal (c/lb)Capex – growth ( m)our shareAnglo American2022F2023F2024F100-150320-370320-370 12530500-700First 5 year ave: 95 250-29
Portfolio complemented by high value growth options31Moranbah-Grosvenor(Metallurgical Coal) 2025Mogalakwena(PGMs)from 2026Collahuasi Phase 2(Copper) 2028Sakatti(Copper) 2028Woodsmith(Crop Nutrients) TBC 0.3bn capex onwashplantNumber of options beingconsideredNext stage expansion, 100ktpa CuEqRich polymetallic deposit inFinland, 80-100ktpa CuEqMultinutrient, low chloride,low carbon fertiliser 15% IRR, 2.5Mtpasaleable tonnesGood progress in the sixworkstreamsReviewing scale-upoptionsPre-feasibility studies &permittingDetailed engineeringongoingAnglo American30
Value-adding, future-enabling growth 90% growth capex 50 % marginallocated to future-enabling productsprojects focus on high quality, low-cost assetsCu Eq production6 35% 21% 18%Baseline portfolio 2023Met CoalAnglo American32Iron Ore 2025PGMsCopper 20306Crop Nutrients31
Purpose: to re-imagine mining to improve people’s livesEffectivenessEfficiencySustainability 10 %15-20%7Free Cash Flow33ROCE 10(on capital employed)Pillars of Value202131%Anglo American43%Embedded32
Q&AOur investment tiesSustainablereturnsStrong cost positionTechnology-ledEBITDA improvement 3.5-4.5bnLong term growth 35%6Sustainability leaderDisciplined capital allocationTo ask a question, Standard International Dial-in: UK 44 (0) 2071 928338 / SA 0800 014552 / US 1 87787 09135Conference ID: 7117989Anglo American33
cordable incidents. Data relates to subsidiaries and joint operations over which Anglo American hasmanagement control. Since 2018 data for fatalities, TRCFR and environmental metrics excludes resultsfrom De Beers’ joint operations in Namibia and Botswana.Total Recordable Cases Frequency Rate per million hours.New cases of occupational disease.Environmental incidents are classified in terms of a 5-level severity rating. Incidents with medium, highand major impacts, as defined by standard internal definitions, are reported as level 3-5 incidents.In 2020, we launched a new integrated social performance management system (Social Way 3.0) whichhas raised performance expectations and has resulted in continued improvement in our socialperformance. Sites are expected to have implemented the Social Way 3.0 by the end of 2022. Whilesites are assessed annually against all requirements applicable to their context, for consistency duringthe transition period, the metric reflects performance against the Social Way foundational requirements.Copper equivalent production is calculated using long-term consensus parameters. 2021 copperequivalent production is normalised to reflect the demerger of the South Africa thermal coal operations,the sale of our interest in Cerrejón and the closure of the manganese alloy operations. Growth wascalculated in Q4 2021 with reference to a 2021F baseline. Future production levels are indicative andsubject to final approval.Metrics on an underlying basis - before special items and remeasurements adjusted to include theGroup’s attributable share of associates’ and joint ventures’ results.Margin represents the Group’s underlying EBITDA margin for the mining business. It excludes the impactof non-mining activities (eg PGMs purchases of concentrate, sale of non-equity product by De Beers, 3rdparty trading activities performed by Marketing) & at Group level reflects Debswana accountingtreatment as a 50/50 joint operation. Mining margin for De Beers on a stand alone basis is based onproportionate consolidation of mining businesses in De Beers only.Copper equivalent unit costs are shown on nominal terms and calculated as the total USD cost basedivided by copper equivalent production. 2021 copper equivalent unit cost is normalised to reflect thedemerger of the South Africa thermal coal operations, the sale of our interest in Cerrejón and the closureof the manganese alloy operations.Attributable ROCE is defined as attributable underlying EBIT divided by average attributable capitalemployed. It excludes the portion of the return and capital employed attributable to non-controllinginterests in operations where the Group has control but does not hold 100% of the equity.Base metals consists of Copper (Chile and Peru) and Nickel.Bulks excludes thermal coal businesses.Approval received from the Resources Safety and Health Queensland in February 2022.Based on 2021 forecast as of Q4 2021. Source: Wood Mackenzie; AAP; De Beers; CRU; McKinseyMineSpans. Excludes non-AA mined commodities (e.g., zinc, bauxite). Excludes non-mining activities(e.g., petroleum, alumina/aluminium processing, marketing). Incorporates 2014 data for diamonds.Greater improvements than peers for our portfolio of commodities.Of the 3.6bn base dividend in respect of the financial year 2021, 2.1bn was paid during the year as aninterim ordinary dividend and the remainder will be paid in H1 2022. 0.8bn of the 1.0bn 2021 sharebuyback programme had been completed at 31 December 2021. The cumulative amount of 12.3bnsince 2017 includes the full 2021 base dividend of 3.6bn and all additional special dividends and sharebuybacks declared as at February 2022.Sustaining attributable free cash flow is defined as net cash inflows from operating activities net ofAnglo 31.32.33.capital expenditure (sustaining/lifex only), net interest paid, dividends paid to minorities and capitalrepayment of lease obligations.Group EBITDA also includes thermal coal, exploration expenditure and unallocated corporate costs.Price variance calculated as increase/(decrease) in price multiplied by current period sales volume.Inflation variance calculated using CPI on prior period cash operating costs that have been impacteddirectly by inflation.Cost plus volume. Volume: increase/(decrease) in sales volumes multiplied by prior period EBITDAmargin (ie flat unit costs, before CPI). Cost: change in total USD costs, again, before CPI inflation. Forassets with no prior period comparative (eg in ramp up) all EBITDA is included in the volume variance.Net impact of production and sales disruption and recovery due to Covid-19 as well as PGMs ACPrecovery – both excluded and shown separately.Other includes the impact of items such as deferred stripping and stock movements.Cash expenditure on property, plant and equipment including related derivatives, net of proceeds fromdisposal of property, plant and equipment and includes direct funding for capital expenditure from noncontrolling interests. Shown excluding capitalised operating cash flows. Consequently, for Quellaveco,reflects attributable share of capex, see appendix.Opening Net Debt and prior year comparatives have been restated by 0.1bn following an amendmentto the definition of Net Debt to exclude variable vessel leases.Taxes and royalties include all taxes and royalties both borne and collected by the Group. This includescorporate income taxes, withholding taxes, mining taxes royalties, employee taxes and social securitycontributions and other taxes, levies and duties directly incurred by the Group, as well as taxes incurredby other parties (eg customers and employees) but collected and paid by the Group on their behalf.Figures disclosed are based on cash remitted, net of entities consolidated for accounting purposes, plusa proportionate share, based on the percentage shareholding, of joint operations. Taxes borne andcollected by associates and joint ventures are not included. Numbers are rounded and not all countriesare included on the map where not material (eg Canada & Peru) and hence, rounding differences occurto Group total. For 2021, Peru amounted to 22 million.Cumulative 2021 cost & volume improvement in EBITDA is impacted by above-CPI cost inflation of 0.3bn and is included within the total target.Capital employed on an attributable basis.2030 target based on an absolute reduction in GHG emissions across the business vs 2016 baselineadjusted for structural changes. 2020 Energy and GHG (Scope 1 & 2) savings are calculated relative toprojected ‘business as usual’ consumption levels. For more information on carbon neutral targets seeSustainable Performance presentation from 29 October 2021.Targets and guidance as announced on 7 May 2020. For more information on carbon neutral targets seeSustainable Performance presentation from 29 October 2021.100% basis. 300kt average annual production over first ten years. 400kt production brought forward isgross of a 200kt offset from Covid.Based on ramp-up year and production volumes of 100-150kt. 2022 is a ramp-up year and thereforeunit costs range significantly and are highly dependent on production start date, and subject to furtherCovid-19 impacts.Growth options that are not yet approved.The margin reflects the targeted potential margin for our growth and lifex projects.Long-term target for ‘Sustaining attributable free cash flow’/ average attributable capital employed.34
Appendix35Anglo AmericanMogalakwena North Concentrator
Simplified earnings &guidance36Anglo AmericanPapujune Dome at Quellaveco
2021 simplified earnings by BUDe Beers(Diamonds)CopperNickelPGMsIron Ore1Met ge benchmark pricen/a 9,326/t6 18,497/t6n/a 169/t 211/t7Product premium/discount per unitn/an/a (1,455)/tn/a 19/t8 (19)/t9Freight/moisture/provisional pricing per unitn/a 661/t10n/an/a (31)/t11n/a 115/ct12 9,987/t 17,042/t 2,814/oz 13 157/t 192/t14FOB/C1 unit cost 58/ct 2,646/t 8,311/t 868/oz 33/t 105/t14Royalties per unit 3/ct-15 77/t16 136/oz 6/t17 22/tOther costs per unit18 13/ct19 1,084/t20 1,053/t 78/oz21 9/t22 (3)/t23FOB Margin per unit 41/ct 6,257/t 7,601/t 1,732/oz 109/t 68/tMining EBITDA5854,0113205,9616,871Material processing & trading24515--1,138Total EBITDA1,1004,011320Attributable share 85% 77%100% m (unless stated)Sales volume (mined share)Realised FOB PriceOther 4 79% 70%26100%100% 80%See next slide for footnotes and supporting calculations.Anglo American37
2021 simplified earnings by BU - notesPGMs basket priceOwn minedPGMs basketIron Ore realised priceRealisedpriceVolume RevenueTotal iron oreMet Coal blended priceKumbaMarket price VolumeMinas-RioPlatinum 1,088/oz 1,546koz 1,682mMarket price28 169/t 160/t 185/tHCC 226/t10.8MtPalladium 2,432/oz 1,200koz 2,918mFreight (24)/t (21)/t (29)/tPCI 164/t3.3Mt (14)/tWeighted average metallurgical coal 7 211/t14.1MtRhodium 19,517/ozIridium, ruthenium & goldBase metals & other27208koz 4,060mMoisture content29 (7)/t (3)/t488koz 555mLump premium8 10/t 16/t 470mFe premium8 5/t 6/t 3/t 4/t 3/t 5/t 157/t 161/t 150/tTotal revenue 9,685mProduct premiumPGM volume43,442kozRealised FOB priceBasket price (per PGM oz)13 2,814/oz1. Wet basis. Weighted average of Kumba and Minas-Rio.2. Manganese ( 315m), Crop Nutrients ( (41)m), Exploration ( (128)m), unallocated Corporatecosts ( (63)m), Thermal Coal – South Africa ( 101m) and Thermal Coal – Cerrejón ( 87m)).3. Proportionate share of sales volumes (19.2% Botswana, 50% Namibia): 14.4Mct.4. Own mined sales volumes including proportionate share of joint operation volumes. PGMounces are reported on a 5E Au basis.5. Excludes thermal coal sales.6. LME price, c/lb converted to /tonne (2,204.62 lbs/tonne).7. Weighted average of HCC/PCI prices, FOB Aus. See Met Coal blended price table above.8. Kumba: 64.1% Fe content, 69% of volume attracting lump premium; Minas-Rio: 67% Fecontent, pellet feed. Including product premium. See Iron Ore realised price table above.9. Sales volumes 76% HCC, averaging 93% realisation of quoted low vol HCC price.10. Provisional pricing & timing differences on sales.11. Freight and moisture. See Iron Ore realised price table above.12. The realised price for proportionate share (19.2% Debswana, 50% Namibia) excluding the 11%trading margin achieved in 2021.13. Price for basket of own mined product per 5E Au PGM oz. Higher than usual reflecting thestrong realised price for rhodium, particularly in the first half of the year. See PGMs basket pricetable above.14. Realised price adjusted to include Jellinbah. Unit cost is for managed operations only.15. Royalties for Copper Chile are recorded in the income tax expense line, after EBITDA.Anglo American16. In line with prior years, royalties on Nickel, in Brazil, are based on production costs incurred.17. Weighted average. Kumba: 7/t; Minas-Rio: 5/t.18. Includes market development & strategic projects, exploration & evaluation costs, restoration &re
Group terminology. In this presentation, references to "Anglo American", the "Anglo American Group", the "Group", "we", "us", and "our" are to refer to either Anglo American plc and its subsidiaries and/or those who work for them generally, or where it is not necessary to refer to a particular entity, entities or persons.