Transcription
MainStay CBRE Real Estate FundMessage from the President and Annual ReportApril 30, 2022Sign up for e-delivery of your shareholder reports. For full details on e-delivery, including who can participate and what you can receive via e-delivery,please log in to newyorklifeinvestments.com/accounts.Not FDIC/NCUA InsuredNot a DepositMay Lose ValueNo Bank GuaranteeNot Insured by Any Government Agency
This page intentionally left blank
Message from the PresidentThe 12-month reporting period ended April 30, 2022, started on agenerally positive note. Despite a new wave of COVID-19infections that disrupted life and commerce, financial marketswere buoyed during the spring and summer of 2021 by economicrecovery and the widespread availability of vaccines. Most globaleconomies expanded, exceeding pre-pandemic levels, asbusinesses reopened and supportive government policies borefruit. As the period progressed, however, inflation began to creepup in response to government stimulus and accommodativemonetary policies. Rising prices were further aggravated by wageincreases, pandemic-related supply-chain bottlenecks andcommodity price spikes. Bond prices slid as interest rates rose,and equity markets faltered. Market sentiment turned increasinglynegative in the first quarter of 2022 as aggressive Russianrhetoric regarding Ukraine culminated in Russia’s invasion of itsneighbor – a development that exacerbated global inflationarypressures while increasing investor uncertainty. Domestic supplyshortages, international trade imbalances and rising inflationcaused U.S. GDP (gross domestic product) to contract for the firsttime since the height of the pandemic, although consumerspending, a primary driver of U.S. economic growth, remainedstrong. Prices for petroleum surged to multi-year highs, whilemany key agricultural chemicals and industrial metals reachedrecord territory.Despite the market decline that greeted the first four months of2022, the S&P 500 Index, a widely regarded benchmark ofmarket performance, remained in modestly positive territory forthe 12-month reporting period. Some market sectors benefitedfrom the prevailing conditions, with energy stocks soaring andvalue-oriented shares broadly gaining ground. In addition toenergy, leading sectors included utilities and consumer staples.On the other hand, the information technology, financials andconsumer discretionary sectors were subject to particularly sharplosses. Small- and mid-cap stocks underperformed, as they oftendo during times of heightened uncertainty and financial stress.International stocks trended lower, with some emerging markets,including Russia and China, suffering particularly steep losses,while others, such as India and Indonesia, gained ground.Fixed-income markets saw most bond prices fall as central bankscontemplated significant interest rate rises to combathigher-than-previously-expected inflation rates late in thereporting period. However, floating-rate instruments, which featurevariable interest rates that allow investors to benefit from a risingrate environment, bucked the downward trend.Today, despite the continuing impact of COVID-19, most of theworld appears intent on a return to post-pandemic normalcy.Instead, the focus of global political and economic attention hasincreasingly turned to the war in Ukraine and the impact of risinginflation. Together, Russia and Ukraine account for a substantialshare of the world’s supply of food, fossil fuels and raw materialsproduction. Accordingly, the timing and outcome of this conflictwill undoubtedly play a major role in global economicdevelopments over the coming months and, possibly, years. Theactions of central banks, as they raise rates to fight inflation whiletrying to limit the risks of recession, are likely to further affectglobal markets and economies.As a MainStay investor, you can depend on us to carefully watchdevelopments that may affect your Fund, taking considered andappropriate action to help you stay on financial track in the midstof uncertain times. As always, we remain dedicated to providingyou with the disciplined investment tools you have come to expectfrom us over the years. Thank you for continuing to place yourtrust in our team.Sincerely,Kirk C. LehneisPresidentThe opinions expressed are as of the date of this report and are subject to change. There is no guarantee that any forecast made will come to pass. This material does notconstitute investment advice and is not intended as an endorsement of any specific investment. Past performance is no guarantee of future results.Not part of the Annual Report
Table of ContentsAnnual ReportInvestment and Performance Comparison5Portfolio Management Discussion and Analysis9Portfolio of Investments10Financial Statements12Notes to Financial Statements21Report of Independent Registered Public Accounting Firm29Board Consideration and Approval of Management Agreement andSubadvisory Agreement30Discussion of the Operation and Effectiveness of the Fund'sLiquidity Risk Management Program35Federal Income Tax Information36Proxy Voting Policies and Procedures and Proxy Voting Record36Shareholder Reports and Quarterly Portfolio Disclosure36Board of Trustees and Officers37Investors should refer to the Fund’s Summary Prospectus and/or Prospectus and consider the Fund’s investment objectives, strategies,risks, charges and expenses carefully before investing. The Summary Prospectus and/or Prospectus contain this and other informationabout the Fund. You may obtain copies of the Fund’s Summary Prospectus, Prospectus and Statement of Additional Information, whichincludes information about MainStay Funds Trust's Trustees, free of charge, upon request, by calling toll-free 800-624-6782, by writingto NYLIFE Distributors LLC, Attn: MainStay Marketing Department, 30 Hudson Street, Jersey City, NJ 07302 or by sending an e-mail toMainStayShareholderServices@nylim.com. These documents are also available via the MainStay Funds’ website atnewyorklifeinvestments.com. Please read the Fund’s Summary Prospectus and/or Prospectus carefully before investing.
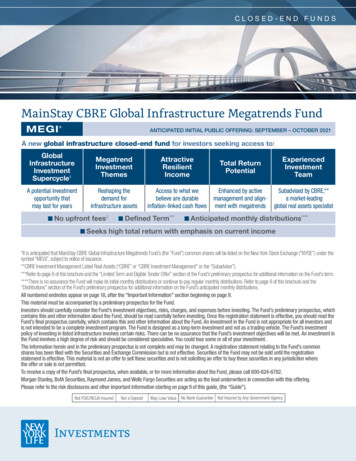
Investment and Performance Comparison (Unaudited)Performance data quoted represents past performance. Past performance is no guarantee of future results. Because of market volatilityand other factors, current performance may be lower or higher than the figures shown. Investment return and principal value willfluctuate, and as a result, when shares are redeemed, they may be worth more or less than their original cost. The graph below depictsthe historical performance of Class I shares of the Fund. Performance will vary from class to class based on differences inclass-specific expenses and sales charges. For performance information current to the most recent month-end, please call800-624-6782 or visit newyorklifeinvestments.com.The performance table and graph do not reflect the deduction of taxes that a shareholder would pay on distributions or Fund share redemptions. Totalreturns reflect maximum applicable sales charges as indicated in the table below, if any, changes in share price, and reinvestment of dividend and capitalgain distributions. The graph assumes the initial investment amount shown below and reflects the deduction of all sales charges that would have appliedfor the period of investment. Performance figures may reflect certain fee waivers and/or expense limitations, without which total returns may have beenlower. For more information on share classes and current fee waivers and/or expense limitations (if any), please refer to the Notes to FinancialStatements. 30,000 25,480FTSE NAREIT All EquityREITs Index 23,510MSCI U.S.REIT Index25,000 23,123CBRE Real EstateTiered Index20,000 23,054MainStay CBRE RealEstate Fund ClassI rage Annual Total Returns for the Year-Ended April 30, 2022ClassInceptionDate1Sales Charge3OneYearFiveYears6.84%13.068.08%9.36Ten Yearsor SinceInceptionGrossExpenseRatio2Class A SharesMaximum 5.5% Initial Sales ChargeWith sales chargesExcluding sales charges12/20/20027.74%8.381.45%1.45Investor Class Shares4Maximum 5% Initial Sales ChargeWith sales chargesExcluding sales ss C Shares3Maximum 1% CDSCIf Redeemed Within One Year of PurchaseWith sales chargesExcluding sales Class I Shares3No Sales Charge12/31/199613.519.758.711.20Class R3 Shares3No Sales Charge8/5/201112.839.108.131.80Class R6 Shares3No Sales Charge7/3/201413.619.838.600.841. Effective at the close of business on February 21, 2020, the Fund changed its fiscal and tax year end from October 31 to April 30.2. The gross expense ratios presented reflect the Fund’s “Total Annual Fund Operating Expenses” from the most recent Prospectus, as supplemented, and may differ fromother expense ratios disclosed in this report.3. Performance figures for Class A shares, Class C shares, Class I shares, Class R3 shares and Class R6 shares, reflect the historical performance of the then-existingClass A shares, Class C shares, Class I shares, Class R and Class R6 shares of the Voya Real Estate Fund (the predecessor to the Fund, which was subject to a differentfee structure) for periods prior to February 21, 2020.4. Prior to June 30, 2020, the maximum initial sales charge was 5.5%, which is reflected in the applicable average annual total return figures shown.The footnotes on the next page are an integral part of the table and graph and should be carefully read in conjunction with them.5
Benchmark Performance*OneYearFiveYearsTenYearsFTSE NAREIT All Equity REITs Index110.12%9.77%9.80%CBRE Real Estate Tiered Index210.128.268.74MSCI U.S. REIT Index311.588.628.928.068.368.31Morningstar Real Estate Category Average4* Returns for indices reflect no deductions for fees, expenses or taxes, except for foreign withholding taxes where applicable.1. The Fund has selected the FTSE NAREIT All Equity REITs Index as its primary benchmark. The FTSE NAREIT All Equity REITs Index is a free-float adjusted, marketcapitalization-weighted index of U.S. equity REITs. Constituents of the index include all tax-qualified REITs with more than 50 percent of total assets in qualifying realestate assets other than mortgages secured by real property.2. The Fund has selected a tiered benchmark as its secondary benchmark. The returns for the tiered benchmark represent the returns of the MSCI U.S. REIT Index priorto January 1, 2021 and the returns of the FTSE NAREIT All Equity REITs Index thereafter.3. The MSCI U.S. REIT Index is a free float-adjusted market capitalization weighted index that is comprised of equity real estate investment trusts. Results assumereinvestment of all dividends and capital gains. An investment cannot be made directly in an index.4. The Morningstar Real Estate Category Average is representative of funds that invest primarily in real estate investment trusts of various types. REITs are companies thatdevelop and manage real estate properties. There are several different types of REITs, including apartment, factory-outlet, healthcare, hotel, industrial, mortgage, office,and shopping center REITs. Some portfolios in this category also invest in real estate operating companies. Results are based on average total returns of similar fundswith all dividends and capital gain distributions reinvested.The footnotes on the preceding page are an integral part of the table and graph and should be carefully read in conjunction with them.6MainStay CBRE Real Estate Fund
Cost in Dollars of a 1,000 Investment in MainStay CBRE Real Estate Fund (Unaudited)The example below is intended to describe the fees and expenses borneby shareholders during the six-month period from November 1, 2021 toApril 30, 2022, and the impact of those costs on your investment. 8,600 account value divided by 1,000 8.6), then multiply the resultby the number under the heading entitled “Expenses Paid During Period”to estimate the expenses you paid on your account during this period.ExampleHypothetical Example for Comparison PurposesThe fourth and fifth data columns in the table below provide informationabout hypothetical account values and hypothetical expenses based onthe Fund’s actual expense ratio and an assumed rate of return of 5% peryear before expenses, which is not the Fund’s actual return. Thehypothetical account values and expenses may not be used to estimatethe actual ending account balances or expenses you paid for thesix-month period shown. You may use this information to compare theongoing costs of investing in the Fund with the ongoing costs of investingin other mutual funds. To do so, compare this 5% hypothetical examplewith the 5% hypothetical examples that appear in the shareholder reportsof the other mutual funds.As a shareholder of the Fund you incur two types of costs: (1) transactioncosts, including exchange fees and sales charges (loads) on purchases(as applicable), and (2) ongoing costs, including management fees,distribution and/or service (12b-1) fees and other Fund expenses (asapplicable). This example is intended to help you understand yourongoing costs (in dollars) of investing in the Fund and to compare thesecosts with the ongoing costs of investing in other mutual funds. Theexample is based on an investment of 1,000 made at the beginning ofthe six-month period and held for the entire period from November 1,2021 to April 30, 2022.This example illustrates your Fund’s ongoing costs in two ways:Actual ExpensesThe second and third data columns in the table below provide informationabout actual account values and actual expenses. You may use theinformation in these columns, together with the amount you invested, toestimate the expenses that you paid during the six months ended April30, 2022. Simply divide your account value by 1,000 (for example, anPlease note that the expenses shown in the table are meant to highlightyour ongoing costs only and do not reflect any transactional costs, suchas exchange fees or sales charges (loads). Therefore, the fourth and fifthdata columns of the table are useful in comparing ongoing costs only andwill not help you determine the relative total costs of owning differentfunds. In addition, if these transactional costs were included, your costswould have been higher.ExpensesPaidDuringPeriod1Ending AccountValue (Basedon Hypothetical5% AnnualizedReturn andActual Expenses)4/30/22ExpensesPaidDuringPeriod1 975.40 5.78 1,018.94 5.911.18% 1,000.00 976.30 5.24 1,019.49 5.361.07%Class C Shares 1,000.00 972.30 9.29 1,015.37 9.491.90%Class I Shares 1,000.00 977.50 4.07 1,020.68 4.160.83%Class R3 Shares 1,000.00 974.80 7.00 1,017.70 7.151.43%Class R6 Shares 1,000.00 977.90 3.63 1,021.13 3.710.74%Share ClassBeginningAccountValue11/1/21Ending AccountValue (Basedon ActualReturns andExpenses)4/30/22Class A Shares 1,000.00Investor Class SharesNet ExpenseRatioDuringPeriod21. Expenses are equal to the Fund’s annualized expense ratio of each class multiplied by the average account value over the period, divided by 365 and multiplied by 181(to reflect the six-month period). The table above represents the actual expenses incurred during the six-month period. In addition to the fees and expenses which theFund bears directly, it also indirectly bears a pro rata share of the fees and expenses of the underlying funds in which it invests. Such indirect expenses are not includedin the above-reported expense figures.2. Expenses are equal to the Fund's annualized expense ratio to reflect the six-month period.7
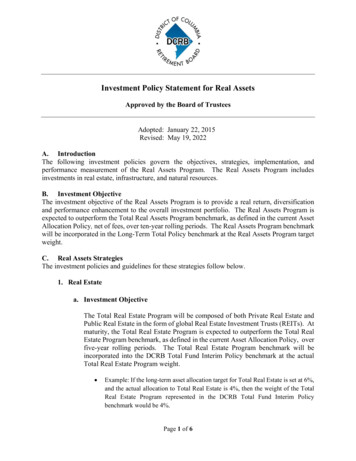
Sector Composition as of April 30, 2022 (Unaudited)ResidentialTechnology TowersNet Lease PropertiesSelf Storage PropertyIndustrial PropertiesHealthcare FacilitiesTechnology ice BuildingsEnclosed MallCommunity Shopping CentersTimberShort–Term InvestmentOther Assets, Less Liabilities100.0%See Portfolio of Investments beginning on page 10 for specific holdings within these categories. The Fund's holdings are subject to change.Top Ten Holdings and/or Issuers Held as of April 30, 2022 (excluding short-term investments)(Unaudited)1.2.3.4.5.8Crown Castle International Corp.Prologis, Inc.Equinix, Inc.American Tower Corp.Extra Space Storage, Inc.MainStay CBRE Real Estate Fund4.5%4.01.71.71.30.26.7.8.9.10.Realty Income Corp.CubeSmartSun Communities, Inc.Simon Property Group, Inc.Invitation Homes, Inc.
Portfolio Management Discussion and Analysis (Unaudited)Questions answered by portfolio managers Joseph P. Smith, CFA, Jonathan Miniman, CFA, and Kenneth S. Weinberg, CFA,of CBRE Investment Management Listed Real Assets LLC.How did MainStay CBRE Real Estate Fund performrelative to its benchmarks and peer group during the 12months ended April 30, 2022?For the 12 months ended April 30, 2022, Class I shares ofMainStay CBRE Real Estate Fund returned 13.51%, outperformingthe 10.12% return of the Fund’s primary benchmark, the FTSENareit All Equity REITs Index; the 10.12% return of the CBRE RealEstate Tiered Index, which is the Fund’s secondary benchmark;and the 11.58% return of MSCI U.S. REIT Index, which is anadditional benchmark of the Fund. Over the same period, Class Ishares outperformed the 8.06% return of the Morningstar RealEstate Category Average.1Were there any changes to the Fund during the reportingperiod?Effective December 31, 2021, T. Ritson Ferguson no longer servesas a portfolio manager for the Fund.What factors affected the Fund’s relative performanceduring the reporting period?During the reporting period, the Fund’s performance benefitedfrom both positive stock selection and positive property sectorallocation; stock selection accounted for the greater part of theFund’s outperformance relative to the FTSE Nareit All Equity REITsIndex.During the reporting period, which sectors were thestrongest positive contributors to the Fund’s relativeperformance and which sectors were particularly weak?From a sector allocation perspective, the strongest positivecontributions to the Fund’s relative performance came from netleased properties, industrial properties and data centers.(Contributions take weightings and total returns into account.) Themost significantly underperforming sectors included towers, hotelsand shopping centers.weakest-performing holdings included tower REIT AmericanTower, which lost ground on lowered earnings forecasts; andsenior housing REIT Ventas, which underperformed on challengingsenior housing operating news.What were some of the Fund’s largest purchases andsales during the reporting period?The Fund’s largest purchases during the reporting period includedshares in data center REIT Equinix and residential housing REITSun Communities. In our opinion, Equinix offered an attractivecombination of growth and value, while Sun Communities featuredan accelerating revenue and profit outlook. The Fund’s largestsales during the same period included holdings in industrial REITsDuke Realty and Prologis. Both sales reflected our opinion that thestocks had rich valuations in the wake of strong performance.How did the Fund’s sector weightings change during thereporting period?During the reporting period, the Fund increased its exposure mostsubstantially to the residential and data center sectors– bothareas where we see attractive relative valuations combined withaccelerating earnings potential. During the same period, the Fundreduced its exposure most substantially to the industrial andshopping center sectors due to prior outperformance,over-valuation and what we see as moderating earnings growthoutlooks.How was the Fund positioned at the end of the reportingperiod?As of April 30, 2022, the Fund held overweight positions relativeto the FTSE Nareit All Equity REITs Index in the self-storage, malland residential sectors. As of the same date, the Fund heldrelatively underweight positions in the data center, health care andoffice sectors.During the reporting period, which individual stocksmade the strongest positive contributions to the Fund’sabsolute performance and which stocks detracted themost?The strongest positive contributors to the Fund’s absoluteperformance during the reporting period included holdings indiversified commercial property REIT Vereit, which benefited frommerger and acquisition activity; self-storage REIT ExtraSpaceStorage, which saw accelerating storage revenue and profit; andapartment REIT Camden Property Trust, which experiencedaccelerating apartment revenue and profit. The Fund’s1. See page 5 for other share class returns, which may be higher or lower than Class I share returns. See page 6 for more information on benchmark and peer groupreturns.The opinions expressed are those of the portfolio managers as of the date of this report and are subject to change. There is no guarantee that any forecasts will come topass. This material does not constitute investment advice and is not intended as an endorsement of any specific investment.9
Portfolio of Investments April 30, 2022†SharesValueSharesValueCommon Stocks 98.5%Residential (continued)Community Shopping Centers 1.7%Regency Centers Corp.Essex Property Trust, Inc.Independence Realty Trust, Inc.34,033158,400 11,206,0464,317,984Invitation Homes, Inc.NexPoint Residential Trust, Inc.361,04837,43414,376,9313,337,616Sun Communities, Inc.109,93219,300,761Tricon Residential, Inc.239,4153,469,123Retail Opportunity Investments Corp.53,004223,500 3,648,2654,163,8057,812,070Enclosed Mall 4.0%Simon Property Group, Inc.159,27718,794,68688,494,612Self Storage Property 10.9%Healthcare Facilities 7.8%Alexandria Real Estate Equities, Inc.Healthcare Realty Trust, Inc. (a)45,621156,8008,310,3214,246,144Healthcare Trust of America, Inc., Class A251,4657,659,624Ventas, Inc.Welltower, martExtra Space Storage, Inc.Life Storage, Inc.78,741Equinix, Inc.3,559,824Technology Towers 15.0%Park Hotels & Resorts, Inc.Sunstone Hotel Investors, Inc. (b)392,300605,8007,732,2337,421,050American Tower Corp.Crown Castle International Corp.Xenia Hotels & Resorts, Inc. (b)279,8005,397,342Prologis, Inc.233,52237,431,241Rexford Industrial Realty, Inc.159,20012,423,96810,432,395Technology Datacenters 6.6%335,200Industrial Properties 10.7%19,974,10720,260,46050,666,962Hotels 5.2%DiamondRock Hospitality Co. 219,64529,581,83140,680,45070,262,281Timber 1.7%Weyerhaeuser Co.196,5448,101,544Total Common Stocks(Cost 383,155,295)460,519,00349,855,209Short-Term Investments 1.3%Net Lease Properties 11.5%Four Corners Property Trust, Inc.Gaming and Leisure Properties, Inc.159,70072,7004,385,3623,226,426National Retail Properties, Inc.Realty Income Corp.118,000289,3915,173,12020,072,160Spirit Realty Capital, Inc.131,4605,711,937STAG Industrial, Inc.VICI Properties, liated Investment Company 0.5%MainStay U.S. Government Liquidity Fund,0.397% (c)2,237,5673,790,9813,790,981Unaffiliated Investment Company 0.8%Invesco Government & Agency Portfolio,0.419% (c)(d)Total Short-Term Investments(Cost 6,028,548)Office Buildings 4.5%Highwoods Properties, Inc.110,5494,514,821Total InvestmentsHudson Pacific Properties, Inc.Paramount Group, Inc.224,005482,9005,214,8364,592,379(Cost 389,183,843)Other Assets, Less LiabilitiesPiedmont Office Realty Trust, Inc., Class A427,5756,883,9582,237,567Net Assets6,028,54899.8%0.2466,547,551789,244100.0% 467,336,79521,205,994Residential 18.9%Apartment Income REIT Corp.137,3586,753,893AvalonBay Communities, Inc.Camden Property Trust56,11282,65612,764,35812,967,90010MainStay CBRE Real Estate FundThe notes to the financial statements are an integral part of, andshould be read in conjunction with, the financial statements.
†Percentages indicated are based on Fund net assets.(a) All or a portion of this security was held on loan. As of April 30, 2022, theaggregate market value of securities on loan was 3,633,974. The Fundreceived cash collateral with a value of 3,790,981. (See Note 2(H))(b) Non-income producing security.(c) Current yield as of April 30, 2022.(d) Represents a security purchased with cash collateral received for securitieson loan.Investments in Affiliates (in 000’s)Investments in issuers considered to be affiliate(s) of the Fund during the year ended April 30, 2022 for purposes of Section 2(a)(3) of the InvestmentCompany Act of 1940, as amended, were as follows:Affiliated Investment CompaniesMainStay U.S. Government Liquidity FundValue,Beginningof Year 2,422ProceedsfromSalesNetRealizedGain/(Loss)on Sales 75,286 (75,470) —Purchasesat CostChange inUnrealizedAppreciation/(Depreciation)Value,End ofYearDividendIncomeOtherDistributionsSharesEnd ofYear — 2,238 1 —2,238Abbreviation(s):REIT—Real Estate Investment TrustThe following is a summary of the fair valuations according to the inputs used as of April 30, 2022, for valuing the Fund’s assets:DescriptionQuotedPrices inActiveMarkets forIdenticalAssets(Level 1)SignificantOtherObservableInputs(Level 2)SignificantUnobservableInputs(Level 3)Total 460,519,003 — — 3,790,981Asset Valuation InputsInvestments in Securities (a)Common StocksShort-Term InvestmentsAffiliated Investment CompanyUnaffiliated Investment CompanyTotal Short-Term InvestmentsTotal Investments in Securities6,028,548——6,028,548 466,547,551 — — 466,547,551(a) For a complete listing of investments and their industries, see the Portfolio of Investments.The notes to the financial statements are an integral part of, andshould be read in conjunction with, the financial statements.11
Statement of Assets and Liabilities as of April 30, 2022AssetsClass ANet assets applicable to outstanding sharesInvestment in unaffiliated securities, at value(identified cost 386,946,276) including securities on loan of 3,633,974Investment in affiliated investment companies, at value 464,309,984Net asset value per share outstanding14,454,060 13.38Maximum sales charge (5.50% of offering price)(identified cost 2,237,567)Receivables:Fund shares soldDividendsInvestment securities soldMaximum offering price per share outstanding 14.164,742,412Investor ClassNet assets applicable to outstanding shares 227,488140Other assets60,033472,016,959LiabilitiesCash collateral received for securities on loan0.782,237,567340,724326,099Securities lendingTotal assets 193,441,057Shares of beneficial interest outstanding3,790,981Shares of beneficial interest outstandingNet asset value per share outstanding16,993 Maximum sales charge (5.00% of offering price)0.70Maximum offering price per share outstanding Class CNet assets applicable to outstanding shares 7,219,831Shares of beneficial interest outstandingPayables:Manager (See Note 3)319,861Fund shares redeemedTransfer agent (See Note 3)205,118156,096Shareholder communication58,629Professional feesNYLIFE Distributors (See Note 3)54,99348,822CustodianTrustees10,54981Accrued expenses35,034Net assets4,680,164Net asset value and offering price per share outstanding Class INet assets applicable to outstanding shares 241,718,845Shares of beneficial interest outstanding15.0515,253,328Net asset value and offering price per share outstanding 15.85Class R3Net assets applicable to outstanding shares 2,671,613201,528Net asset value and offering price per share outstanding Class R6Net assets applicable to outstanding shares 22,057,96113.26 467,336,795Composition of Net AssetsShares of beneficial interest outstanding (par value of .001 pershare) unlimited number of shares authorized14.09479,715Shares of beneficial interest outstandingTotal liabilities13.39Shares of beneficial interest outstanding 31,797Additional paid-in-capital294,285,259Total distributable earnings (loss)173,019,739Net asset value and offering price per share outstanding1,391,677 15.85294,317,056Net assets12MainStay CBRE Real Estate Fund 467,336,795The notes to the financial statements are an integral part of, andshould be read in conjunction with, the financial statements.
Statement of Operations for the year ended April 30, 2022Investment Income (Loss)IncomeDividends-unaffiliated (net of foreign tax withholding of 1,208) 9,778,780Securities lendingDividends-affiliated3,285561Total income9,782,626ExpensesManager (See Note 3)3,420,784Transfer agent (See Note 3)906,499Distribution/Service—Class A (See Note 3)Distribution/Service—Investor Class (See Note 3)481,921489Distribution/Service—Class C (See Note 3)Distribution/Service—Class R3 (See Note 3)86,88613,086Professional fees131,188RegistrationShareholder lder service (See Note 3)MiscellaneousTotal expenses before waiver/reimbursementExpense waiver/reimbursement from Manager (See Note 3)Net expensesNet investment income 2,8825,229,744Realized and Unrealized Gain (Loss)Net realized gain (loss) on:Unaffiliated investment transactionsForeign currency transactions111,596,3361,922Net realized gain (loss)111,598,258Net change in unrealized appreciation (depreciation) on:Unaffiliated investments(62,611,624)Translation of other assets and liabilities in foreign currenciesNet change in unrealized appreciation (depreciation)Net realized and unrealized gain (loss)Net increase (decrease) in net assets resulting from operationsThe notes to the financial statements are an integral part of, andshould be read in conjunction with, the financial statements.(22,548)(62,634,172)48,964,086 54,193,83013
Statements of Changes in Net Assetsfor the years ended April 30, 2022 and April 30, 202120222021Increase (Decrease) in Net AssetsOperations:Net investment income (loss)Net realized gain (loss)Net change in unrealized appreciation(depreciation) 5,229,744 5554,193,830145,100,831(5,974,725)(2,954,226)Net increase (decrease) in net assets
to January 1,2021 and the returns of the FTSE NAREITAll Equity REITs Index thereafter. 3.The MSCI U.S.REIT Indexisafree float-adjusted market capitalization weighted index that is comprised of equity real estate investment trusts.Results assume reinvestment of all dividends and capital gains.An investment cannot be made directly in an index. 4.