Transcription
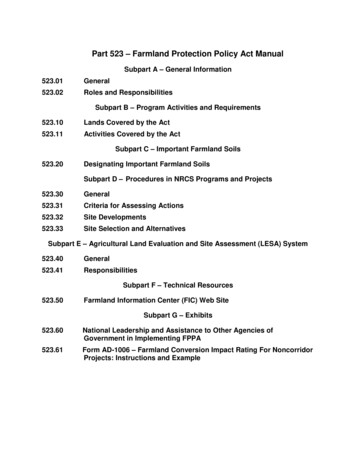
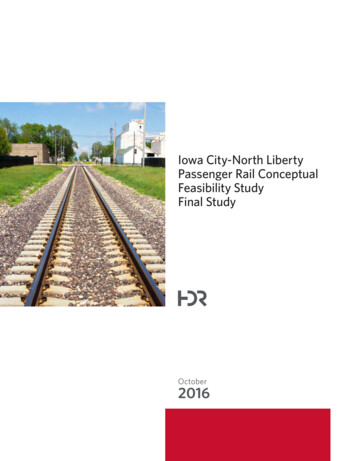
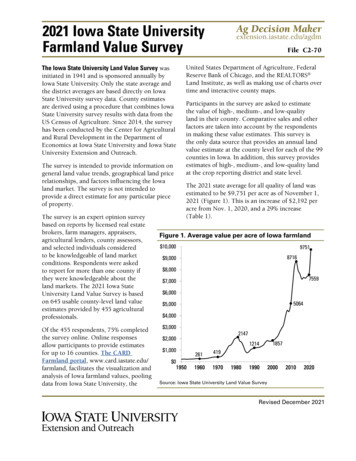
2021 Iowa State UniversityFarmland Value SurveyThe Iowa State University Land Value Survey wasinitiated in 1941 and is sponsored annually byIowa State University. Only the state average andthe district averages are based directly on IowaState University survey data. County estimatesare derived using a procedure that combines IowaState University survey results with data from theUS Census of Agriculture. Since 2014, the surveyhas been conducted by the Center for Agriculturaland Rural Development in the Department ofEconomics at Iowa State University and Iowa StateUniversity Extension and Outreach.The survey is intended to provide information ongeneral land value trends, geographical land pricerelationships, and factors influencing the Iowaland market. The survey is not intended toprovide a direct estimate for any particular pieceof property.The survey is an expert opinion surveybased on reports by licensed real estatebrokers, farm managers, appraisers,agricultural lenders, county assessors,and selected individuals consideredto be knowledgeable of land marketconditions. Respondents were askedto report for more than one county ifthey were knowledgeable about theland markets. The 2021 Iowa StateUniversity Land Value Survey is basedon 645 usable county-level land valueestimates provided by 455 agriculturalprofessionals.Of the 455 respondents, 75% completedthe survey online. Online responsesallow participants to provide estimatesfor up to 16 counties. The CARDFarmland portal, www.card.iastate.edu/farmland, facilitates the visualization andanalysis of Iowa farmland values, poolingdata from Iowa State University, theAg Decision Makerextension.iastate.edu/agdmFile C2-70United States Department of Agriculture, FederalReserve Bank of Chicago, and the REALTORS Land Institute, as well as making use of charts overtime and interactive county maps.Participants in the survey are asked to estimatethe value of high-, medium-, and low-qualityland in their county. Comparative sales and otherfactors are taken into account by the respondentsin making these value estimates. This survey isthe only data source that provides an annual landvalue estimate at the county level for each of the 99counties in Iowa. In addition, this survey providesestimates of high-, medium-, and low-quality landat the crop reporting district and state level.The 2021 state average for all quality of land wasestimated to be 9,751 per acre as of November 1,2021 (Figure 1). This is an increase of 2,192 peracre from Nov. 1, 2020, and a 29% increase(Table 1).Figure 1. Average value per acre of Iowa farmland 10,00097518716 9,000 8,0007559 7,000 6,0005064 5,000 4,000 3,0002147 2,0001214 1,000 0195026141919601970198019901857200020102020Source: Iowa State University Land Value SurveyRevised December 2021
2021 Farmland Value SurveyPage 2Table 1. Recent changes in Iowa farmland valuesYearValueper 172018201920202021 2,147 1,801 1,691 1,357 948 787 875 1,054 1,139 1,214 1,219 1,249 1,275 1,356 1,455 1,682 1,837 1,801 1,781 1,857 1,926 2,083 2,275 2,629 2,914 3,204 3,908 4,468 4,371 5,064 6,708 8,296 8,716 7,943 7,633 7,183 7,326 7,264 7,432 7,559 9,751Dollarchange 81- 346- 110- 334- 409- 161 88 179 85 75 5 30 26 81 99 227 155- 36- 20 76 69 157 192 354 285 290 704 560- 97 693 1,644 1,588 420- 773- 310- 450 143- 62 168 127 2.3%1.7%29.0%Major Factors Influencing theFarmland MarketMost survey respondents listed positive andnegative factors influencing the land market. Of allrespondents, 94% listed at least one positive factor,and 65% listed at least one negative factor. In mostcases, respondents listed multiple factors.There were two positive factors listed by over10% of respondents who provided at least onepositive factor. The most frequently mentionedfactor was higher commodity prices, mentionedby 28.5% of respondents. Favorable interest ratesand strong yields were the second- and third-mostfrequently mentioned positive factors, mentionedby 24.4% and 7.4% of respondents, respectively.Other frequently mentioned positive factorsincluded limited land supply (7%), strong demand,including from investors (6.8%), COVID-relatedgovernment payments (6.3%), and good farmeconomy (4%).There were also two negative factors listed bymore than 10% of respondents who identifiedat least one negative factor. The most frequentlymentioned negative factor affecting land valueswas higher input costs, mentioned by 20% ofrespondents. Concerns about the sustainability ofhigh land prices and possible changes in interestrates were the second- and third-most frequentlymentioned negative factors, mentioned by 12%and 8.5% of respondents, respectively. Politicaluncertainty related to policies, such as tax lawchanges, and uncertainty related to COVID-19were each mentioned by 5–9% of respondents.Number of Sales Compared toPrevious YearSeventy-four percent of respondents reported moresales in 2021 relative to 2020, which is the highestsince we began recording this information in 1986.On the other end of the spectrum, just 9% reportedfewer sales, and 17% reported the same level ofsales in 2021 relative to 2020.Land Sales by Buyer CategoryThe 2021 survey asked respondents what percentof the land was sold to five categories of buyers:existing local farmers, existing relocating farmers,new farmers, investors, or other.The majority of farmland sales, 68%, were toexisting farmers, of which existing local farmerscaptured 66% of land sales. Only 2% of saleswere to existing, relocating farmers. Investors
2021 Farmland Value Surveyrepresented 25% of land sales. New farmersrepresented 4% of sales, and other purchaserswere 2% of sales.Land Sales by Seller CategoryThe 2021 survey asked respondents what percentof land was bought from five categories of sellers:active farmers, retired farmers, estate sales,investors, or other.The majority of farmland sales, 54%, were fromestate sales, followed by retired farmers at 24%.Active farmers accounted for 9% of sales, whileinvestors accounted for 10%.Estate sales by crop reporting district rangedfrom 66% in the Northwest district to 43% in theSouthwest district.Sales by investors were highest in the SouthCentral district (18%). The West Central districtreported the lowest investor sale activity (5%).Respondents by Occupation and byMode of SurveyThe 2021 survey asked the main occupationof the respondent: farm manager, appraiser,agricultural lender, broker/realtor, government,farmer/landowner, and other. This year’s surveyalso asked about the number of years’ experienceof respondents and number of counties they offerservices in.In total, 455 agricultural professionals completedthe survey, providing 645 county land valueestimates. Of these 455, agricultural lendersrepresented the largest group, accounting for39% of all respondents. Brokers/realtors, farmmanagers, and county assessors or USDA FSAlenders were the next three largest groups,representing 14%, 13%, and 11% of respondents,respectively.Of all respondents, the percentage of agriculturallenders ranged from 26% in the Central district tomore than 40% in the Northwest, West Central,and Northeast districts.Page 3Our respondents, on average, have 22 years ofexperience in their current profession and offerprofessional services to an average of six counties.While government officials typically only serve twocounties at most, realtors/brokers, appraisers, farmmanagers, and agricultural lenders offer services to11, 9, 8, and 5 counties, respectively.The survey was completed online by 75% of the455 respondents. Seventy-one percent of therespondents only provided land value estimatesfor their primary county and 14% and 7% of the455 respondents provided estimates for two andthree counties, respectively. Five percent of therespondents provided estimates for five or morecounties.Farmland Value and Cash Crop PricePredictions by RespondentsThis year’s survey asked respondents to predictland values and cash crop prices one and five yearsfrom now, as well as the prevailing interest ratesfor a 20-year farmland mortgage and a one-yearoperating loan.Respondents had optimistic views regarding thestrength of the farmland market one and fiveyears from now, and generally expect stable oreven higher land values. A vast majority, 80%, ofrespondents forecasted an increase in their localland market in one year, while 6% expected alower land value and 14% forecasted no change.Most people expected the land market willcontinue to grow less than 10% one year fromnow. Looking five years ahead, 11% of respondentsforecasted a decline, slightly larger than the6% forecasting a decline 12 months from now.However, over 80% of respondents still expect afurther increase in land values, with an increase of10%–20% selected by most respondents.Respondents expect stable corn and soybean cashcrop markets. In particular, the predicted stateaverage cash corn prices for November 2022 and2026 (five years from now) are 5.09/bu. and 5.11/bu., respectively. The statewide average
2021 Farmland Value SurveyPage 4Interpretation of the 2021 Survey Resultssoybean price predictions are 11.55/bu. in oneyear and 11.72/bu. five years from now.Respondents reported typical interest rates for 20year farmland mortgages and one-year operatingloans are 3.89% and 4.31%, respectively. These arefar lower than one-year-ago levels due to drasticinterest rate cuts by the Federal Reserve to combatthe COVID-19 pandemic in March 2020.Land Quality and Corn Suitability Rating 2To gauge how each respondent defined high-,medium-, and low-quality land for their county, weasked for estimated average CSR2 (Corn SuitabilityRating 2) for high-, medium-, and low-quality land.We also asked for estimates of the percent of landarea for each land quality class.Approximately 80% of participants provided atleast one CSR2 estimate for the correspondingland quality classes. The estimated average CSR2statewide for high-, medium-, and low-quality landis 83, 70, and 55 points respectively (Table 2). Theestimated percent of land area for high-, medium-,and low-quality land is 37%, 39%, and 24%,respectively.In addition, respondents ranked high-, medium-,and low-quality land based on relative conditionsin their region. For example, the average CSR2 forhigh-quality land in the South Central district is 72,which is only slightly larger than the CSR2 for lowquality land in the Northwest district (67).The 2021 Iowa State University Land Value Surveyreported a 29.0% increase to 9,751 per acre inaverage Iowa farmland values from November2020 to November 2021. This dramatic surgeis the largest in magnitude since 2011, and the 9,751/acre nominal land values is the highestever since the 1940s. The 2021 nominal land valueis 12% higher than the 2013 peak in nominalland values, although the inflation-adjusted value, 8,367/acre in 2015 dollars, saw a 21% increaseand is still lower than the 2012 and 2013 inflationadjusted values.The recent surge is buoyed by substantiallyhigher commodity prices, low interest rates,stronger-than-expected crop yields, strongdemand, including from investors, and limitedland supply. At the same time, respondents areincreasingly concerned about higher input costs,the sustainability of high land prices, possiblechanges in interest rates, and political uncertaintyregarding policies, such as possible tax lawchanges, which were all cited as negative factorsinfluencing the land market. In general, surveyrespondents are very optimistic about the strengthof the future land market with 80% of respondentsforecasting a continued increase in Iowa landvalues.Table 2. Estimated average CSR2 and percent of land area by land quality, 2021Reported Average CSR2Reported Percent of Land ediumQualityLowQualityNorthwestNorth CentralNortheastWest CentralCentralEast CentralSouthwestSouth 484248181926232028273628STATE837055373924
2021 Farmland Value SurveyThe 2021 Iowa State Land Value Survey revealedan overall consistent surging land value patternacross crop reporting districts, counties, and landquality classes. Land values across all nine cropreporting districts saw an increase in land values.The largest percentage increases were in the NorthCentral and West Central districts, 34.5% and33.1%, respectively. The Southwest and Southeastdistricts, which saw the smallest percentagechanges, also reported an increase of more than20%. Across land quality classes, high-quality landsaw the greatest increase, 30.5%, while mediumand low-quality land experienced 27.4% and 26.0%increases, respectively. All 99 counties reported thehighest nominal land values since 1950; and, for20 counties, the inflation-adjusted values are alsorecord-high–even higher than the previous peak in2013. The largest percentage increase, 36.4%, wasreported in both Clayton and Allamakee Counties,while Keokuk County reported lowest percentageincrease, 23.2%.In general, the results from the 2021 Iowa StateUniversity Land Value Survey echo results fromother surveys, which all showed surging farmlandmarket trends due to higher commodity prices andlow interest rates. In November 2021, the FederalReserve Bank of Chicago reported a 28% increase inIowa‘s “good” farmland values from October 2020to October 2021. In September, the REALTORS Land Institute, .pdf, reported an overall 26.6%increase in Iowa cropland values from September2020 to September 2021. The US Department ofAgriculture June Area Survey reported a 9.6% risein Iowa‘s agricultural real estate values (land andbuilding) from June 2020 to June 2021, which issmaller in magnitude because it did not capturethe continued surge from June 2021 to November2021.Seventy-four percent of respondents reported moresales in 2021 relative to 2020, which is the highestsince we began recording this information in 1986.On the other end of the spectrum, just 9% reportedfewer sales, and 17% reported the same level ofsales in 2021 relative to 2020.Page 5The majority of farmland sales, 68%, were toexisting farmers, of which existing local farmerscapture 66% of land sales. Only 2% of sales were toexisting relocating farmers. Investors represented25% of land sales. New farmers represented 4% ofsales, and other purchasers were 2% of sales.The farmland value estimates from the Iowa Statesurvey are average estimates for all farmland ina county, which includes cropland as well aspasture, CRP, and timberland. Specifically, weasked respondents to estimate “farmland valuefor average-sized farms in your county as ofNovember 1, 2021.”An opinion survey is just that–it represents thecollective opinion of the survey respondents.Most of the respondents will use actual sales toformulate their opinions but each person canchoose to weigh or discount particular sales asthey deem necessary. The Iowa State Land ValueSurvey is an opinion survey, as are the surveysconducted by Federal Reserve Bank, USDA, andthe REALTORS Land Institute. It is importantto consider the survey respondents, the questionsasked, the time period covered, and other factorsrelating to a particular survey. As a result, it isimportant to note that when comparing resultsacross surveys for Iowa and neighboring states, itis better to compare percentage change over timeas opposed to dollar amount per acre.The Iowa State Land Value Survey is intended toprovide information on general land value trendsand factors influencing the Iowa land market, itis not intended to provide a direct estimate forany particular piece of property. We recommendinterested buyers or sellers hire an appraiser toconduct a formal appraisal of a particular parcel,go to county assessor websites, or examine recentauction results for comparable parcels in theirregion.There are several new uncertainties worthwatching over the next year or two. First, we arenow witnessing the highest inflation rate since the1980s, and the inflation-adjusted farmland loan
Page 6rates are practically negative. Second, based onthe 2021 survey, the most frequently mentionednegative factor affecting land values was higherinput costs. Producers already saw this in manyfactors of their production, including fertilizers,machinery, and fuel. Third, respondents are alsoconcerned about the sustainability of current highland prices and worry about a possible bubbleburst. The last time Iowa farmland values grewnear 30% was in the mid-1970s and 2011, whichundoubtedly leads to worries about the 1980sfarm crisis and the downturn after the 2013peak. Our previous research, /pdf/18wp577.pdf, shows that unlike the 1970s–1980s, thecurrent farm income growth is not significantlydriven by inflation, the interest rate environmentis still historically low, and agricultural lendersare following more prudent lending practices.It is possible that buyers in the current landmarket ignored the temporary nature of stronggovernment payments and thus overbid, and thusthere could be some downward adjustment inthe future. In the 2021 survey, a larger share ofrespondents also forecasted a possible decline fiveyears from now than 12 months later. However,at least the current evidence suggests that thecontemporary farmland values are still supportedby the real, strong income growth and lowinterest rates. With at least 80% of Iowa farmlandfully paid for, df, we do not foresee a suddencollapse of the agricultural land markets in thenear future.2021 Farmland Value SurveyThe dramatic increase in the Iowa farmlandmarket is a result of lower interest rates, highercommodity prices, strong crop yields, andsignificant government payments. The result is arecord-high nominal land values for all 99 countiesin Iowa, and the third-highest values in inflationadjusted terms–only less than 2012 and 2013values. Future changes in inflation, interest rates,and commodity prices will shape the trajectoryof farmland market movements. Under currentcircumstances, many agricultural professionals stillanticipate a stable and modestly rising farmlandmarket in the near future.More details on the survey can be found on theCARD website, www.card.iastate.edu/farmlandand historical data can be downloaded in theAgDM Decision Tool Historical Farmland ValuesData, landvalues.xlsx, or in AgDM File C272, Historical Farmland Values, .pdf.
2021 Farmland Value SurveyPage 7Table 3. Average value per acre of Iowa farmland listed by crop reporting districts and quality of 4749655056480352136717WestCentralCentralAll 789975648336785984851046110744High 688834931390179749915998001228912512Medium 341707676497433788397009980Low 226365138913797378337683656379041344734
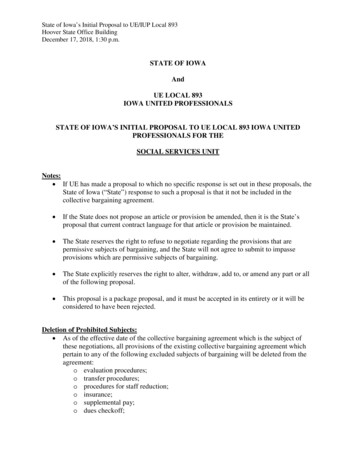
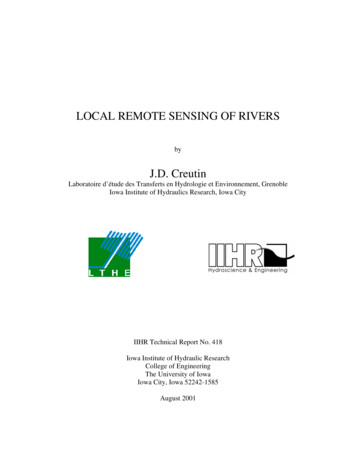
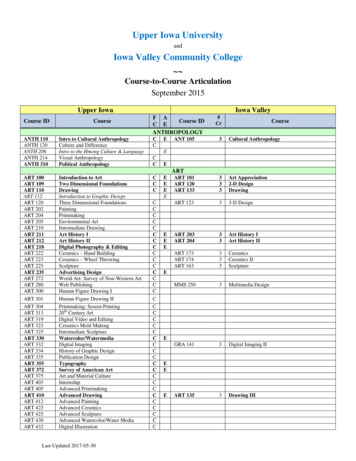
2021 Farmland Value SurveyPage 8Figure 2. 2021 and 2020 Iowa land values by countyState Average ValuesNov 2021: 9,751Nov 2020: 7,559County estimates of averagedollar value per acre forIowa farmland based onUS Census of Agricultureestimates and the Nov.1, 2021, Iowa Land ValueSurvey conducted by Centerfor Agricultural and RuralDevelopment, Iowa StateUniversity and Iowa StateUniversity Extension andOutreach. The top figure isthe estimated Nov. 1, 2021,value; the bottom figure isthe percentage of changefrom the estimated Nov. 1,2020, value.Figure 3. 2021 Iowa land values by crop reporting district13,997 – 11,042 – 8,08812,064 – 9,641 – 6,99212,308 – 9,122 – 6,717 12,164 10,664 9,958Up 27.6%Up 34.5%Up 32.3%12,289 – 9,700 – 7,04412,512 – 9,980 – 7,13613,503 – 10,179 – 7,215 10,461 10,744 11,051Up 33.1%Up 26.6%Up 29.6%9,424 – 7,145 – 5,1558,194 – 6,094 – 4,05811,628 – 8,169 – 4,734 7,582 6,035 8,451Up 24.0%Up 29.6%This institution is an equal opportunity provider.For the full non-discrimination statement oraccommodation inquiries, go towww.extension.iastate.edu/diversity/ext.Up 21.9%Estimates of average dollarvalue per acre for high,medium, and low gradefarmland (top row) onNov. 1, 2021, by Iowa CropReporting District; the CropReporting District average(middle row); and theaverage percentage changefrom Nov. 1, 2020 (bottomrow). The estimates arebased on a survey conductedby Iowa State University,Center for Agriculturaland Rural Development,and Iowa State UniversityExtension and Outreach.By Wendong Zhang, associate professor of economicsand extension economist515-294-2536 ww.card.iastate.edu/farmland
The Iowa State University Land Value Survey was initiated in 1941 and is sponsored annually by Iowa State University. Only the state average and the district averages are based directly on Iowa State University survey data. County estimates are derived using a procedure that combines Iowa State University survey results with data from the US .