Transcription
Capital Markets in Rwanda: Assessment and AspirationsThis paper was prepared to inform the discussion during the Rwanda Capital Market Authority'sStrategic Planning Roundtable on Capital Market Development, held October 14-16, 2015,in Rubavu, Rwanda.December 2015Introduction: “Vision 2020” and Financial Sector DevelopmentI: The Rwandan EconomyII: The Business EnvironmentIII: The Financial SectorIV: The State of Rwandan Capital MarketsV: Developments in Regional Capital-Market IntegrationVI: Aspirations for the Next 10 YearsThis background paper was prepared by John Schellhase, a research consultant for the Milken Institute Center for FinancialMarkets (CFM); Eric Bundugu, deputy executive director of the Capital Market Authority of Rwanda (CMA); and Jim Woodsome,a program research analyst at CFM. The authors would like to thank Staci Warden, executive director of CFM, and RobertMathu, executive director of the CMA, for their guidance and comments.
Introduction: “Vision 2020” and Financial Sector DevelopmentIn 2015, the Rwandan Ministry of Finance and Economic Planning mandated the Capital MarketAuthority of Rwanda (CMA) to develop a Capital Market Master Plan (CMMP). This plan will set theCMA’s policy strategy for the next 10 years. It will advance a strategic agenda for deepening debtmarkets, expanding listings on the Rwanda Stock Exchange (RSE), developing an ecosystem of financialsector intermediaries, and further integrating Rwanda’s capital markets with those of its East Africanneighbors.With the forthcoming CMMP in mind, the following pages provide essential background information onthe state of the Rwandan financial sector and the prospects for capital-market deepening. Section Idescribes the Rwandan economy generally; Section II examines the Rwandan business environment;Section III provides an overview of the financial sector; Section IV presents data on the size of Rwanda’scapital markets in relation to those of the East African Community (EAC) as a whole; and Section Vmaintains the regional focus and considers recent developments in capital-market integration in theEAC. Finally, Section VI concludes with a discussion of the CMA’s aspirations for capital-marketdevelopment for the next 10 years.The government of Rwanda (GOR) views the forthcoming CMMP as an opportunity to build on anambitious set of national priorities presented in the year 2000, when the leadership published “Vision2020” after a two-year, nationwide consultative process. This policy document advanced a holisticdevelopment agenda to “fundamentally transform Rwanda into a middle-income country by the year2020.” In the short and medium term, the government committed to promoting macroeconomicstability and working to transform the agricultural economy to a knowledge-based one. In the long term,“Vision 2020” emphasized the need for a growing, productive, and entrepreneurial middleclass, whichthe government believes requires strong, deep capital markets.The original “Vision 2020” referred to the financial sector in two places. In the first, the governmentpresented financial-sector deepening as key to its long-term goal of expanding the middle class:Stimulating the private sector, particularly with regard to the promotion of exports andcompetitiveness, is not achievable without broadening and deepening the financial sectorsuch as banking, insurance and the application of information technology.The second reference to the financial sector appeared in the presentation of “private-sector leddevelopment,” which is one of the pillars of the 20-year plan:The development of the financial sector will be crucial, as it is currently underdevelopedand poorly adapted to the economic needs of the country. The financial sector must beable to provide the necessary capital for private sector development.In 2012, the government released an updated version of “Vision 2020” with revised targets andadditional priorities. The document, for example, included new targets for the number of Internet users1
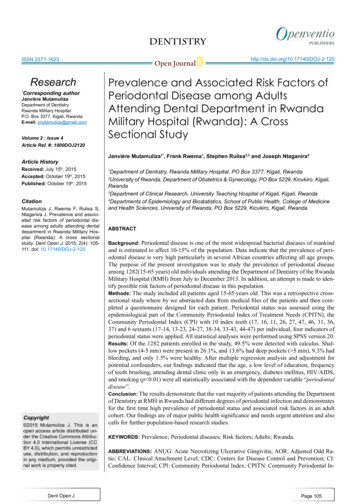
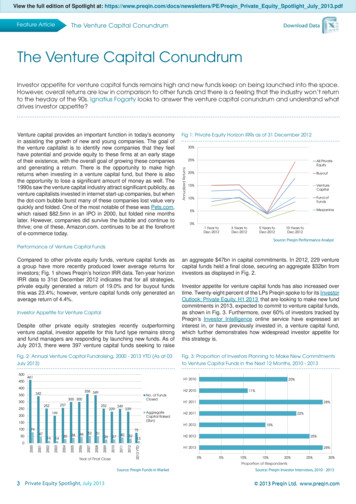
and mobile subscriptions. The 2012 revisions also expanded on the need for financial-sectordevelopment. Repeatedly, the government committed to “find a niche market in the region bybecoming a logistics, telecommunication and financial hub.” The document also emphasized the need toexpand financial access to households, strengthen the financial sector as a catalyst for continuedprivate-sector growth, and develop capital markets for long-term public and private investments. Finally,as shown in Table 1 below, the revised plan introduced three financial-market indicators to theinventory of measures of development progress: domestic credit to the private sector, the percentageof the adult population accessing financial services, and the percentage of payments transactedelectronically.TABLE 1: Financial Sector Indicators Introduced in the 2012 Update to ‘Vision 2020’IndicatorStatus in 2000Domestic credit to privatesector (% of GDP)Percentage of adult populationaccessing financial servicesPercentage of paymentstransacted electronicallyStatus in 2012Original TargetProposed TargetNot available13None30Not available47None90Not availableLess than 10None75Source: “Rwanda Vision 2020: Revised 2012,” Republic of Rwanda.Since the release of the revised national plan, the Ministry of Finance and Economic Planning hasincreasingly focused its attention on deepening Rwanda’s capital markets. This emphasis recentlyculminated in a directive to the Rwandan Capital Market Authority to produce the 10-year master planreferred to above. The GOR has maintained that a well-designed and successfully implemented CMMP isessential to lock in the country’s recent economic gains and sustain high levels of private-sector growth,thereby meeting the ambitious targets in “Vision 2020.”I: The Rwandan EconomySize and GrowthThe total size of the Rwandan economy in nominal GDP in 2014 was 7.9 billion. The economy is smallcompared to neighboring Kenya ( 60.9 billion) and Uganda ( 26.3 billion). It has been steadily growing,however. Rwanda has tripled its purchasing power in per-capita terms in the last 20 years, from justabove 500 in 1995 to over 1,550 in 2014, as measured in current international dollars. As illustrated inChart 1, annual growth in gross domestic product (GDP) has dipped below 5 percent only twice since thegovernment put forward “Vision 2020.” Impressively, since 2000 Rwanda has averaged annual GDPgrowth of 7.7 percent, and this growth rate is expected to continue. African Economic Outlook, acollaborative product from the African Development Bank, the Organization for Economic Cooperationand Development (OECD), and the United Nations Development Programme (UNDP), estimates theRwandan economy will grow at 7.5 percent in both 2015 and 2016.While poverty rates remain elevated, they are falling. At the national poverty line of 159,000 Rwandanfrancs—or around 240 per adult per year—poverty fell from 60 percent of the population in 2000 to 40percent in 2014. The Rwandan economy is also becoming more equitable. The Gini coefficient — a2
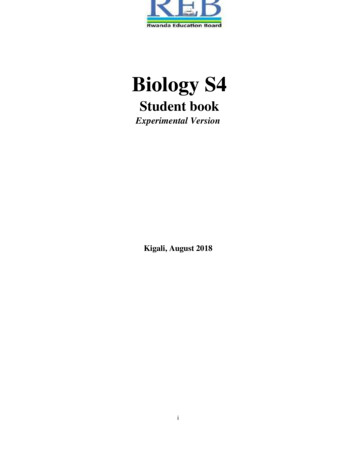
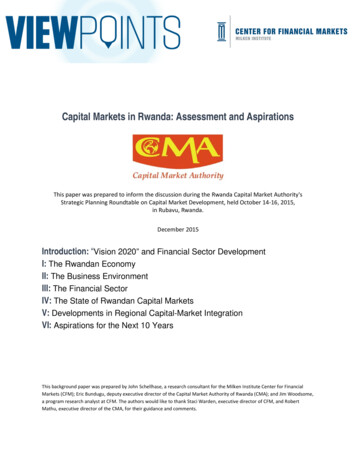
statistical measure of income inequality, in which 1.0 equals maximum inequality and 0.0 equals totalequality — dropped from 0.507 to 0.448 during this period.Source: World Bank, World Development Indicators.Stable InflationSince 2000, the average annual inflation rate has been 6.8 percent. In 2014, the inflation rate in Rwandawas 1.3 percent, far below the sub-Saharan African average of 4.3 percent. Inflation has remained undercontrol in 2015, with year-over-year headline inflation of 1.4, 0.7, and 0.8 percent in January, February,and March, respectively. Chart 2 shows annual inflation rates since 1999.Structure of the EconomyThe agrarian sector remains the main source of employment in Rwanda. More than 80 percent ofeconomically active workers were employed in agriculture in 2014, according to statistics from theAfrican Development Bank. These figures reflect the fact that the population is overwhelmingly rural,with only 17 percent of Rwandans living in cities. Though urbanization is likely to accelerate in comingyears, Rwanda currently has one of the least urbanized populations in Africa.While employment remains agrarian, economic activity has shifted to the services sector. The transitionfrom an agricultural to a knowledge-based, service economy that motivates “Vision 2020” was alreadyunderway in the late 1990s, and services surpassed agriculture as the largest contributor to GDP in 1999.A further widening between the two sectors occurred in 2006 and 2007. In 2014, services accounted for52.5 percent of economic production, with agriculture contributing 33.1 percent. Industry (whichincludes manufacturing, mining, and construction) formed 14.4 percent of the economy that same year,as it has for roughly the last decade.3
Source: International Monetary Fund, International Financial Statistics.External SectorThe Rwandan economy has become more open over the last 15 years, with trade as a percentage ofGDP growing from 31.2 percent in 1999 to 45.5 percent in 2014. This growth in trade has broughtRwanda almost to par with the trade levels of its EAC peers, Kenya, Tanzania, and Uganda, where trademeasures about 50 percent of GDP. Most Rwandan exports go to countries it immediately borders,while it largely imports from countries farther afield, including China, India, and the United ArabEmirates. Major Rwandan exports include mineral ores, coffee, and tea. Imports consist primarily of oil,cement, sugar, machinery parts, electronics, and chemical products. Like all other EAC member states,Rwanda has run trade deficits since at least 2005, and in 2014, Rwandan imports outweighed exports by 1.8 billion.Inflows of foreign direct investment (FDI) have risen in recent years. Before 2006, annual inward FDIrarely exceeded 10 million. Since 2006, inflows have averaged just under 100 million a year. In 2014,around 200 million in FDI came into Rwanda. Though the country is welcoming greater levels ofinvestment, aggregate FDI inflows from 1999 to 2014 barely surpassed 1 billion. Interestingly, thisfigure falls below aggregate remittance inflows during the same period by about 50 million.The major source of foreign investment in Rwanda has been development assistance from internationalfinancial institutions and national development agencies. In 2013, for example, Rwanda received 1.1billion in development assistance from international donors. This figure was equivalent to 110 percentof central government expenses that year. Total international aid from 1999 to 2013 came to 14.5billion. Ending aid dependency by promoting macroeconomic stability and private wealth creation is acenterpiece of “Vision 2020.” Still, as former Minister of Finance and Economic Planning DonaldKaberuka noted in his foreword to the original plan in 2000, “It is clear that donor support will remainnecessary to successfully attain the goals outlined in this document.”4
II: The Business EnvironmentIn line with the 2012 revisions to “Vision 2020,” credit to the private sector has expanded in recentyears. Domestic credit to the private sector, which measures the financial resources provided tocompanies through bank loans, trade credit, and other sources, rose from 12.8 percent of GDP in 2012to 17.6 percent in 2014. 1 For the last three years, most new private-sector lending has beenconcentrated in three areas: hospitality, real estate and construction, and manufacturing. The firstquarter of 2015 is representative of this trend, as 41.9 percent of the 267 million in new loans went tocommercial restaurants and hotels, another 36.2 percent to the real estate industry, and 4.4 percent tomanufacturing.As credit to the private sector has expanded, the government has worked to reduce the burdens ofstarting and operating a business. In 2008, Rwanda ranked 150th in the world in ease of doing business,according to the World Bank’s annual Doing Business index. Over the last seven years, however, Rwandahas climbed more than 100 places in the index and today ranks 46th globally. In sub-Saharan Africa,Rwanda stands as the third-easiest country in which to do business, following only Mauritius and SouthAfrica. Among low-income countries globally, Rwanda ranks first in the index.Recognizing the international prestige of the Doing Business rankings, the government of Rwandainitiated a surgically targeted reform process designed to raise its score. These efforts have produced anumber of improvements, including: Reducing the time it takes to start a business from 18 to 6.5 daysReducing the cost of starting a business from 235 percent of per-capita income to 52 percentReducing the time to obtain construction permits from 277 to 77 daysReducing the time to register property from 370 to 32 daysReducing the time to export from 60 to 26 days and the time to import from 95 to 27 daysRemarkably, Rwanda now ranks fourth in the world (tied with Australia and Montenegro) on the “easeof getting credit” category of Doing Business. In other words, Rwanda has a strong legal framework forborrower/lender protection and the sharing of credit information. This framework includes both a publiccredit bureau for financial institutions maintained by the National Bank of Rwanda (BNR), as well as anewly introduced private bureau. In 2010, following the passage of a law addressing credit information,the BNR licensed Credit Reference Bureau Africa (CRB-Africa), a continent-wide private company, tooperate in Rwanda. By 2014, CRB-Africa covered credit data for more than 27,000 Rwandan businesses.III: The Financial SectorRwanda’s second Financial Sector Development Programme (FSDP II) maps out the financial-sectorreform agenda for the period 2013 to 2018 and is designed to complement “Vision 2020” and thegovernment’s Economic Development and Poverty Reduction Strategy (EDPRS I and II). It covers allaspects of Rwanda’s financial system, to include banking, insurance, pensions, capital markets,1. Authors’ calculation based on figures reported in “Quarterly Economic and Financial Report: Developments and Prospects(First Quarter 2015),” National Bank of Rwanda.5
microfinance, payments, mobile banking and payments, and financial literacy. Many of FSDP II’s policyrecommendations respond to issues raised by the International Monetary Fund (IMF) and the WorldBank in their 2011 Financial Sector Assessment Program update.FSDP II builds on the progress made under FSDP I, which covered the period 2008 to 2012. The first FSDPfocused on: 1) expanding access to credit and financial services, 2) strengthening the legal andregulatory regime, 3) improve the environment for mobilizing domestic savings, and 4) mobilizing longterm capital for investment. By 2012, over 90 percent of FSDP I’s policy recommendations had beenimplemented, and, according to the authors of the second FSDP, “the major regulatory and institutionalelements of a developed financial sector [had] been put in place.” As such, FSDP II is “less about thecreation of institutions and markets, and more about building from a sound base to expand outreach,efficiency and innovation, and integration in the EAC.”Table 2 presents the Ministry of Finance and Economic Planning’s analysis of the strengths, weaknesses,and opportunities of the Rwandan financial sector, as well as the threats to financial-marketdevelopment. Next, it assesses the Rwandan banking system and the state of financial inclusion. Thesection concludes with a discussion of mobile money and the Rwandan financial sector.Banking Sector StrengthAs the Ministry of Finance and Economic Planning noted in its Rwanda Financial Sector Strategy for 2013to 2018, “Currently, Rwanda’s financial system is dominated by the banking sector.” At present, thebanking sector comprises 10 commercial banks, which control the bulk of financial assets, as well as fourmicrofinance banks, one development bank, and one cooperative. Together, these 16 banks hold 67.6percent of financial assets in the country, according to the BNR. Total bank assets at the end of the2013/2014 fiscal year came to 1.8 trillion RWF, or around 2.6 billion, a 28 percent increase from theprevious fiscal year. Total deposits have grown from around 225 million at the end of 2000 to 885million in 2010 and 1.6 billion by year-end 2014.The Rwandan banking sector has remained profitable. In 2014, Rwandan banks reported return onassets of 1.9 percent and return on equity of 10.7 percent. While higher than the previous year,Rwandan banking sector profitability falls below the levels seen in its neighbors Kenya and Uganda, asshown in Table 3. Like banks across the region, the Rwandan banking industry continues to haverelatively high rates of nonperforming loans, around 6 percent of total loans, compared to a globalaverage of 3 to 4 percent. It is in this context that banks in Rwanda and other East African countriesmaintain fairly high capital adequacy ratios. At the end of 2014, Rwandan banks maintained an averagecapital adequacy ratio of 24.2 percent, nearly 10 points higher than the regulatory minimum of 15percent. Kenyan, Tanzanian, and Ugandan banks maintain similar capital adequacy ratios.6
TABLE 2: “SWOT” Analysis of the Rwandan Financial SectorStrengths Strong political will: Financial Sector DevelopmentSecretariat aims to spearhead growth Strategies in place: national savings mobilization strategy,savings and credit cooperatives strategy (SACCOs), nationalmicrofinance implementation strategy, payments systemsframework and strategy Increased oversight and supervision through enactment oflaws governing the central bank, the banking industry,payment systems, capital markets, collective investmentschemes, mortgages, and launch of mobile money Institutional set-up: Rwanda market advisory council andRwanda Stock Exchange established Rwanda Cooperation Agency, Rwanda Association ofInsurers, Rwanda Association of Bankers, and RwandaAssociation of Microfinance Institutions established MFIs/SACCOs able to reach people through local branches Diaspora willingness to investOpportunities Untapped market, 28% (1.3 million adults) financiallyexcluded in 2012 Availability of technical assistance Strong support from development partners Existence of the Capital Market Authority and RwandaStock Exchange Modernized electronic payment system Presence of foreign banking institutions Establishment of business development fund East African integration Use of high-tech products such as mobile money transfersand internet banking International Finance Corp. opportunities in banking, tradefinance, captive insurance, pension and fund management(equity and trusts), international business, microfinanceand microinsuranceWeaknesses Relatively small financial market Low savings and investment Low penetration of financial institutions,particularly in rural areas Lack of diversified products Limited product innovations, singleproducts ”fit all” mentality, lack ofdemand-driven products Lack of skilled and specializedprofessionals Most financial institutions are located inurban areas Lack of education on financial productsand services SACCOs’ membership limited Limited credit to the private sector Limited products and services comparableto those of competing countriesThreatsInstability in international marketsLimited use of financial productsInadequate number of BNR inspectorsHigh inflation and interest ratesFraud through modernized paymentsystems Continued cuts to donor budgetarysupport Lack of international financial players inthe banking sector Source: Rwanda Financial Sector Strategy 2013-2018: Final Report, Ministry of Finance and Economic Planning, Republic ofRwanda.7
TABLE 3: Measures of Banking Sector Stability in the East African 822.16.02.012.442.5Solvency Ratio (capital adequacy)Nonperforming LoansReturn on Average AssetsReturn on Average EquityLiquid Assets / Total Deposits*Figures from Kenya and Uganda refer to 2013**Figures from Tanzania refer to 2012Sources: “Quarterly Economic and Financial Report: Developments and Prospects (First Quarter 2015),” National Bank ofRwanda; “East African Community Facts and Figures – 2014,” East African Community Secretariat.TABLE 4: Quarterly Interest Rate Developments in rch2015Key Repo Rate7.07.06.56.56.5Discount RateRepo Rate11.04.311.03.110.54.210.52.810.52.0T-Bills Rate6.46.05.54.94.3Interbank Rate5.65.85.64.83.8Deposit Rate8.38.67.37.88.1Lending Rate16.817.517.117.717.4Spread8.58.99.89.99.3Risk Premium10.811.911.612.813.0Money Market Interest RatesMarket Interest RatesSource: “Quarterly Economic and Financial Report: Developments and Prospects (First Quarter 2015),” National Bank ofRwanda.For bank customers, credit has grown more expensive. The medium-term, end-of-year market lendingrate rose from 16 percent in 2007 to 17.7 percent in 2014. At the end of the first quarter of 2015, themarket lending rate had fallen slightly to 17.4 percent. Table 4 summarizes these figures and otherdevelopments in money market interest rates over the past five quarters of available data.Financial InclusionAs mentioned above, total deposits in the Rwandan banking sector have doubled in the last five years.The larger value of deposits reflects the rapid growth of the Rwandan economy as well as broadenedaccess to financial services among the general population. The evidence comes from a pair of FinScope 2surveys, one in 2008 and a 2012 follow-up conducted by Access to Finance Rwanda. Based on thesesurveys, financial inclusion—defined as access to and ability to use financial (including microfinancial)2. FinScope is a survey tool designed by the FinMark Trust, sponsored by the UK Department for International Development.8
products and services—has increased from 47.6 percent of the adult population in 2008 to 71.8 percentin 2012.Inclusion has widened in tandem with the expansion of the commercial banking sector. The number ofbranches increased from 259 at the time of the 2008 survey to 467 branches and outlets in 2012, alongwith 229 new ATMs throughout the country. The percentage of adults accessing formal products andservices from commercial banks grew from 11.6 to 22.8 during the same period. As these figuressuggest, much of the financial activity in Rwanda occurs in non-bank formal institutions such as thecommunity savings and credit cooperatives known as SACCOs and other microfinance institutions, aswell as through informal means. Rwanda has been expanding its SACCO network as well, with more than400 branches dispersed throughout the country.Mobile MoneyTransactions online and via mobile phones have also expanded financial inclusion in Rwanda. Accordingto the IMF, the number of mobile banking payments rose by 155 percent between 2013 and 2014. 3 TheIMF also reports that 84 percent of Rwanda’s 7.7 million mobile subscriptions are linked to mobilemoney payment programs. According to the 2012 FinScope survey, 44 percent of adults sendingremittances (whether domestically or internationally) did so through mobile money transfers. It was, byfar, the most common way for Rwandans to send money home.While these trends show growth in mobile payments in Rwanda, the country still lags behind its EastAfrican neighbors in terms of offering expansive access to mobile finance. According to a 2014 reportfrom the EAC Secretariat, mobile financial transactions amounted to less than 0.1 percent of GDP. 4 Thefigure for Kenya was 49.0 percent of GDP in 2012, while Tanzania and Uganda saw mobile paymentsequivalent to 38.9 percent and 23.4 percent of GDP, respectively, that year. These numbers suggest thatRwanda is behind, but has a great deal of potential to expand the use of mobile financial transactions.IV: The State of Rwandan Capital MarketsCapital-market development is a key part of Rwanda’s Financial Sector Development Programme. Withthe 2011 passage of the Capital Markets Authority Law (which established the CMA), the CapitalMarkets Law, and the Law on Collective Investment Schemes, most of the necessary legal architecture isnow in place. The main capital-market development issues in FSDP II center on how to build “a viablecapital market in a small economy within a regional context.” They include: Creating a government bond market and yield curvePromoting private sector bond issuanceBroadening the investor base by encouraging the growth of contractual savingsinstitutionsCompleting the necessary infrastructure to support regional trading3. “Rwanda: Third Review Under the Policy Support Instrument,” IMF, June 2015.4. “Mobile and Agency Banking in the EAC Countries: A Diagnostic Analysis,” East African Community Secretariat, April 2014.9
Establishing guidelines for shelf registrations, medium-term notes (MTNs), and privateplacementsDeveloping a sustainability plan for the Rwanda Stock Exchange, including attractingadditional local and cross-listingsAppendix 1 includes a full review of the status of all policy action items related to capital markets inFSDP II. The current section reviews the state of Rwanda’s debt markets, the Rwanda Stock Exchange,current assets available to domestic institutional investors, and Rwanda’s private markets. As reference,Rwanda’s markets are often benchmarked against their regional peers in the East African Community.These aggregated figures also provide context for the discussion of capital-market integration efforts inSection V.Debt MarketsRwanda’s sovereign debt markets remain small compared with those of regional neighbors. As shown inTable 5 below, the value of sovereign bonds outstanding was just below 70 million in 2014, or 0.9percent of GDP (note that significant developments have occurred since then). That year, Uganda’soutstanding public debt was significantly larger, at 879 million, or 3.2 percent of Ugandan GDP.TABLE 5: The Size of the Capital Markets in East Africa in 2014Rwanda6Burundi0Kenya64Tanzania21Uganda16EAC Total1072*06314887Cross-listed firms4017820Corporate bonds201445251,931025,39312,8006,21846,342Listed companiesDomesticMarket capitalization, US millionsEquitiesDomestic 47,14661,59024.1041.826.722.531.6Domestic firms10.7-41.8123.022.3Cross-listed s-listed firmsBondsTOTALMarket capitalization, % of GDPEquitiesBonds*Note that these data refer to 2014 and significant developments have occurred since. For example, the RSE nowlists three domestic companies.Source: Rwanda Economic Update, World Bank, June 2015.10
In one of the more significant developments in recent years, the National Bank of Rwanda established aregular, quarterly debt issuance program in early 2014. Following its quarterly schedule faithfully, theBNR has completed five local-currency bond issuances since then, totaling 82.5 billion RWF, or roughly 115 million. These five issuances have included Rwanda’s first sovereign bonds with seven- and 10-yeartenors. The inaugural 10-year issuance was sold in May 2015 with an annual coupon rate of 12.925percent and was oversubscribed by 118 percent. The BNR is planning to issue its first 15-year maturitybond in May 2016.All government bonds are traded on the Rwanda Stock Exchange, though secondary trading is minimal.The RSE also lists two corporate bonds. The first, set to mature in 2018, is a 10-year, 1 billion RWF(about 1.4 million) issuance from I&M Bank (formerly the Banque Commerciale du Rwanda) with a 10.5percent coupon rate. The second is a five-year instrument from the International Finance Corp. (IFC)issued in May 2014 with a 12.25 percent coupon rate. The 15 billion RWF (about 22 million) IFC bondwas issued with the explicit goal of deepening the country’s local-currency capital markets. As apercentage of GDP, Rwanda’s corporate bond market is slightly larger than the corporate debt marketsin Tanzania and Uganda.The Rwanda Stock ExchangeThe RSE is still a young exchange, the youngest in East Africa. Trading began in 2011, and in addition tobond listings, the exchange currently lists equity shares of seven companies. Four of these equity listingsare cross-listed Kenyan firms, whose stock is primarily traded on the Nairobi Securities Exchange (NSE).The latest Kenyan firm to be cross-listed on the RSE is Equity Bank, which began trading in Kigali inFebruary 2015. The three Rwandan firms that have listed shares are the government-majority-ownedBank of Kigali, the beverage company Bralirwa (a subsidiary of Heineken), and most recently, CrystalTelecom, which listed in May. With the addition of Equity Bank and Crystal Telecom, the marketcapitalization of the RSE now exceeds 3 trillion RWF (about 4.2 billion). Despite the additions of thesenew companies and the implementation of a regional interdepository transfer mechanism (discussedfurther in Section V), secondary trading remains minimal on the RSE, as it does across the region.In 2013, the RSE relaxed the rules for small- and medium-sized enterprises (SMEs) that want to issuestock on the exchange. The newer rules waive the regular listing criteria, which include attaining aminimum initial market capitalization of 500 million RWF (about 700,000) and having a verifiablefinancial track record of at least three years. Instead, SMEs may list on the exchange without achievingany minimum initial market capitalization, and they need only provide their last year-end financialrecords as audited within the previous six months. SMEs must also produce a two-year sponsorshipagreement with a licensed broker or investment advisor. Despi
Source: "Rwanda Vision 2020: Revised 2012," Republic of Rwanda. Since the release of the revised national plan, the Ministry of Finance and Economic Planning has . Source: World Bank, World Development Indicators. Stable Inflation Since 2000, the average annual inflation rate has been 6.8 percent. In 2014, the inflation rate in Rwanda .