Transcription
4. CHAPTER FOUR: FORECASTS OF AVIATION DEMANDINTRODUCTIONForecasting aviation activity in the state is an important exercise in the system planning process. It provides ahistorical reference of activity changes in the past, and projects changes to come over the 20-year planninghorizon. Developing accurate and reliable forecasts can be challenging as changes in the economy, governmentregulations, and technological advances can impact aviation activity at any time. As such, a variety of forecastingmethods are employed to identify the most realistic projections of demand, including enplanements,operations, and based aircraft. Results of the forecasting effort help identify system capacity constraints and areused to make recommendations for system enhancement that will meet the needs of existing and future systemusers.The aviation demand elements are separated into commercial service and general aviation (GA). The FederalAviation Administration (FAA) utilizes the terms “primary” and “non-primary” in defining its terms for theairports included in the National Plan of Integrated Airport Systems (NPIAS). Primary airports are defined by theFAA as those public airports with scheduled airline service that have more than 10,000 enplaned passengers ayear. In Arizona, nine airports met this criterion and were defined as primary based on calendar year 2016 data.Two additional airports have scheduled airline service but had fewer than 10,000 enplanements in 2016. Forpurposes of the State Aviation System Plan (SASP), all airports with scheduled airline service, regardless of theirnumber of enplanements are included as commercial service airports. All other airports are identified as GAairports.The following sections include an overview of factors impacting aviation demand in the state, followed by areview of commercial service trends and forecasts for Arizona’s 11 commercial airports, as well as GA trends andforecasts for the remaining 56 GA system airports. The forecasts presented are optimistic based on thesignificant economic growth anticipated in the state over the 20-year planning horizon.SOCIOECONOMIC AND OTHER FACTORS IMPACTING AVIATION DEMANDThere is a strong relationship between socioeconomic factors and an airport’s and system’s activity levels. Inaddition to providing a general understanding of the existing conditions in an airport area, socioeconomic data isinstrumental in developing future projections of aviation activity. Tourism has a direct relationship tosocioeconomic factors and is a critical factor in Arizona’s aviation demand levels. Six factors were examined inthis analysis:1.2.3.4.5.6.PopulationAgeEmploymentGross Regional Product (GRP)IncomeTourismChapter 4: Forecasts of Aviation Demand2018 Page 4-1
This section provides an overview of demand factors in Arizona to indicate the origin of the forecasts of aviationdemand. A more detailed analysis of these factors is provided in Appendix D. Much of the data was obtainedfrom Woods & Poole Economics, Inc., an independent firm specializing in long-term country, state, and countyeconomic and demographic projections.PopulationPopulation in Arizona is projected to increase from 6.9 million to over 9.5 million (37 percent) between 2016 and2036, nearly doubling the national average rate of growth. The growth in population is not limited to only onecounty; 12 of 14 counties are projected to experience higher growth rates than the national average.1AgeDue to an inflow of retirees in the state, Arizona’s median age is projected to continue rising through theplanning horizon. By 2036, Arizona’s median age is projected to be 1.34 years older than the state’s 2016median age of 37.28.EmploymentThere was a steady increase in workforce levels in Arizona between 1980 and 2007. In 2007, the state wasseverely impacted by the Great Recession and was unable to reach pre-Recession workforce levels until 2014. Itis projected that by 2036 the workforce will reach 5 million, indicating a growing economy requiring moreworkers.Gross Regional ProductGRP is Gross Domestic Product (GDP) on a state level. Between 1980 and 2007 the state experienced significantannual increases in GRP. The Great Recession caused a decline in GRP from 2007 until 2009. Since 2010 the GRPhas been increasing at pre-Recession levels and is anticipated to reach nearly 500 billion by 2036.IncomeIncome was measured by examining the median household income of the state’s residents. Over the last 20years the state’s median household income maintained around 45,000, however, by 2036 it is projected thatonly 31 percent of households will earn less than 45,000.TourismWith many national parks and a diverse environment, Arizona is a destination for tourists and as such, theresultant economic impact has become an indicator of economic health in the state. The Great Recession causeda decline in tourism between 2007 and 2009 but tourism levels have since recovered.Summary of Anticipated Impact TrendsOverall, Arizona was rapidly increasing in population and economy until the Great Recession from 2007-2009.The state experienced economic declines across the board but has since recovered and healthy growth is1Woods & Poole Economics, Inc. elected to combine La Paz and Yuma counties into one entity. There are 15 counties in Arizona.Chapter 4: Forecasts of Aviation Demand2018 Page 4-2
projected through the planning period. Assuming the nation doesn’t experience another significant recession,the projected population and economic levels should create a positive ripple effect in air travel in Arizona, bothcommercial service and GA activity.COMMERCIAL SERVICECommercial air service activity accounts for a significant portion of all aviation operations in Arizona annually. Asa large sector of activity in the state, it is critical to understand the trends affecting the commercial aviationindustry in order to better forecast future operations. Some trends may impact the industry significantly whileothers may have minimal effect. This section focuses on the trends related to commercial aviation in the U.S.and Arizona.To identify current and projected national and state commercial trends, data from the FAA’s Terminal AreaForecast (TAF) issued January 2017 and the FAA Aerospace Forecast Fiscal Years 2017-2037 were analyzed.Additionally, data obtained from the 2017 Airport Inventory and Data Survey Form were also reviewed. Thetrends are presented in two groups, followed by a look at Arizona’s commercial service forecasts:1. National Commercial Aviation Trends2. Arizona Commercial Aviation TrendsNational Commercial Aviation TrendsSeveral trends have impacted commercial aviation in recent history and new trends are (or will) impactprojected aviation activity in the future. A look at the historical and current trends impacting the nation’saviation system is included below.Historical TrendsOver the past four decades, the U.S. commercial air carrier industry has been volatile, experiencing notableswings in activity resulting from economic, political, and social impacts. Most notably:1. Enplanements have experienced large fluctuations in the last 20 years which can be attributed to eventssuch as September 11, 2001 and the Great Recession of 2007-20092. Enplanements rebounded to almost pre-September 11, 2001 levels before the Great Recession of 2007and were back to pre-September 11, 2001 levels in 20113. The Great Recession in 2007 sparked fundamental changes in the way the airline industry operated withcommercial airline industry becoming lean, minimizing losses by lowering operating costs and increasingfees, eliminating unprofitable routes, and upgrading the fleet to larger, more fuel-efficient aircraft4. Enplanements grew at a 3.3 percent annual growth rate from 2010-2016, from 548 million to 665million, respectively, with significant expansion of ultra-low-cost carriers such as Spirit and Allegiant andcontinued growth on the mainline carriers5. Since 2015, domestic enplanements have outpaced the international market, however, this is projectedto change by 2018 as international demand increases with strengthening worldwide economic growth6. Commercial airlines experienced record profits in 2016 due to healthy demand and low energy costsChapter 4: Forecasts of Aviation Demand2018 Page 4-3
Current TrendsAccording to the FAA Aerospace Forecast Fiscal Years 2017-2037, there are three main trends that impactedaviation in 2016:1. Industry consolidation and restructuring2. Continued capacity discipline in response to external shocks3. Proliferation of ancillary revenuesAdditional trends in the national commercial service industry include economic cycles, oil price fluctuations,regulatory changes, a decline in the U.S. pilot population, and Air Traffic Control (ATC) changes.Industry Consolidation and RestructuringData shows there is a strong relationship between growth in enplanements and the U.S. GDP (FAA 2017),meaning the airline industry and commercial passenger traffic are significantly impacted by national economicupturns and downturns. As an example, the Great Recession from 2007 to 2009 had a substantial effect on thelevel of air traffic in the U.S. during that same timeframe and for several years beyond.Challenging economic times prompted several airline mergers and acquisitions over the past decade. U.S. airlineconsolidation and restructuring became commonplace after the Great Recession. Ten U.S. airlinemergers/acquisitions have occurred since 2009, as presented in Table 1.Table 1. Recent Airline Mergers and AcquisitionsAirlinesDate AnnouncedDate ClosedResulting EntityRepublic Airways / Midwest AirlinesRepublic Airways / Frontier ic AirwaysRepublic AirwaysDelta Air Lines / Northwest AirlinesPinnacle Airlines / Mesaba Airlines4/14/20087/1/201012/31/20097/1/2010Delta Air LinesPinnacle Airlines / Mesaba AirlinesUnited Airlines / Continental AirlinesSkyWest / Atlantic Southeast Airlines / ExpressJetSouthwest Airlines / Air Tran 05/2/2011United AirlinesSkyWest / SureJetSouthwest AirlinesUS Airways / AMR / American Airlines2/14/201312/9/2013American AirlinesAtlas Air / Southern AirAlaska Airlines / Virgin America1/19/20164/4/20164/7/201612/14/2016Atlas Air WorldwideAlaska AirlinesSource: Airlines.org 2017In 2005, there were 12 major mainline airlines in the U.S.; today there are six.2 The Alaska Airlines / VirginAmerica merger in 2016 made Alaska Airlines the fifth largest airline in the nation; and one of six legacy ormainline airlines — American, Delta, Southwest, United, Alaska/Virgin, and JetBlue — that control roughly 85percent of the domestic market, as measured by revenue passenger miles (RPMs).3 Generally, airlineconsolidations decrease competition, which can lead to higher passenger fares and service reductions as airlines2Mainline carriers are defined as those providing service primarily via aircraft with 90 or more seats. Regionals are defined as thoseproviding service primarily via aircraft with 89 or less seats and whose routes serve mainly as feeders to the mainline carriers.3A RPM is a fare-paying passenger transported one mile; the most common measure of demand for air travel. Sometimes measured asrevenue passenger kilometers (RPKs).Chapter 4: Forecasts of Aviation Demand2018 Page 4-4
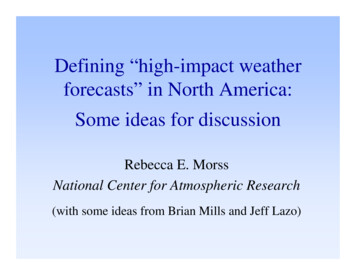
eliminate less-profitable routes. However, consolidations among smaller regional carriers can result in differentimpacts such as a reduction in fares as these airlines strive to compete with each other.Mainline carriers are also facing challenges brought by low-cost and ultra-low-cost carriers (LCC/ULCC) such asSpirit, Frontier, and Allegiant airlines and many new international carriers that are impacting global demand.These providers promise low base fares, but typically charge high fees for amenities such as baggage and food—a trend now emulated by many of the U.S. mainline carriers. LCCs/ULCCs focus their business models ontargeting specific routes underserved by the existing marketplace, reducing costs per available seat mile, andmaintaining extremely high levels of aircraft utilization. LCCs/ULCCs will continue to push mainline carriers toreduce flight costs and implement improvements to increase their competitive positions. As a result, demand forcommercial service is anticipated to rise, which will force airports to find new ways to increase passengerthroughout (FAA 2017).Continued Capacity DisciplineAs a result of the semi-recent industry consolidation and restructuring, airlines continue to maintain capacitydiscipline – making sure capacity doesn’t outweigh demand. To sustain a lean business practice and reboundfrom recent economic downfalls, airlines are doing their due diligence to ensure that their aircraft are running asclose to capacity as possible in an effort to earn maximum revenue per flight. Capacity discipline is measured byavailable seat mile (ASM), which according to the FAA Aerospace Forecast Fiscal Years 2017-2037, has increasedat an average rate of two percent per year since 2009.4 The mainline carrier group provided five percent morecapacity than it did in 2007 while carrying eight percent more passengers (FAA 2017).Ancillary RevenuesA recent outcome of the domestic and global economic downturn is the development of airline ancillaryrevenues. Ancillary revenue is revenue from non-ticket sources such as food and drink services, wirelessinternet, baggage, and in-flight entertainment. Prior to September 11, 2001 and the Great Recession, many airtravelers purchased tickets which included these amenities. The un-bundling of services has proven to be asuccessful tactic by the airlines to increase their bottom line. As ancillary revenues continue to generateincreased revenue, they will remain standard practice within the air travel experience (FAA 2017).Oil PricesOil is the largest operating expense for aircraft operators, and fluctuations in the oil and gas industry impact alltypes of aviation operations, both commercial and GA. Jet fuel prices comprise nearly three-quarters of airlineexpenses and as such, can impact air carriers’ choices in fleet mix, routes served, and ticket prices for end users.As shown in Figure 1, over the past 20 years, the price of oil has swung significantly from a low of 20.59/barrelin 1997 to a high of 99.67/barrel in 2008. Since 2008, oil prices have fluctuated but remained high until 2014when prices dropped below 50/barrel. The FAA Aerospace Forecast Fiscal Years 2017-2037 reports that theprice of oil is anticipated to rise from around 39/barrel in 2016 to 47 in 2017. Prices are then anticipated tocontinuously rise to exceed 100 by 2026 and approach 132 by the end of the 20-year forecast period.4An available seat mile ASM is defined as one seat transported one mile; the most common measure of airline seating capacity or supply.For example, an aircraft with 100 passenger seats, flown a distance of 100 miles, produces 10,000 ASMs. Sometimes measures as anavailable seat kilometer (ASK).Chapter 4: Forecasts of Aviation Demand2018 Page 4-5
However, it must also be noted that considerable uncertainty exists in the future of fuel costs given theworldwide geopolitical forces that impact its cost. 120Price Per Barrel 100 80 60 40 20 0Note: Years 2017 and 2018 are projectionsSource: Short-Term Energy Outlook – U.S. Energy Information Administration 2017Figure 1. Historical Oil PricesRegulatory ChangesRegulatory changes designed to make the country’s skies safer, more secure, and better able to meet currentdemands are impacting all facets of the aviation industry. Some, such as Open Skies agreements, are intended toreduce barriers to international air travel and commerce. Evolving customs and immigration rules are beingdesigned to facilitate legitimate travel while maintaining the highest standards of security and borderprotection. In recent years, the ATC system has faced intense scrutiny, with some officials advocating for theprivatization of the system. Whether privatized or remaining part of the FAA, ATC is also changing with NextGenimplementation and the potential integration of remote or virtual towers (RVTs). RVTs will require additionalregulatory changes and impact airport development needs.U.S. Pilot PopulationFor years, analysts have been anticipating an airline pilot shortage based on the changing federal requirementsand fewer numbers of trained pilots coming out of the military. Part of the shortage in experienced pilots can becredited to the recent increase in FAA pilot qualification requirements.5 In 2013, the FAA published a rulerequiring first officers—also known as co-pilots—to hold an Airline Transport Pilot (ATP) certificate, requiring1,500 hours of total time as a pilot. Previously, first officers were required to have only a commercial pilotcertificate, which requires 250 hours of flight time. This new requirement has discouraged many students from5Pilot Certification and Qualification Requirements for Air Carrier Operations, 78 F.R. § 42323 (2013).Chapter 4: Forecasts of Aviation Demand2018 Page 4-6
entering flight training programs due to the increased cost associated with the new training requirements or ledU.S. pilots to look for jobs with foreign airlines where flight-hour requirements are not as stringent.The pilot population is also still responding to a 2010 FAA regulatory change that increased duration of validityof student pilot certificates for those under the age of 40 years old from 36 months to 60 months (FAA 2017).The new regulation created an immediate increase in active student pilot licenses from 72,280 in 2009 to119,119 by the end of 2010. During that same period, active private pilot licenses decreased from 211,619 to202,020 and commercial licenses fell from 125,738 to 123,705 (U.S. Civil Airmen Statistics 2016). The studentpilot population has continued to increase year-over-year since that time, while private and commercial pilotpopulations continue to decline.Further, this inverse relationship between student and active pilots is not anticipated to reverse in the projectedfuture. According to the FAA Aerospace Forecasts Fiscal Years 2017-2037, the number of student pilotcertificates is anticipated to grow to 141,200 by 2037, while the populations of private and commercial pilots areanticipated to decline to 139,000 and 83,300, respectively. This indicates that new airmen are not matriculatinginto fully licensed pilots at a sufficient enough rate to maintain the existing pilot population in the U.S.Additionally, the industry is confronting waning interests in students interested in a career as a pilot due to higheducational costs, low salary expectations post-graduation, demanding travel schedules, and general industryupheaval since September 11, 2001. This issue is compounded by the declining availability of military-trainedpilots to meet the aviation industry’s growing needs. A 2014 Government Accountability Office (GAO) Report,Aviation Workforce – Current and Future Availability of Airline Pilots, notes that 70 percent of airline pilots hiredhad come from the military prior to 2001; and fewer than 30 percent are hired from the military today. This islikely a result of financial incentives for military pilots to stay in service longer, civil job market opportunities,and changing post-war military missions.Yet while many of these trends have challenged the aviation community, the FAA recently revised its stringentmedical clearance requirements for pilots. Prior to this change, pilots over 40 years old were required to pass acomprehensive medical exam once every two years, which deterred or prohibited aging pilots from obtainingand renewing their licenses. Recognizing the negative impact this strict regulation had on pilots and the aviationcommunity, Congress mandated the FAA to revise its existing medical clearance regulations in Section 2307 ofthe FAA Extension, Safety, and Security Act of 2016 (Public Law [PL] 114-190), Medical Certification of CertainSmall Aircraft Pilots. In response, the FAA implemented the alternative pilot physical examination and educationrequirements known as BasicMed to effectively re-open the sky to thousands of GA pilots across the U.S.Air Traffic ControlThe FAA operates the U.S. ATC system through a three-pronged system of local airport tower controllers,terminal radar approach control (TRACON), and regional air route traffic control centers, also known as enroutecenters. Originating in the 1960s, the FAA has received intense scrutiny for inefficiency and failing to keep pacewith modern technologies and airspace demands. While the FAA continues to implement the NextGen and othermodernization initiatives, critics argue that the agency has taken far too long. Agency supporters argue that theFAA has been crippled by inconsistent funding and automatic budget cuts enacted when Congress fails to passthe Federal budget known as sequestration. In March 2013, sequestration cuts forced the FAA to cut 42.9million from its operations budget and furlough air traffic controllers, leading to a week of severe traffic delays.Chapter 4: Forecasts of Aviation Demand2018 Page 4-7
The argument over the nation’s ATC most recently came to the forefront in June 2017 when President Trumpannounced his plan to privatize the nation’s ATC system. The President argues that he is “proposing reducedwait times, increased route efficiency, and far fewer delays,” while rectifying years of wasteful spending andmodernization delays that threaten the safety and security of the air system. Under the Trump proposal, aprivate, nonprofit corporation governed by a board of representatives primarily comprised of the major airlineswould take control of the management and operations of ATC in the U.S. The organization would be financedthrough user fees instead of tax dollars.Opponents of the Trump proposal argue that privatization will shift costs to passengers and place particularhardship on small, rural airports and the communities they serve. In 2016, Delta Air Lines published a studyentitled “The Costs of Privatizing Air Traffic Control and How It Will Impact Airline Travelers” that found thatprivatization could increase tickets costs by 20 to 29 percent after ten years and result in the closure of smallairports located outside of major urban centers (Delta 2016). The proposal has also received criticism for givingtoo much control of a key asset to special interests and major airlines. Mark Baker, President of the AircraftOwners Pilots Association (AOPA), said his organization would not support a plan that imposes fees on smallaircraft owners (Shepardson 2017). Opponents also argue that the proposal could limit business jet access toairports, create a national security risk, and fail to deliver the rapid modernization promised by the plan,particularly during the three-year transition period between FAA and private control.While the June 2017 Trump proposal is the latest iteration of the privatization approach, the idea is not new.ABC News reports a similar measure was defeated in 2016, even with the support of Airlines for America (A4A),the major lobbying group of the U.S. airline industry (Cook 2017). Perhaps more notably, the FAA alreadycontracts ATC services to some private sector at visual flight rule (VFR) airports through the Contract TowerProgram. According to the U.S. Contract Tower Association, a sub-committee of the American Association ofAirport Executive (AAAE), the program allows the FAA to provide ATC at a substantially reduced cost totaxpayers. As of 2017, 253 airports participate in the program (U.S. Contract Tower Association 2017).However, the President’s fiscal year (FY) 2017 budget proposal (released in February 2017) eliminated theguaranteed and dedicated funding language for the Contract Tower Program that had been included in theDepartment of Transportation (DOT)/FAA appropriations bills for FYs 2015 and 2016. Despite this initial threat,both the Senate and House approved 159 million in statutory bill language for the final DOT/FAA 2017Appropriations Bill. This amount will fund all existing contract towers, including the 16 towers in cost-shareprograms and offer the flexibility to add several new towers in FY 2017. The addition of contract towers providesa lower cost ATC option for VFR airports to guide VFR traffic.While contract towers lower costs and increase safety at certain airports, the impacts of privatizing all ATCservices in the U.S. are more complex and represent a major ideological difference about the role ofgovernment. President Trump’s proposal is one aspect of a broader plan to improve transportationinfrastructure in the U.S. and will require Congressional support and approval before any changes are witnessedat the FAA.Chapter 4: Forecasts of Aviation Demand2018 Page 4-8
Arizona Commercial Aviation TrendsImpacts from the national trends discussed in the previous section trickle down to the state level, impactingArizona’s aviation system both positively and negatively. A look at the historical and current trends impactingArizona’s aviation system is included below.Historical TrendsThe volatility in commercial service activity levels experienced nationally as a result of September 11, 2001 andthe Great Recession of 2007-2009 was also experienced at the state level in Arizona. Significant reductions inactivity levels were seen after both events, resulting in changes to airline service and structure to counteractreduced demand. Travelers to and from Arizona were faced with reduced flight routes and frequencies andhigher airfare in some cases.Current TrendsArizona’s commercial service airports are not immune to the trends impacting commercial aviation nationally.Airline consolidation has reduced competition among carriers, resulting in higher passenger fares and reducedroute options to Arizona’s airports, in some cases. On the plus side, smaller regional carriers are competing forpassengers and as such are reducing fares to remain competitive.Arizona’s commercial service airports are served by a variety of LCCs and ULCCs that provide air transportationto and from the state at reduced fares including Allegiant, Frontier, JetBlue, Southwest, Spirit, and Sun Country.A mix of mainline and LCCs/ULCCs allows a larger traveling population to reach the state, effectively increasingthe economic impact of tourism in Arizona.Some regional airlines that serve Arizona’s commercial service airports are particularly impacted by the shortagein pilots as many are being recruited by mainline carriers to replace their retiring pilots, leaving regional airlinesat a loss for pilots who can operate their standard scheduled service. Ultimately this has led to a reduction orcomplete loss of regional airline service if the regional airlines can’t backfill their pilot positions. Communitiesacross Arizona that are served exclusively by smaller regional airlines (such as Great Lakes) have been and maycontinue to be most impacted.The implementation of NextGen has many benefits. For commercial aviation specifically, certain elements allowpilots to fly closer together on more direct routes, decreasing wait times and fuel consumption. Quicker traveland reduced fares to the state may result over time from the implementation of NextGen. However, otherregulatory changes such as the proposed privatization of ATC may counteract these cost savings by increasingairfares to cover the operation of ATC facilities in Arizona.Chapter 4: Forecasts of Aviation Demand2018 Page 4-9
Arizona Commercial Service ForecastsEleven of the 67 SASP airports offer commercial service which includes all scheduled passenger flights and airtours. Data concerning activity levels of commercial service airports in Arizona is presented in the followingsections, including historical and projected enplanements, air carrier and air taxi/commuter aircraft operations,and based aircraft data. These data are reported annually to the FAA and the FAA publishes these data andprovides projections of activity for each airport in the TAF. It should be noted that forecasts of enplanements,operations, and based aircraft used in this Chapter are derived from the FAA TAF, however, for many of thecommercial service airports, 2016 FAA TAF data does not match the 2016 data identified during the inventoryprocess. For the purposes of the SASP Update, all commercial service forecasts are based on data reported bythe 2016 FAA TAF, with the 2016 survey data presented for reference.EnplanementsAn enplanement is defined as a passenger boarding a commercial service flight. The number of enplanements atcommercial service airports is heavily dependent on the overall health of the regional market area as well as theair carrier’s decisions to operate at an airport. Table 2 presents enplanements at the 11 commercial serviceairports in the state. According to FAA TAF growth rates, Page Municipal, Flagstaff Pulliam, and Phoenix-MesaGateway are forecasted to have the largest percentage increases in passenger enplanements through 2036,followed by Phoenix Sky Harbor International and Tucson International. Alternatively, Grand Canyon NationalPark is projected to slightly decrease while Ernest A. Love Field, Laughlin/Bullhead City International, and TucsonInternational are projected to experience the smallest percentage increases in passenger enplanements over theplanning horizon. Three airports, Yuma International, Show Low Regional, and Grand Canyon West, areprojected to maintain their current level of passenger enplanements over the 20-year timeframe.Table 2. Enplanement Projections for Arizona’s Commercial Service AirportsAssociatedCityBullhead City2016SurveyDataAirport NameForecasts2016(TAF 133,559159,9201.81%FlagstaffLaughlin/Bullhead City
resultant economic impact has become an indicator of economic health in the state. The Great Recession caused a decline in tourism between 2007 and 2009 but tourism levels have since recovered. Summary of Anticipated Impact Trends Overall, Arizona was rapidly increasing in population and economy until the Great Recession from 2007-2009.