Transcription
Committee on Health Careofthe Oregon Legislative AssemblyMental HealthProvider ReimbursementCarrier Data CallAs required by 2017 Senate Bill 860Volume I - Background and Executive SummaryPrepared for:Oregon Department of Consumer andBusiness ServicesDivision of Financial RegulationMarch 31, 2020Report by: Risk & Regulatory Consulting, LLCwww.riskreg.com
Table of ContentsBACKGROUND . 2EXECUTIVE SUMMARY . 5CARRIER CONFIDENTIALITY . 23PROCEDURE CODES SUBJECT TO REVIEW . 24CARRIER PLANS AND MARKETS . 27TRENDING ANALYSIS SUMMARY . 29GLOSSARY OF TERMS AND ACRONYMS. 34iREVISED FINAL
BackgroundThis report (Report) was drafted in coordination with the Division of Financial Regulation (DFR or Division),of the Oregon Department of Consumer and Business Services (DCBS or Department), pursuant to therequirements of Senate Bill 860 (SB 860). SB 860 requires the Department to examine and adopt rules ortake other actions based upon the results of the Department’s examination to ensure that carriers meet therequirements of Oregon Revised Statutes (ORS) 743A.168 and 743B.505 in policies, certificates or contractsfor health insurance that the carriers offer to residents of Oregon. The Department examined the following:(a) The historical trends of each carrier’s maximum allowable reimbursement rates for time-basedoutpatient office visit procedural codes and whether each carrier’s in-network behavioral mentalhealth providers have been paid reimbursement that is equivalent to the reimbursement for thecarrier’s in-network medical providers and mental health providers with prescribing privileges.(b) Whether each carrier imposes utilization management procedures for behavioral mental healthproviders that are more restrictive than the utilization management procedures for medical providersas indicated by the time-based outpatient office visit procedural codes applied to providers in eachcategory, including a review of whether a carrier restricts the use of longer office visits for behavioralmental health providers more than for medical providers.(c) Whether each carrier pays equivalent reimbursement for time-based procedural codes for both innetwork behavioral mental health providers and in-network medical providers, including thereimbursement of incremental increases in the length of an office visit.(d) Whether the methodologies used by each carrier to determine the carrier’s reimbursement rateschedule are equivalent for in-network behavioral health1 providers and in-network medicalproviders.In accordance with the requirements of SB 860, Section 1, Subsections (2)(a) – (d), the Division commenceda data call (Data Call) of 11 health carriers (Carriers) transacting business in the state of Oregon for thereview period of January 1, 2015 through June 30, 2018 (Period of Review). The Data Call included fullyinsured individual, small group and large group health benefit plans issued in Oregon, as well as studenthealth benefit plans and associations. The Data Call consisted of two sections for the purpose of collectingand analyzing information and data to address the requirements of SB 860. Section One of the Data Call,Policies, Procedures, and Methodologies, requested the following information from the Carriers:(a) Part One -- Reimbursement methodology and equations(b) Part Two – Negotiation process for in-network outpatient services, and(c) Part Three – Utilization management for in-network outpatient servicesWhile parts (a) through (c) mention “behavioral mental health providers” and part (d) references “behavioral health providers” the term“behavioral health” refers to both mental health and substance use disorder treatment, so the two provider descriptions are equivalent in theirmeaning.12REVISED FINAL
Section Two of the Data Call, Data Collection for In-network Outpatient Services, requested the followingdata:(a)(b)(c)(d)(e)Part One – Reimbursement allowancesPart Two – Membership and providersPart Three – Utilization and final dispositionPart Four – ModifiersPart Five – In-network, outpatient time-based office visit/serviceThe Data Call was submitted to the Carriers and required a written response to 24 questions and numericresponses to 15 categories of questions. The analysis included the review of policies, procedures andmethodologies relating to the development and setting of the Carriers’ Maximum Allowable ReimbursementRates (MARR) for 35 different CPT2 or procedure codes, across eight different provider types, among 22health plans (Plans) for 11 different health carriers. The 35 CPT codes were specified time-based outpatientoffice visit procedure codes based upon provider contracts for each year in the Period of Review. Over190,000 data points were collected and analyzed. In addition, subsequent to the submission of the Data Callto the Carriers, the DCBS received 53 different questions from Carriers, the responses to which werecompiled and shared with all Carriers. DCBS also received numerous requests for extensions of thesubmission of data requests, which DCBS managed on a case-by-case basis.As noted above, the Data Call requested information regarding provider reimbursement policies, procedures,methodologies, equations and other information regarding the creation of MARR and reimbursement rateschedules by provider type, including the negotiation process. The Data Call requested MARRs for the 35procedure codes based on actual provider contracts. Accordingly, examination values and analysis withinthis Report are based upon the carrier’s maximum allowable reimbursement contract rates.Relative to the MARR negotiation process for in-network outpatient services, information was requestedregarding the factors considered during the rate setting process and in negotiating maximum allowablereimbursement rates with providers for the in-network time-based outpatient services. Specific requests weremade regarding how MARR was developed, calculated, negotiated, any factors and standards considered(i.e., evidentiary standards) and how the carrier operationalizes the process for establishing maximumallowable reimbursement rates.Utilization management (UM) policies and procedures were requested specific to prior authorizations,concurrent reviews, retrospective reviews and outlier management. In addition, the factors considered whendesigning prior authorizations, concurrent reviews, retrospective reviews and outlier management forparticipating providers in an outpatient office-based setting were also requested. The Data Call consideredthe Carrier’s use of third party entity for UM services. While a carrier may retain a third party entity to providecertain benefit administration services, the carrier cannot delegate its responsibility to comply with federaland state laws – the carrier is ultimately responsible for its compliance. In addition, a comprehensive listingof the treatment limitations (i.e., utilization management, code edits, provider-specific restrictions andcredentialing) was requested which were applied to outpatient time-based office visits/services.“CPT” means Current Procedural Terminology codes and terminology under the American Medical Association’s Current ProceduralTerminology (CPT 2018), Edition Revised, 2018, for billing by medical providers.23REVISED FINAL
Finally, as part of the Data Collection section of the Data Call, the following data was requested:(a) The number of members in commercial health benefit plans issued in Oregon, defined as the totalnumber of members for each plan type available during the Period of Review, not the number ofprimary insureds. The data call also requested the number of Medical Providers, Behavioral MentalHealth Providers and Mental Health Providers, with prescribing privileges, available to Oregon planmembers.(b) The utilization management results indicating the number of times the procedure codes werereceived by the Carriers and the number of times the procedure codes were processed to pay perplan and per year during the Period of Review.(c) Each carriers’ use of modifiers during the rate setting process and how the carrier determines theamount for each procedure code and modifier combination and equations to determine professionalreimbursement.The provider types listed in SB 860 and subject to this review include:(a) Behavioral Mental Health Providers (BH Providers)1. Psychologist licensed under ORS 675.010 to 675.1502. Clinical Social Worker (LCSW) licensed under ORS 675.5303. Professional Counselor (LPC) or Marriage Family Therapist (LMFT) licensed under ORS675.715(b) Medical Providers means a physician licensed under ORS chapter 6771. Doctor of Medicine (MD)2. Doctor of Osteopathic Medicine (DO)(c) Mental Health Providers with prescribing privileges (MH Providers)1. Psychiatrist licensed under ORS chapter 6772. Certified Nurse Practitioner (NP)* licensed under ORS 678.3753. Certified Psychiatric and Mental Health Nurse Practitioner (PMHNP) licensed under ORS678.375, ORS 678.390 and OAR 851-050-0005(9)(k)*Upon agreement with the Division, Certified Nurse Practitioner was included as a Mental Health Provider.This Report is organized in eight volumes as follows:Volume I – Background and Executive SummaryVolume II -- Section A – Historical Trends in Maximum Allowable Reimbursement RatesVolume III – Section B – Utilization Management ProceduresVolume IV – Section C – Time-based Procedure Code Maximum Allowable Reimbursement Rate AnalysisVolume V – Section D -- Maximum Allowable Reimbursement Rate MethodologyVolume VI – Appendix A -- Carriers and Plans Maximum Allowable Reimbursement RatesVolume VII – Appendix B -- Behavioral Health Providers Maximum Allowable Reimbursement Rates as aPercentage of Medical Provider RatesVolume VIII – Appendix C -- Carriers and Plans Procedure Code Utilization4REVISED FINAL
Risk & Regulatory Consulting, LLC (Contractor) was engaged by the Department to collect and analyze thedata received from the Carriers as noted above. The Contractor evaluated the reasonableness of the dataprovided by the Carriers and made further inquiries of carriers as deemed necessary. In addition, uponagreement with the Division, an attestation was obtained from the Carriers confirming the accuracy,completeness and integrity of the data provided to the Department. The Contractor did not independentlyverify the Carriers’ data and did not perform any verification procedures to determine compliance with thestated policies and procedure provided by the Carriers; therefore, the Contractor makes no representationsregarding the accuracy and integrity of the data and information submitted by the Carriers. Contractorpersonnel participated in this engagement in their capacity as Market Conduct Examiners under the directionand supervision of the Department. The Contractor provides no representations regarding questions of legalinterpretation or opinion, which is the sole responsibility of the Department.Executive SummaryThe analysis performed by the Contractor in the Report provides a macro view of the Carriers and Plans asit relates to SB 860, Section 1, Subsections (2)(a) – (2)(d), as stated in the Background section above.Sections A through D of this Executive Summary present the aggregated analysis of over 190,000 data pointscollected via a Data Call and analyzed by the Contractor. The Contractor’s scope of the engagement withthe Department was to analyze, summarize and trend the Carriers’ data points and information. The analysis,summaries and observations in the Report are based solely on the Carriers’ data. As such, the Contractorprovides no conclusion or determination of facts of the Carriers’ compliance with Oregon or Federal laws. Abrief overview of Sections A through D is described below.Section A – Historical Trends in Maximum Allowable Reimbursement RatesAs noted above, SB 860, Section 1, Subsection (2)(a) addresses the historical trends of each carrier’sMARRs for time-based outpatient office visit procedural codes and whether each carrier’s in-network BHProviders have MARRs that are equivalent3 to the reimbursement to the carrier’s in-network MedicalProviders and MH Providers. In order to perform this analysis, the Contractor reviewed the MARRs byprovider type for each of the 35 procedure codes reported by each of the 11 carriers for their respective 22plans.In summary, in 20 of the 22 plans, the MARRs reported by each carrier for each procedure for BH Providersvaried from the MARRs reported for Medical Providers and MH Providers. The aggregated analysis inSection A of this Report (Volume II) illustrates such variances in MARRs. Section A is segmented byprocedure code and includes MARR information for each of the 22 plans followed by the Contractor’s analysisby carrier. For example, for procedure code 90832, Psychotherapy – 30 minutes, the analysis providesinformation regarding the MARR by provider type and historical trend information regarding annual MARRchanges by provider type.For purposes of this Report, “equivalent” is defined as within 1% of the Medical Provider or MH Providers’ maximumallowable reimbursement rate.35REVISED FINAL
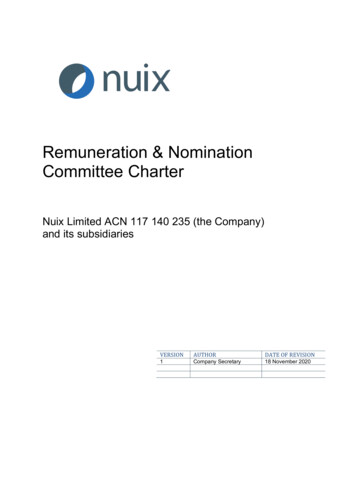
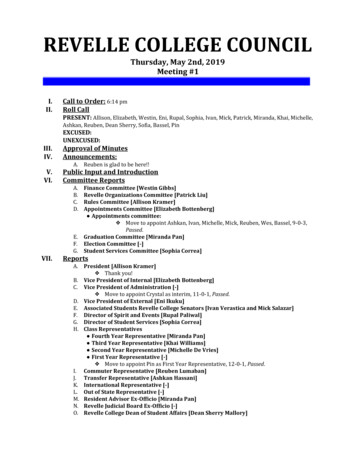
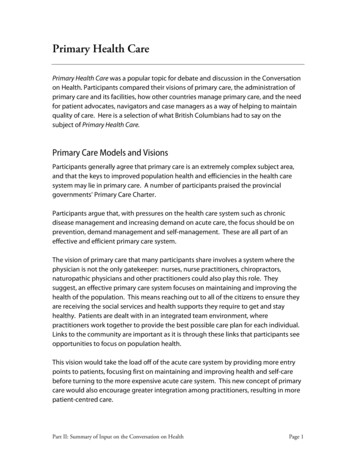
The following analysis summarizes the Contractor’s review of the 35 procedure codes for MARRs reportedby the Carriers for each of the 22 plans during the Period of Review. This analysis illustrates numerousinstances in which BH Providers’ MARRs were not equivalent with Medical Providers and MH Providers’MARRs during the Period of Review. In addition, the analysis illustrates that in many instances, BH Providers’annual rate increases were not equivalent with Medical Providers and MH Providers’ annual rate increases.This analysis illustrates numerous instances in which BH Providers’ MARRs were not equivalent with MedicalProviders and MH Providers’ annual rate increases were not equivalent with Medical Providers and MHProviders’ annual rate increases. Additional details regarding specific procedure codes and plans is locatedin Volume II (Section A), Volume VI (Appendix Charts A1 to A140) and Volume VII (Appendix Charts B1 toB140).Report Chart 1 below provides a snapshot of the average MARRs by provider type for the 35 procedurecodes and 22 plans during the Period of Review. Based upon Report Chart 1, the following was noted: For 34 of 35 (97%) procedure codes, the average MARRs for BH Providers was lower and notequivalent with the average MARRs for Medical Providers. For 1 of 35 (3%) procedure codes, the average MARRs for the BH Providers was higher than andnot equivalent with the average MARRs for Medical Providers. For 28 of 35 (80%) procedure codes, the average MARRs for the BH Providers was lower and notequivalent with the average MARRs for MH Providers. For 7 of 35 (20%) procedure codes, the average MARRs for one of more of the BH Providers werethe same, equivalent or varied from the average MARRs for one or more MH Providers.o Procedure code 90837: The Psychologists’ average MARR was higher and notequivalent with the average MARRs of the NPs but lower than Psychiatrists or PMHNPs.The LCSWs and LPC/LMFTs‘ MARRs were lower and not equivalent with MH Providers’average MARRs.o Procedure code 90863: The BH Providers’ average MARRs was the same as theMARRs for MH Providers.o Procedure code 90875: The Psychologists’ average MARR was equivalent to theaverage MARR of the NPs but lower than Psychiatrists or PMHNPs. The LCSWs andLPC/LMFTs‘ MARRs was lower and not equivalent with the MH Providers’ averageMARRs.o Procedure code 96101: The Psychologists’ average MARRs was higher and notequivalent with the average MARRs of the NPs and PHMNPs but lower thanPsychiatrists. The LCSWs and LPC/LMFTs‘ MARRs was lower and not equivalent withthe MH Providers’ average MARRs.o Procedure code 96118: The Psychologists’ average MARR was higher and notequivalent with the average MARRs of the MH Providers. The MARRs of the LCSWsand LPC/LMFTs were lower and not equivalent with MH Providers’ average MARRs.o Procedure code 96150: The Psychologists’ average MARR was higher and notequivalent with the average MARR of the NPs and PMHNPs and lower and not6REVISED FINAL
equivalent with the Psychiatrists. The MARRs of the LCSWs and LPC/LMFTs werelower and not equivalent with the MH Providers’ average MARRs.o Procedure code 99202: The LCSWs average MARR was equivalent to the average MARR of thePsychiatrists but lower and not equivalent with the average MARRs of the NPsand PMHNPs. The LPC/LMFTs average MARR was lower and not equivalent with the averageMARRs of NPs and PMHNPs and higher and not equivalent with the averageMARR of Psychiatrists. The Psychologists’ average MARR was lower and not equivalent with theaverage MARRs of MH Providers.7REVISED FINAL
Report Chart 1 - Average Maximum Allowable Reimbursement Rate - By Provider Type andProcedure Code - During the Period of ReviewProcedureBehavioral Mental Health Providers(No Prescribing Privileges)ProcedureTimeCode(Minutes) Psychologist9083230 106.259083330 91.089083445 163.649083645 131.639083760 217.259083860 169.299083930 211.559084060 88.059084650 167.589084750 185.4090863N/A 52.569087530 107.099087645 179.049610160 154.089610260 111.749611660 171.379611860 206.669615015 42.929615115 36.219615215 36.749615315 23.129615415 34.909615515 42.549920110 68.379920220 117.389920330 117.199920445 189.079920560 240.39992115 34.209921210 70.069921315 99.299921425 130.379921540 171.779935460 183.869935530 175.70Medical Doctorswith Prescribing selor (LPC) / Doctor ofSocialLicensed Marriage OsteopathicWorkerFamily TherapistMedicine(LCSW)(LMFT)(DO) 95.22 88.34 151.58 75.25 74.52 155.74 138.19 130.75 205.58 109.22 109.97 200.18 169.58 170.48 291.62 145.16 143.39 269.40 165.97 166.75 337.28 78.52 78.29 167.60 127.33 129.97 239.26 150.44 147.18 254.27 52.56 52.56 63.18 89.27 89.27 157.60 148.35 149.04 267.88 122.03 116.95 197.32 109.08 109.17 167.46 152.25 152.25 229.06 159.78 157.75 241.09 38.93 32.82 59.12 31.18 31.34 47.54 32.14 31.60 48.71 24.79 24.14 10.76 31.80 31.80 51.85 36.86 36.78 52.97 43.85 43.85 117.81 130.11 132.53 208.05 125.94 125.94 308.53 176.18 176.18 452.80 225.60 225.60 544.39 36.13 36.89 86.84 80.72 80.72 127.61 91.87 89.10 217.51 120.26 117.63 318.12 161.81 161.81 411.91 178.97 177.98 255.31 161.36 164.38 247.058REVISED FINALMental Health Providerswith Prescribing PrivilegesDoctor ofNurseMedicine Practitioner(MD)(NP)Psychiatrist 147.24 119.43 127.42 149.91 105.91 123.02 203.65 170.14 182.05 196.80 143.07 166.63 293.40 214.81 237.80 270.42 190.92 206.51 337.28 262.52 283.00 167.60 115.21 124.29 238.01 186.08 200.05 250.77 202.85 214.83 61.48 52.56 52.56 157.60 107.46 120.05 267.88 181.32 198.27 198.47 145.64 157.90 167.46 132.85 129.99 226.28 183.54 190.29 232.31 195.52 194.79 59.07 42.32 45.93 47.15 39.97 43.86 48.47 38.15 41.72 10.76 25.83 25.20 51.85 38.98 41.08 52.97 49.36 49.79 121.29 102.39 92.74 214.14 158.78 129.81 317.30 208.85 192.59 455.72 316.24 301.99 558.05 372.82 371.68 92.37 68.95 73.09 136.22 96.88 95.16 226.59 147.93 146.18 316.16 210.76 215.13 413.48 272.14 267.72 252.04 200.77 212.10 242.24 202.02 219.07Psychiatricand MentalHealth NursePractitioner(PMHNP) 120.04 113.28 173.09 155.57 219.40 202.72 262.80 115.56 188.34 205.71 52.56 110.11 186.71 151.76 133.58 183.54 197.67 41.94 39.97 37.94 25.83 38.98 49.36 99.11 138.00 181.99 287.13 352.58 68.65 90.35 136.41 198.50 251.18 201.01 189.02
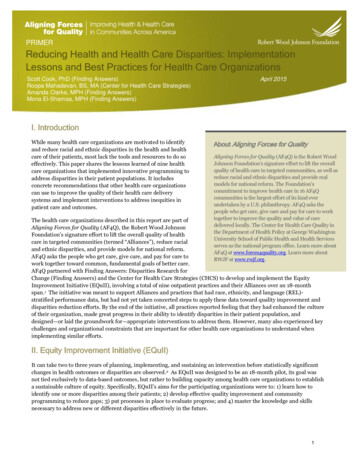
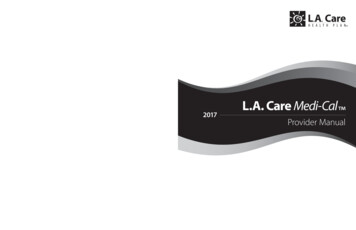
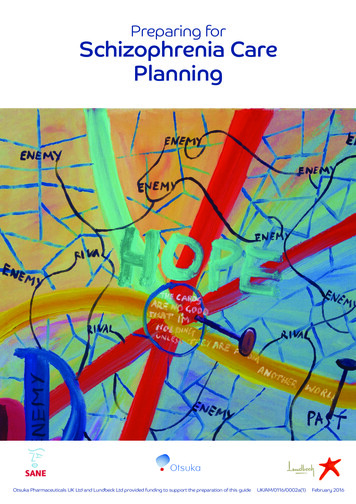
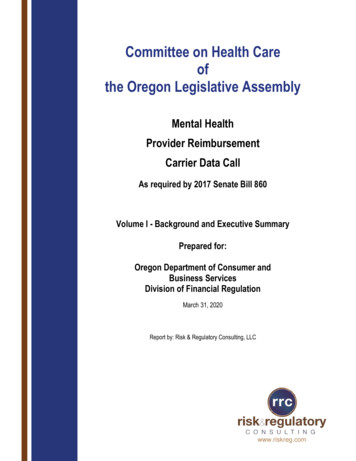
Report Charts 2 - 9 below provide a snapshot of the average MARRs by provider for the 35 procedurecodes during the Period of Review including the average MARR change between 2015 to 2018. Theaverage MARR change for each provider was as follows:BH Providers: Psychologists: 2% from 2015 to 2016, 5% from 2016 to 2017 and 1% from 2017 to 2018 LCSWs: 4% from 2015 to 2016, 3% from 2016 to 2017 and 0% from 2017 to 2018 LPC/LMFTs: 3% from 2015 to 2016, 3% from 2016 to 2017 and 2% from 2017 to 2018Medical Providers: DOs: 1% from 2015 to 2016, 1% from 2016 to 2017 and 4% from 2017 to 2018 MDs: 2% from 2015 to 2016, 0% from 2016 to 2017 and 4% from 2017 to 2018MH Providers: NPs: 2% from 2015 to 2016, 4% from 2016 to 2017 and 0% from 2017 to 2018 Psychiatrists: 1% from 2015 to 2016, 1% from 2016 to 2017 and 2% from 2017 to 2018 PMHNPs: 2% from 2015 to 2016, 3% from 2016 to 2017 and 0% from 2017 to 20189REVISED FINAL
Report Chart 2 - Average Maximum Allowable Reimbursement Rate for Psychologists by ProcedureCode and 5151515151510203045605101525406030Average Maximum Reimbursement Rate by Year2015 99.08 82.65 159.17 120.68 220.71 154.09 209.44 86.85 154.99 170.33 78.90 111.56 183.47 152.72 111.25 169.63 250.94 35.86 33.97 34.45 22.68 33.73 38.54 62.16 107.26 108.51 180.62 212.58 30.51 62.19 88.17 116.46 166.14 157.95 171.022016 99.58 83.39 148.61 121.06 213.36 158.02 213.05 87.94 159.35 176.32 45.00 111.52 183.69 153.12 114.22 166.94 190.85 37.61 35.18 35.86 22.68 34.78 39.98 63.60 109.28 110.29 188.36 258.32 34.74 71.72 97.70 138.33 171.70 177.50 172.532017 112.54 96.99 170.87 142.10 216.62 180.84 210.16 91.00 177.29 196.54 30.00 101.68 173.71 155.56 111.34 176.76 188.93 53.23 37.40 37.15 23.57 35.20 45.46 73.30 125.64 124.29 194.62 242.31 35.43 73.64 100.65 128.60 174.28 182.22 177.682018 113.46 100.20 175.17 144.32 218.16 184.23 213.31 86.37 177.65 197.96 30.00 103.60 176.01 154.74 110.27 172.07 193.58 44.35 38.10 39.39 23.58 35.77 46.18 74.43 127.34 125.68 196.23 244.78 36.13 74.76 109.24 136.76 176.07 218.18 181.59Year-Over-Year Percentage2015 %0%3%4%2%2%2%4%22%14%15%11%19%3%12%1%2016 ISED FINAL2017 Mean2018(Average)1% 106.173% 90.813% 163.462% 132.041% 217.212% 169.292% 211.49-5% 88.040% 167.321% 185.290% 45.982% 107.091% 179.22-1% 154.04-1% 111.77-3% 171.352% 206.08-17% 42.762% 36.166% 36.710% 23.132% 34.872% 42.542% 68.371% 117.381% 117.191% 189.951% 239.502% 34.202% 70.589% 98.946% 130.041% 172.0520% 183.962% 175.70Trend Analysis, 2015-2018EstimatedTrend LineStandardSlopeGeneralDeviation(LeastTrendof theSquaresDirectionMeanMethod) (Up/Down) 7.905.610Up 9.096.626Up 11.997.026Up 12.939.195Up 3.07(0.439)Down 15.4311.323Up 1.980.873Up 2.080.163Up 11.858.591Up 14.0410.311Up 23.06(16.170)Down 5.20(3.371)Down 5.12(3.238)Down 1.340.852Up 1.70(0.581)Down 4.171.713Up 29.97(17.399)Down 7.884.108Up 1.921.461Up 2.101.611Up 0.520.359Up 0.860.655Up 3.842.841Up 6.384.650Up 10.577.659Up 9.056.551Up 7.095.308Up 19.288.058Up 2.531.754Up 5.733.964Up 8.696.614Up 10.015.119Up 4.333.236Up 25.1218.543Up 4.853.684Up
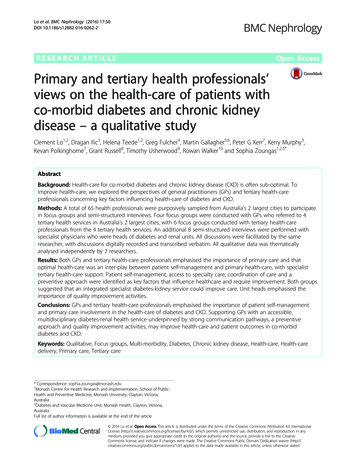
Report Chart 3 - Average Maximum Allowable Reimbursement Rate for LCSWs by Procedure Codeand 5151515151510203045605101525406030Average Maximum Reimbursement Rate by Year2015 89.80 70.11 128.90 103.26 169.48 141.45 164.96 78.90 122.69 146.06 78.90 91.46 145.60 120.47 111.89 149.91 154.55 32.28 30.65 30.63 24.29 31.08 36.02 40.02 120.14 117.10 163.58 203.79 31.66 74.56 76.81 101.77 146.21 163.44 159.942016 101.18 71.81 140.09 107.38 165.56 140.69 167.63 78.32 128.55 146.53 45.00 91.86 147.84 122.66 111.39 150.72 162.62 35.21 31.29 33.11 24.92 31.78 37.15 41.10 123.17 119.32 165.90 228.74 37.40 81.43 91.33 125.31 164.36 165.63 161.452017 94.70 78.43 137.91 112.10 167.67 147.97 165.10 78.44 129.11 157.83 30.00 86.19 149.03 121.68 106.64 153.58 159.49 51.77 31.05 33.23 24.97 32.10 37.04 46.72 142.14 132.80 186.62 233.40 38.32 82.25 97.61 125.57 167.21 171.16 160.282018 94.62 79.95 145.78 114.32 175.98 150.16 165.98 78.44 128.82 151.36 30.00 87.58 150.95 123.13 106.39 154.81 161.51 35.01 31.75 31.61 24.99 32.23 37.18 47.57 133.38 134.53 188.63 236.49 39.36 84.64 98.61 128.41 169.44 206.49 163.45Year-Over-Year Percentage2015 3%2%3%3%3%2%1%12%18%9%19%23%12%1%1%2016 -1%0%0%1%0%14%15%11%12%2%2%1%7%0%2%3%-1%11REVISED FINAL2017 Mean2018(Average)0% 95.072% 75.086% 138.172% 109.265% 169.671% 145.071% 165.920% 78.530% 127.29-4% 150.440% 45.982% 89.271% 148.351% 121.990% 109.081% 152.251% 159.54-32% 38.572% 31.19-5% 32.140% 24.790% 31.800% 36.852% 43.85-6% 129.701% 125.941% 176.181% 225.603% 36.693% 80.721% 91.092% 120.261% 161.8121% 176.682% 161.28Trend Analysis, 2015-2018EstimatedTrend LineStandardSlopeGeneralDeviation(LeastTrendof theSquaresDirectionMeanMethod) (Up/Down) 4.670.796Up 4.843.615Up 7.014.844Up 4.943.792Up 4.502.161Up 4.713.343Up 1.230.052Up 0.26(0.126)Down 3.081.894Up 5.482.722Up 23.06(16.170)Down 2.82(1.732)Down 2.241.723Up 1.180.701Up 2.97(2.126)Down 2.321.756Up 3.571.775Up 8.902.473Up 0.460.306Up 1.250.307Up 0.340.214Up 0.520.378Up 0.550.336Up 3.842.827Up 10.045.870Up 9.006.578Up 13.289.590Up 14.8910.277Up 3.452.404Up 4.333.108Up 10.057.168Up 12.418.020Up 10.607.254Up 20.1413.468Up 1.590.939Up
Report Chart 4 - Average Maximum Allowable Reimbursement Rate for LPC/LMFTs by ProcedureCode and 5151515151510203045605101525406030Average Maximum Reimbursement Rate by Year2015 81.30 70.11 124.02 103.26 165.94 136.12 161.29 77.33 121.66 133.68 78.90 91.46 145.60 111.13 111.89 149.91 154.55 32.21 30.69 31.94 24.29 31.08 36.02 40.02 120.14 117.10 163.58 203.79 32.49 74.56 76.81 104.78 146.21 163.44 159.942016 86.11 71.81 126.08 110.17 160.85 140.69 169.57 77.95 123.74 136.37 45.00 91.86 147.84 121.13 111.26 150.72 155.45 33.97 31.35 30.78 23.79 31.78 36.87 41.10 123.17 119.32 165.90 228.74 37.40 81.43 91.33 125.31 164.36 165.63 161.452017 89.84 77.25 137.42 112.10 177.12 147.17 165.18 78.44 140.67 163.23 30.00 86.19 151.22 115.63 106.64 153.58 159.49 33.04 31.56 32.35 23.56 32.10 37.04 46.72 142.14 132.80 186.62 233.40 38.32 82.25 93.50 115.72 167.21 171.16 166.302018 96.08 78.91 135.15 114.32 177.90 149.56 170.84 79.41 134.34 156.11 30.00 87.58 150.95 123.13 106.39 154.81 161.51 32.20 31.75 31.21 24.99 32.23 37.18 47.57 144.68 134.53 188.63 236.49 39.36 84.64 94.75 128.41 169.44 211.68 169.83Year-Over-Year Percentage Change2015 2%2%2%3%3%2%1%12%15%9%19%20%12%1%1%2016 1%5%-1%1%0%14%15%11%12%2%2%1%2%-8%2%3%3%12REVISED FINAL2017 %0%0%2%2%1%1%1%3%3%1%11%1%24%2%Mean(Average) 88.33 74.52 130.67 109.96 170.45 143.39 166.72 78.28 130.10 147.35 45.98 89.27 148.90 117.76 109.04 152.25 157.75 32.86 31.34 31.57 24.16 31.80 36.78 43.85 132.53 125.94 176.18 225.60 36.89 80.72 89.10 118.55 161.81 177.98 164.38Trend Analysis, 2015-2018EstimatedTrend LineStandardSlopeGeneralDeviation(LeastTrendof theSquaresDirectionMeanMethod) (Up/Down) 6.244.807Up 4.223.185Up 6.614.474Up 4.783.513Up 8.415.215Up 6.124.678Up 4.362.425Up 0.880.673Up 8.975.494Up 14.569.414Up 23.06(16.170)Down 2.82(1.732)Down 2.681.942Up 5.443.051Up 2.94(2.113)Down 2.321.756Up 3.302.492Up 0.84(0.096)Down 0.460.340Up 0.70(0.062)Down 0.630.187Up 0.520.378Up 0.520.364Up 3.842.827Up 12.679.261Up 9.006.578Up 13.289.590Up 14.8910.277Up 3.042.155Up 4.333.108Up 8.315.601Up 10.666.132Up 10.607.254Up 22.7015.025Up 4.533.452Up
Report Chart 5 - Average Maximum Allowable Reimbursement Rate for DOs by Procedure Code 6015151515151510203045605101525406030Average Maximum Reimbursement Rate by Year2015 153.38 140.53 200.53 183.30 288.08 264.04 346.12 173.26 224.21 249.45 78.90 162.27 260.06 196.94 170.95 223.15 235.09 58.39 44.45 45.39 10.56 50.89 55.09 114.03 193.25 291.07 426.29 520.59 96.54 121.00 196.94 314.10 391.15 243.12 237.642016 145.66 152.42 200.98 200.75 285.57 267.71 330.34 165.60 224.70 240.74 45.00 155.73 268.16 193.46 170.83 228.26 238.28 62.87 49.19 48.74 10.23 53.47 51.84 122.00 212.47 315.31 454.66 547.08 110.08 134.26 211.24 323.42 406.86 229.92 229.622017 148.87 160.14 209.40 205.53 291.98 269.23 333.59 164.48 251.81 260.79 30.00 154.38 267.93 197.02 163.42 229.90 243.43 59.38 48.54 50.02 11.11 48.83 50.48 119.68 218.62 317.79 470.00 561.69 77.28 132.89 245.86 324.02 422.47 252.83 261.262018 159.85 167.68 210.71 211.16 300.49 276.61 339.08 167.06 258.15 267.78 69.81 158.03 275.38 202.35 164.65 234.93 247.57 55.83 48.14 50.67 11.20 54.84 55.10 116.04 208.10 309
this Report are based upon the carrier's maximum allowable reimbursement contract rates. Relative to the MARR negotiation process for in-network outpatient services, information was requested . Certified Nurse Practitioner (NP)* licensed under ORS 678.375 3. Certified Psychiatric and Mental Health Nurse Practitioner (PMHNP) licensed under ORS