Transcription
Received: 21 August 2019 Revised: 31 January 2020 Accepted: 1 February 2020DOI: 10.1111/eff.12539ORIGINAL ARTICLEEcology and movement of juvenile salmonids in beaverinfluenced and beaver-free tributaries in the Trøndelagprovince of NorwayRachel L. Malison Duncan J. HalleyNorwegian Institute for Nature Research,Trondheim, NorwayCorrespondenceRachel L. Malison, Flathead Lake BiologicalStation, 32125 Bio Station Lane, Polson, MT59860, USA.Emails: ing informationMarie Curie International IncomingFellowship, Grant/Award Number: 624557;Norwegian Institute for Nature Research;Fylkesmannen i Nord-TrondelagAbstractThere is concern that expanding beaver (Castor fiber) populations will negativelyimpact the important economic, recreational and ecological resources of Atlanticsalmon (Salmo salar) and sea trout (Salmo trutta) populations in Europe. We studiedhow beaver dams influenced habitat, food resources, growth and movement of juvenile Atlantic salmon and trout on three paired beaver-dammed and beaver-free(control) tributaries of important salmon rivers in central Norway. Lotic reaches ofbeaver-dammed and control sites were similar in habitat and benthic prey abundance,and ponds were small ( 3,000 m2). Though few juvenile salmonids were detected inponds, trout and salmon were present in habitats below and above ponds (comprising 9%–31% and 0%–57% of the fish collected respectively). Trout dominated controlsites (79%–99%), but the greatest proportion of Atlantic salmon were upstream ofbeaver ponds (0%–57%). Growth rates were highly variable, with no differences ingrowth between lotic reaches of beaver-dammed and control sites. The condition anddensities of juvenile salmon and trout were similar in lotic reaches of beaver-dammedand control sites, though one beaver-dammed site with fine sediment had very fewjuvenile salmonids. Beaver dams did not block the movement of juvenile salmonids ortheir ability to use upstream habitats. However, the degree of repeated movementsand the overall proportion of fish moving varied between beaver-dammed and control sites. The small scale of habitat alteration and the fact that fish were able to movepast dams makes it unlikely that beaver dams negatively impact the juvenile stage ofsalmon or trout populations.KEYWORDSAtlantic salmon, beaver ponds, Eurasian beaver, rearing habitat, salmonid movement, trout1 I NTRO D U C TI O Nto Spain (Butler, Radford, Riddington, & Laughton, 2009; Elliott,1989; Hendry & Cragg-Hine, 2003; Radford, Hatcher, & Whitmarsh,Atlantic salmon (Salmo salar) and sea trout (Salmo trutta) are an im-1991). More than 400 rivers in Norway have populations of Atlanticportant economic, recreational and ecological resource in rural areassalmon which account for approximately 25% of the world's healthyof the European Atlantic and Baltic seaboard, from northern Norwaypopulations (Hindar, Hutchings, Diserud, & Fiske, 2011). Both 2020 John Wiley & Sons A/S. Published by John Wiley & Sons LtdEcol Freshw Fish. 2020;00:1–17. wileyonlinelibrary.com/journal/eff 1
2 MALISON and HALLEYAtlantic salmon and sea trout are exposed to a number of threats inWhile some studies suggest that beaver dams may seasonally alterthe ocean and in freshwater. In the ocean, fish farming, sea lice infec-movement patterns of fishes (Mitchell & Cunjak, 2007; Schlosser &tions and exploitation are among the most important threats, whileKallemeyn, 2000), other studies have shown that juvenile and adultin freshwater, river regulation, migration barriers, acid precipitation,salmonids have the ability to negotiate multiple North Americanpollution from industry and agriculture, escapees from fish farmsbeaver dams or beaver dam analogs (Bouwes et al., 2016; Lokteff,and infections from the parasite Gyrodactylus salaris have all affectedRoper, & Wheaton, 2013).salmon populations negatively (Aas, Einum, Klemetsen, & Skurdal,Though a large body of knowledge exists in North America re-2011; Forseth et al., 2017). The Atlantic salmon is listed in annexesgarding the interaction of C. canadensis and Pacific salmonids, rel-II and V of the European Union's Habitats Directive as a species ofatively little is known about how Eurasian beavers may influenceEuropean importance (Elliott, Lyle, & Campbell, 1997; Hendry &Atlantic salmon and trout populations. All S. trutta juveniles rear inCragg-Hine, 2003; Jonsson & Jonsson, 2003; Lyle & Elliott, 1998). Itfreshwater, but some adults are anadromous sea trout, while othersis important to understand the different factors that can influenceremain in freshwater as resident fish their entire lives (Klemetsenthe production of salmonids because they have experienced popu-et al., 2003). Because the ecology of the two beaver species dif-lation declines over much of their range in recent years (Hendry &fers in some respects (Collen & Gibson, 2001) and Atlantic salmonCragg-Hine, 2003; Youngston & Hay, 1996).have very complex life histories (Thorstad, Whoriskey, Rikardsen,Both Eurasian (Castor fiber) and North American beavers (Castor& Aarestrup, 2011) compared to most Pacific salmonids (but not O.canadensis) are known to be engineers of freshwater habitats. Bymykiss, Quinn, 2005), caution is required in using North Americancutting vegetation and building dams, beavers can alter fluvial pro-beaver literature when considering potential Eurasian beaver effectscesses and system hydrology, creating new habitats that can in-on Atlantic salmon and trout (Collen, 1997). Juvenile Atlantic salmoncrease biocomplexity (Anderson, Paszkowski, & Hood, 2015; Giriat,and trout may use off-channel and tributary habitats differently thanGorczyca, & Sobucki, 2016; Gurnell, 1998; Law, Mclea, And, & Illby,Pacific salmonids, which could change how strongly beavers are able2016; Naiman & Rogers, 1997; Rosell, Bozser, Collen, & Parker,to influence salmonid populations. Increased lentic habitat would2005; Wright, Jones, & Flecker, 2002). This results in altered nu-likely benefit juvenile trout more so than juvenile Atlantic salmontrient and carbon cycles (Francis, Naiman, & Melillo, 1985; Naiman,because of their stronger affinity for pool environments (Heggenes,Manning, & Johnston, 1991; Naiman, Pinay, Johnston, & Pastor,Bagliniere, & Cunjak, 1999; Heggenes & Saltveit, 1990). However,1994), increased nutrient availability (Naiman & Melillo, 1984; Pinayhigh densities of juvenile Chinook have been found rearing in bea-& Naiman, 1991) and altered fluxes of organic matter, sediment andver ponds in Alaska (Malison, Lorang, Whited, & Stanford, 2014),heat (Naiman, Melillo, & Hobbie, 1986; Naiman et al., 1994; Roselleven though they are considered to favour faster flowing water likeet al., 2005). Though beavers are not commonly listed as a threat toAtlantic salmon. It is not clear how strongly movement of juvenilesalmonid populations in Norway, and there is potential for beaverssalmon and trout might be limited by the presence of dams, espe-to have positive effects on salmonid populations (based on researchcially since juvenile Atlantic salmon have been considered fluvialin North America—see below), there is concern in Europe that ex-residents that exhibit overall restricted movements (Armstrong,panding beaver populations may negatively influence salmonid pop-Kemp, Kennedy, Ladle, & Milner, 2003; Hesthagen, 1988; Symonsulations by altering fundamental freshwater habitat characteristics.& Heland, 1978).In low-order streams in North America, beaver ponds pro-Beavers and salmonids coexisted in Norwegian watersheds forvide benefits to many species of salmonids (Kemp, Worthington,millennia, since the end of the last Ice Age, prior to Eurasian bea-Langford, Tree, & Gaywood, 2012). The presence of beaver pondsvers becoming largely extirpated in Europe due to hunting by thecovering larger areas with abundant food resources can benefit ju-17th century. Eurasian beavers were reduced to 1,200 individu-venile salmon by increasing survival rates (Bustard & Narver, 1975;als in eight known, scattered populations in the early 20th centuryQuinn & Peterson, 1996), growth rates (Bustard & Narver, 1975;(Halley & Rosell, 2003). Now, after three decades of recovery, natu-Malison, Eby, & Stanford, 2015; Swales & Levings, 1989) and pro-ral spread and reintroductions (Halley & Rosell, 2003; Halley, Rosell,duction (Layman & Smith, 2001; Nickelson, Nicholas, et al., 1992;& Saveliev, 2012), there is a recent estimated minimum population ofPollock, Pess, Beechie, & Montgomery, 2004). By increasing habitat1.3 million individuals, now found in all countries of the former nat-complexity, ponds have been found to allow greater spatial resourceural range in Europe excluding Portugal, Moldova and the southernpartitioning with positive effects on steelhead density, survival andBalkans (Halley, Rosell, & Saveliev, in prep). The species has been re-production (Wathen, Allgeier, Bouwes, Pollock, & Jordan, 2018).classified as Least Concern by the IUCN. The expansion and plannedOther recent work has also shown that beaver dams can buffer dielreintroductions of beavers to rivers holding important anadromoussummer temperature extrema and create thermal refugia (Webersalmon and trout populations are causing considerable concern inet al., 2017). Fewer studies have shown that North American bea-Atlantic and Baltic seaboard regions because the impact of beaverver dams can have negative impacts on fishes when sediment anddams on these fishes is unknown. Despite the documented positiveorganic matter retention results in hypoxia or when temperatureseffects of beavers on stream fishes in North America, a continuingare elevated above conducive levels (Burchsted, Daniels, Thorson, &concern in the European Atlantic and Baltic seaboard is that beaverVokoun, 2010). In respect to fish movement, the results are mixed.dams will block fish movements and remove available habitat (Arts,
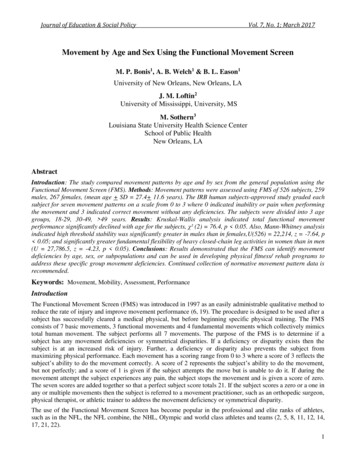
MALISON and HALLEY3Fischer, & van der Wal, 2013; Berthelsen, 2008; Collen, 1997; Collenrearing habitat, and the quality of tributary spawning and rearing& Gibson, 2001; Halley et al., 2009; Halley & Lamberg, 2001; Kemp,habitat.Worthington, & Langford, 2010; Kesminas, Leliuna, & Rymantus,Study sites were located on three paired tributaries of the Stjørdal2006; Nolet & Rosell, 1998; Parker & Rosell, 2003; Rudzite, 2005;and Orkla rivers. No data on spawner abundances are available, butSalmon & Trout Association, 2008).we estimate that all tributaries receive small numbers of returningThe goal of this study was to determine how beaver dams influ-adult spawners ( 100/year). Tributary pairs were in close proximity,enced the ecology of juvenile Atlantic salmon and trout in tributarieswith similar physical characteristics, except that one of each pair hadof important salmon and trout rivers in the Trøndelag province ofa beaver dam and pond and the other provided a beaver-free controlNorway, as well as to collect empirical data on movement rates of(Figure 2; Table 1). The Stjørdal N. sites were located on the northjuvenile salmonids in sites with and without dams. Based on rela-side of the Stjørdal on the Råelva (63 30′38.6″N; 11 05′21.5″E;tionships between C. canadensis and juvenile Pacific salmon, we pre-with beavers) and the Hofstadelva (63 29′35.4″N; 11 05′55.3″E;dicted that the presence of dams would (a) alter freshwater habitatno beaver control; Figure 2). The Stjørdal S. sites were located oncharacteristics, food availability and fish diets, (b) alter fish distribu-the south side of the Stjørdal on the Holmsbekken (63 26′59.3″N;tion and species composition, (c) that growth and condition of juve-11 03′48.6″E; with beavers) and Hemrasbekken (63 27′21.8″N;nile salmon and trout would be highest in beaver ponds compared to11 05′36.6″E; no beaver control). The Orkla beaver site was locatedlotic reaches of beaver-influenced and beaver-free control sites andon the Leirbekken (63 15′54.0″N; 9 47′58.5″E), and the control site(d) that movement rates would be lower in beaver-influenced siteswas on the Sola (63 12′51.3″N; 9 47′14.0″E; Figure 2). Stjørdal N.because dams would limit movement. Overall, we expected that thesites had stream gradients between 1% and 2%, while all other sitespresence of beaver ponds on tributaries would influence how fresh-had stream gradients 1%. All sites had similar riparian vegetationwater habitats are used by juvenile salmon and trout.with grey alder (Alnus incana), goat willow (Salix caprea), commonbirch (Betula pubescens), silver birch (B. pendula) and bird cherry2 M ATE R I A L A N D M E TH O DS(Prunus padus) being the most common.2.1 Study area2.2 Study designWe conducted this study in 2014 in the Trøndelag province ofEach study site was sampled from July to October of 2014, exceptNorway. Study sites were located on tributaries of two larger riv-for the Stjørdal N. pair where sampling started in August when landers, the Stjørdal River (4 sites, Figure 1) and the Orkla River (2 sites;access was granted. In each site, we measured habitat characteris-Figure 1; see Table 1). The Stjørdal River (63 25′N; 10 49′E) has atics and sampled fish communities. Each beaver site was sampledcatchment area of 2,130 km2 and a mean annual flow of 79 m3/s.primarily in two different habitat types: lotic reaches below damsAnadromous salmonids have access to 57 km of river, up to the(Below Pond) and within the pond (Pond; Figure 3). Additional tag-Nustad waterfall in Meråker, and the estimated total weight of fe-ging (for movement) and sampling of fish distributions occurred inmales spawning was 10,000 kg in 2016 (Forseth & Fiske, 2018).the upstream lotic reaches above ponds (Above Pond; Figure 3), ex-The Orkla River (63 18′N; 9 49′E) has a 3,092 km2 catchment andcept for the Stjørdal N. pond where there was a small lake just up-a mean annual flow of 70 m3/s. Anadromous salmonids have accessstream (from a quick-clay slide). Each beaver-free site was sampledto 90 km of river before waterfalls block upstream habitat from use,along a similar length of stream reach to determine how fish com-and an estimated 14,000 kg of female salmon returned to spawnmunities and movement differed in sites without dams.in 2016 (Forseth & Fiske, 2018). Both rivers drain into the sea viaTrondheimsfjord and are managed for hydropower (the Orkla since1983; see Hvidsten et al., 2015). These rivers are among the mostimportant river systems for Atlantic salmon and sea trout angling inthe world (e.g., the Orkla is usually among the top four Norwegian2.3 Sampling2.3.1 Habitatrivers by catch weight and number of salmon caught, StatisticsNorway, 2013). These watersheds further provide an ideal settingAt each site, we collected data on a number of habitat characteristicsfor this research as beaver recolonisation is not yet complete andthat could influence fish populations. We calculated mean width andthere are many unoccupied streams that provide control sites. Indepth by taking measurements at multiple transects along the lengthfact, while surveying salmon habitat for suitable sites, we only ob-of the wetted channel (at each point that the stream changed size).served a handful of dams in total in four different watersheds. BothWe calculated habitat area by summing the area of each measuredrivers flow through landscapes heavily modified by humans and arepolygon (width length between transects). Beaver ponds at theimpacted by development, agriculture and grazing, culverts, etc.,Stjørdal sites were smaller and were mapped by hand, measuringthat limit the amount of off-channel (water outside of, but connectedpond width every 2 m. The Orkla pond was large and open, allow-to the main channel, e.g., springs, secondary and tertiary channels)ing us to calculate pond area from imagery online (kart.finn.no). We
4 MALISON and HALLEYF I G U R E 1 Map of the study area andfocal rivers in the Trøndelag province ofNorwayTA B L E 1Characteristics of paired beaver-influenced and beaver-free habitatsStjørdal NorthBeaverStjørdal SouthNo beaverBeaverOrklaNo beaverBeaverNo beaverLotic reach length (m)9090100140110120Lotic reach width (m)2.8 1.13.8 1.61.7 0.51.5 0.64.3 2.16.0 1.9Lotic reach depth (m)0.3 0.10.4 0.20.2 0.10.1 0.10.2 0.10.4 0.1Lotic reach substrate size (cm)27.4 25.814.2 15.61.5 7.616.7 22.221.1 26.19.4 24.4Lotic reach substrate%embeddedness21.4 32.214.2 26.28.3 24.126.9 34.330.6 35.414.8 31.5Dam height (m)1.2—1—1—Dam length (m)7.4—8.4—19—Pond area (m2)1,044—1,364—2,966—Pond length (m)120—85.5—140—Pond width (m)8.7 1.8—16.0 7.2—31.0 18.4—Max pond depth (m) 2.0— 2.0— 2.0—Distance from river (km)8.96.31.11.10.0250.14Note: Beaver-influenced habitats include both the impounded areas above dams and the lotic flowing reaches below the dams.conducted substrate surveys at each lotic site by randomly select-following equation (Elliott, 1994; McMaster & Wilhelm, 1997):ing a rock every 1m along the study reach and measuring its sizeGG [TMAX TMIN)/2‒4]. Data were analysed for the time period ofand percent embeddedness (Davis, Minshall, Robinson, & Landres,20 September 2014 until 7 April 2015 for 3 beaver sites and 2 con-2001). Beaver pond substrate was not formally surveyed becausetrol sites because the Stj. S. control site logger was lost in a flood andall pond substrate was a fine mud/silt material. We deployed tem-another logger had an error and stopped logging on 7 April 2015.perature loggers at all six sites for one year (HOBO Pendant temp/The effect of habitat type on stream width, depth, substrate char-light UA-002-64 and HOBO Temp H08-001-02, Onset Computeracteristics and stream temperature was analysed using two-sample tCorporation, Bourne, MA, USA; www.onset comp.com) and recordedtests after testing if data met assumptions of normality and homoge-temperature every hour. At beaver sites, temperature loggers wereneity of variance. All statistical tests (except for nonmetric multidi-placed in the lotic reach downstream of the pond. We calculatedmensional scaling, below) were analysed in R version 3.5.2 and weregrowing degree-days (GDD) between June and August using theconsidered significant when p .05.
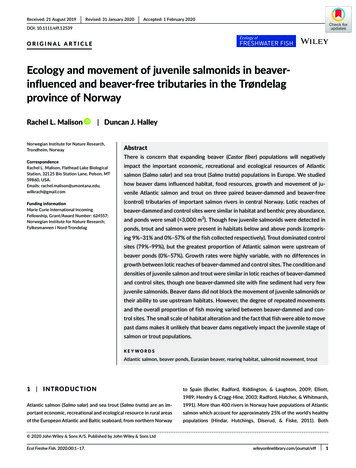
MALISON and HALLEYF I G U R E 2 Study sites (a) StjørdalNorth Beaver, (b) Stjørdal North Control,(c) Stjørdal South Beaver, (d) StjørdalSouth Control, (e) Orkla Beaver and (f)Orkla Control. Red arrows show thelocations of visible PIT-tag antennaeF I G U R E 3 Diagram of PIT-tagantennae placement on (a) Stjørdal Northand South beaver sites, (b) the Orklabeaver site and (c) all control sites(a)(b)(c)(d)(e)(f)5
6 MALISON and HALLEY2.3.2 Prey availability and fish diets2.3.3 Fish samplingAt each site, we sampled autochthonous (within the stream) and al-Lotic reaches below and above beaver ponds, beaver-free reacheslochthonous (falling into the stream) prey resources and salmonidand the shallow edges of beaver ponds were sampled using a back-diets because differences in prey availability could influence fishpack electrofisher (Paulsen FA-3, exponential pulses of 700 V, 70 Hz;habitat use and fish population dynamics. To compare the number ofPaulsen, Norway). We primarily sampled each beaver pond usingbenthic invertebrates between beaver-influenced and control sites,collapsible minnow traps because minnow traps have been used towe sampled benthos from three riffles at each site in Septembersuccessfully catch juvenile pacific salmon (Malison, Eby, & Stanford,using a D net and metal frame (0.25 m2). Replicate samples were2015; Malison et al., 2014; DreamTM Ørekyteteine m 2 innganger,collected from each riffle by disturbing the bed sediments within theDreamTM, Norway). Minnow traps were placed in ponds for 2–24 hrmetal frame for one minute. We picked each sample in the field forand were baited with salmon flesh. All captured fish were placedone and a half person-hours and preserved macroinvertebrates inin live wells in the stream until they were processed. Fish wereethanol. In the laboratory, most samples were identified to family,anaesthetised with Benzoak vet 200 mg/ml (1–1.5 ml/10 L). Fishor further to genus and species when size allowed (except for acari,were anaesthetised for 2 min, until they started to turn over. Fisholigochaeta, ostracoda, nematoda and copepods) and counted. Thewere identified, measured for fork length and weighed. Individualseffect of habitat type on total benthic invertebrate counts was ana-over 80 mm were implanted with a HDX 12-mm passive integratedlysed using a two-sample t test. We analysed the relative abundancetransponder (PIT) tag (12.0 mm 2.12 mm HDX ISO, Oregon RFID,of taxa at each site with nonmetric multidimensional scaling (NMDS;Oregon, USA; www.orego nrfid.com). Fish were held long enoughKruskal & Wish, 1978) to evaluate differences among habitat typesto determine that they fully recovered from drugging and handlingwith the program PC-ORD (version 7; MjM Software Design,prior to being released back throughout the study reach. We alsoGleneden Beach, Oregon, USA; www.pcord.com). We excluded raredid some exploratory electrofishing at pond edges and detected thetaxa from the data set (relative values, 5%) and/or combined thempresence of PIT-tagged salmonids in ponds using PIT-tag antennaewith higher order levels, to reduce skewness in the data. We used(see below).multiresponse permutation procedures (MRPP) to test for significantdifferences in community composition by habitat type.We sampled three times a month from July to September andtwice in October using a capture–mark–recapture design, to mea-We used floating traps (four 0.4-m2 opaque pans at each site)sure growth and estimate survival in the lotic reaches of beaver andto measure the inputs (individuals/day) of adult invertebratescontrol sites. Instantaneous growth rates were calculated for fish(both aquatic and terrestrial in origin) in September for a period ofrecaptured at each site for each monthly sampling period using the2–4 days at each site (pond, beaver-influenced lotic site, control site).equations:We picked all individuals from each trap and preserved samples inethanol in the field. Sampled were identified and counted in the laboratory. Adult Ephemeroptera, Plecoptera, Trichoptera and Diptera()() 1G 100 loge L2 loge L1 T2 T1,()() 1G 100 loge W2 loge W1 T2 T1were most often identified to family, but only to order if family couldnot be confirmed, while other groups were not identified past classwhere L x is the fork length (mm) at time Tx, Wx is the weight (g)or order (e.g. Ostracoda). Site input was calculated by dividing theat time Tx, and T is measured in days, representing the number ofnumber of insects falling into the stream by the number of days eachdays between tagging and recapture or between recapture eventstrap ran. Allochthonous inputs by habitat type were analysed using(Busacker, Adelman, & Goolish, 1990). Unfortunately, we could notone-way analysis of variance (ANOVA; R version 3.5.2). We analysedestimate survival for a number of reasons: (a) overall too few fishthe relative abundance of taxa at each site with nonmetric multidi-were tagged and recaptured (often none or only 1–2 were recap-mensional scaling as described above for benthic samples.tured per site per monthly sampling period), (b) some sites had noWe examined the amount and composition of prey in salmonidrecaptures of salmon or trout in any months, (c) large flood events ordiets to determine if diets varied by habitat type. We collected dietthe presence of spawning adults prevented repeated capture–mark–samples from a subset of the fish collected in September duringrecapture sampling at other sites, and (d) we could not measure em-mark–recapture sampling. A composite sample was collected from aigration from the sites because we did not have enough antennae tototal of twenty fish, comprised of both Atlantic salmon (74–133 mm)place at the end of the reaches (see Table 2 for a sampling summary).and trout (68–170 mm), at each site, except for the Stjørdal S. beaverThe combination of these factors resulted in too poor of a data set tosite where no salmonids were captured in September. We collectedconduct a robust capture–mark–recapture analysis.stomach-content samples nonlethally using gastric lavage. SamplesInstead of capture–mark–recapture methods, we used deple-were preserved in ethanol and identified and counted in the labo-tion sampling once a month (July–October) at each site to estimateratory. The effect of habitat type on fish diet was analysed using apopulation sizes and calculate salmon and trout densities in the lotictwo-sample t test. We used NMDS to evaluate differences amongsections of beaver and beaver-free sites. We fished each reach threehabitat types in the composition of fish diets, following the sametimes, over a short time period (starting the next pass when themethods described for prey availability.water cleared). Fish from previous passes were held in live wells until
MALISON and HALLEY7TA B L E 2 Summary of tagged and recaptured trout and salmon captured for each site during capture–mark–recapture sampling events(MR) in July (J MR1-3), August (A MR1-3), September (S MR1-3) and October (O R2OctoberMR3MR1MR2TotalStj S.# Newly tagged trout5523012314695Control# Recaptured trout (prev.tagged)5307108226Trout recaptures eachmonth (%)(8/18, 44%)# Newly tagged salmon000103200103Salmon recaptures eachmonth (%)(2/2,100%)Stj S.# Newly tagged trout# recaptured trout —00000# Recaptured salmon (prev.tagged)00—0——0—00—0——0—0# Newly tagged trout5010523—24429678—50Trout recaptures eachmonth (%)(42/156, 27%)3014—20021—6Salmon recaptures eachmonth (%)(5/12, 42%)7Stj N.# Newly tagged trout3——507—18—116# Recaptured trout (prev.tagged)4——142—12—32Trout recaptures eachmonth (%)(4/38, 11%)0000# Recaptured salmon (prev.tagged)(16/41, 39%)——20—0—2—00—1—10(1/2, 50%)0Orkla# Newly tagged trout511170319877Control# Recaptured trout (prev.tagged)201110229Trout recaptures eachmonth (%)(3/23, 13%)# Newly tagged salmon10110130(2/30, 7%)(1/2, 50%)(8/77,10%)(4/50, 8%)82010124130# Recaptured salmon (prev.tagged)100200014Salmon recaptures eachmonth (%)(1/2, 50%)(2/12, 17%)(26/116,22%)(12/98, 12%)—Salmon recaptures eachmonth (%)(6/20,30%)(1/16, 6%)Beaver# Newly tagged salmon43(49/244,20%)(8/221, 4%)37251# Recaptured salmon (prev.tagged)27—460# Recaptured trout (prev.tagged)—590Stj N.——0Control# Newly tagged salmon—000—00Salmon recaptures eachmonth (%)(2/3, 67%)(1/2, 50%)0Trout recaptures eachmonth (%)# Newly tagged salmon0(18/95,19%)(10/75, 13%)# Recaptured salmon (prev.tagged)Beaver0(8/30, 27%)Individualrecapturerate(4/30,13%)(1/25, 4%)(Continues)
8 MALISON and HALLEYTA B L E R1MR2OctoberMR3MR1MR2TotalOrkla# Newly tagged trout21043152—27—45Beaver# Recaptured trout (prev.tagged)00000000—0—0Trout recaptures eachmonth (%)# Newly tagged salmon0322000340164—19—53# Recaptured salmon (prev.tagged)10030—5—9Salmon recaptures eachmonth (%)(1/7, 14%)(3/14, 21%)Individualrecapturerate(8/53,15%)(5/34, 15%)Note: Dashes indicate that sampling was not conducted for the respective site on the respective sampling day. Total recaptures reflect the totalnumber of recaptures caught each month. The individual recapture rate reflects the total number of individuals that were recaptured at least onceduring the entire sampling period.all electrofishing passes were completed and then all fish were pro-antennae upstream of this point (A1&2, Figure 3c). This design al-cessed. Both sites in the Orkla were sampled completely for all fourlowed us to compare movement rates along reaches with and withoutmonths. The Stjørdal N. pair was only sampled in September anddams. The four antennae at each site covered a distance of 60–80 m.October. The Stjørdal S. pair was not sampled in October becausePit-tag antennae were deployed at all sites in July 2014, exceptadult salmon and trout were present in the streams. Furthermore,for the Stjørdal N. control site where the antennae were deployed inif too few salmonids were caught in previous months, three passAugust 2014. All antennae ran continuously until removal between 14depletion sampling was discontinued and one pass of electrofishingand 18 October 2014, excluding time periods when batteries had to bewas completed (i.e., Stjørdal S. beaver site). Stream sections wereremoved from the field for charging (solar panels failed to continuouslynot blocked off with nets; however, in all but one site an obstaclecharge) or when flood events damaged antennae and readers. The total(e.g., waterfall, beaver dam, stream reconstruction) blocked at leastnumber of hours of active data collection was recorded for each site.one end of each reach and during portions of the summer streamOne large flood event at the Stjørdal S. beaver site inundated the PIT-segments were isolated on both ends when the channel dried intag reader and damaged it beyond repair on 17 August, resulting in aplaces in one site. Population sizes could be underestimated becausegap of 27 days while we waited for a new reader. At other sites, anten-reaches were not completely blocked off during electrofishing.nae systems went off intermittently due to power issues. Because thereTo measure movement rates of PIT-tagged salmonids, we placedwere gaps in time where moving fish were not tracked, the measuredfour pass-through PIT-tag antennae (built from double looped 10movement rates are likely biased low. Beaver-influenced site antennaegauge stranded wire and placed in plastic tubing) and one HDX Multi-ran for a total of 40–68 days (on average 54 days) and control site an-Antenna Reader at each study site (Oregon RFID, Oregon, WA, USA;tennae ran for 47–49 days (on average 48 days). Because different num-www.orego nrfid.com; Figure 3). The r
This results in altered nu-trient and carbon cycles (Francis, Naiman, & Melillo, 1985; Naiman, Manning, & Johnston, 1991; Naiman, Pinay, Johnston, & Pastor, 1994), increased nutrient availability (Naiman & Melillo, 1984; Pinay . since the end of the last Ice Age, prior to Eurasian bea-vers becoming largely extirpated in Europe due to hunting .