Transcription
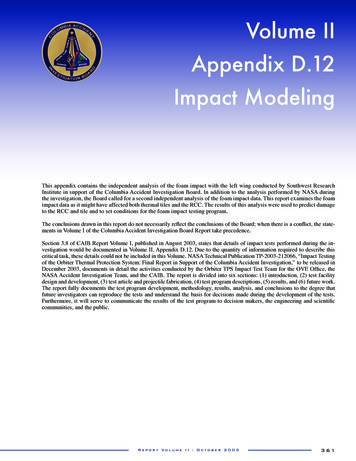
COLUMBIAACCIDENT INVESTIGATION BOARDVolume IIAppendix D.12Impact ModelingThis appendix contains the independent analysis of the foam impact with the left wing conducted by Southwest ResearchInstitute in support of the Columbia Accident Investigation Board. In addition to the analysis performed by NASA duringthe investigation, the Board called for a second independent analysis of the foam impact data. This report examines the foamimpact data as it might have affected both thermal tiles and the RCC. The results of this analysis were used to predict damageto the RCC and tile and to set conditions for the foam impact testing program.The conclusions drawn in this report do not necessarily reflect the conclusions of the Board; when there is a conflict, the statements in Volume I of the Columbia Accident Investigation Board Report take precedence.Section 3.8 of CAIB Report Volume I, published in August 2003, states that details of impact tests performed during the investigation would be documented in Volume II, Appendix D.12. Due to the quantity of information required to describe thiscritical task, these details could not be included in this Volume. NASA Technical Publication TP-2003-212066, “Impact Testingof the Orbiter Thermal Protection System: Final Report in Support of the Columbia Accident Investigation,” to be released inDecember 2003, documents in detail the activities conducted by the Orbiter TPS Impact Test Team for the OVE Office, theNASA Accident Investigation Team, and the CAIB. The report is divided into six sections: (1) introduction, (2) test facilitydesign and development, (3) test article and projectile fabrication, (4) test program descriptions, (5) results, and (6) future work.The report fully documents the test program development, methodology, results, analysis, and conclusions to the degree thatfuture investigators can reproduce the tests and understand the basis for decisions made during the development of the tests.Furthermore, it will serve to communicate the results of the test program to decision makers, the engineering and scientificcommunities, and the public.Report Volume II October 2003361
COLUMBIAACCIDENT INVESTIGATION BOARDTHIS PAGE INTENTIONALLY LEFT BLANK362Report Volume II October 2003
COLUMBIAACCIDENT INVESTIGATION BOARDAPPENDIX D.12Impact ModelingSubmitted by James D. WalkerSouthwest Research InstituteEXECUTIVE SUMMARYmodel was developed to model the panel and an analyticboundary condition was developed to model the pressureload supplied by the impacting foam. Once again, central tothe load delivered and the stresses calculated is the normalcomponent of the foam impact velocity. Comparison withthe two tests performed against RCC panels led to estimatesof failure stresses within the panel material. Parametricstudies were performed with the model to investigate thequestion of impact location and to investigate the effect offoam impactors with rotational velocity. It was shown thata nonzero rotation velocity for the foam impactor nearly always increased the stresses on both the panel face and the ribof the panel. Computations were performed to determine themost severe loads within the framework of impact locationand rotational velocities. Also, an estimate of an angle adjustment for a rotational velocity was determined, as actualtests did not include a rotating foam impactor.After the loss of the Orbiter Columbia during reentry onFebruary 1, 2003, Southwest Research Institute (SwRI)was contracted by the Columbia Accident InvestigationBoard (CAIB) to perform impact modeling in support ofthe investigation. At the SwRI site, the CAIB in conjunctionwith the NASA Accident Investigation Team (NAIT) wasperforming impact tests against thermal protection systemstructures, including thermal tiles and fiberglass and reinforced carbon carbon (RCC) leading edges. To complementthe extensive modeling work being carried out by the NAIT,the CAIB wished to support an independent analysis of theimpact event.Through the course of the work, SwRI developed a detailedanalytic and numerical model of foam insulation impact onthermal tiles. This model provided a damage/no damagetransition curve in the impact speed-impact angle plane.In particular, it was shown that the component of the foamimpactor velocity that is normal to the impact surface determined whether there is tile damage. Thus, given an impactspeed and an impact angle for an incoming piece of foam insulation, the model determined whether tile material wouldbe damaged. This model agrees extremely well with previously performed tile impact work conducted at SwRI as wellas with the tests performed during the Columbia accidentinvestigation of foam insulation impacting tiles placed onthe main landing gear door of Enterprise.In all, the modeling work was extremely successful and ledto a greater physical understanding of the impact of foaminsulation against the Orbiterʼs thermal protection system.In particular, it was shown that the most important piece ofinformation is the velocity component of the foam that isnormal to the surface being impacted. This velocity determines the loading stress on that surface. Given the stress, inthe case of tiles, stresses above the crush-up stress lead totile damage, while stresses below the crush-up stress lead tono damage. In the case of the RCC panel, the loading stresscombined with the loading area gives rise to the loads seenby the panel and by the rib. These loads lead to stresses inboth the panel and rib that subsequently can fail the rib orpanel face. Though the geometry and deformation modes ofthe RCC panel do not produce a simple theory for damageas was found in the tile impact model, still the physical understanding of the impact is that stresses arise from normalvelocities over a footprint of the impact to give loads thatcan then fail the panel.Computations were performed to examine the role of foamrotational velocity on the impact. Foam impactor rotationalvelocity can increase the damage done to tiles since it canincrease the impact velocity component that is normal to thesurface of the tile. An angle and impactor shape were determined that would produce similar damage to tile materialas would the rectangular impactor with a given rotationalvelocity striking at the expected impact angle.SwRI appreciates the opportunity to participate in the Columbia investigation, and this report presents the work performed in the modeling effort.In addition to the modeling of tile, the impact of foam insulation on RCC panels was also modeled. Here, a numericalReport Volume II October 2003363
COLUMBIAACCIDENT INVESTIGATION BOARDTHERMAL TILE AND FOAM INSULATION MODELSVisual observation of the tests revealed two important factsabout the foam during loading: first, there was virtually nolateral expansion; and second, when compressed the foamstayed intact and compressed (i.e., there was a permanentcrush-up). The second observation on crush-up is confirmedin Figure 2 by the unloading curves that clearly indicate apermanent deformation.To correctly model the impact of materials, it is essential tocorrectly model the materials involved. In order to do this,work began with the experimental testing of foam cubes leftover from the 1999 SwRI testing program of foam againsttile [1] and the testing of a thermal tile supplied by NASA.The important information about both the foam and the tilethat was lacking in the available data from NASA and theshuttle contractors was crush-up data for the material incompression. To address this lack of information, two 1”(2.54 cm)* cubes of tile left over from the 1999 SwRI testingprogram were crushed in an MTS test machine. The foammaterial is identified as NCFI 24-124 [1]. Two tests wereperformed. In the first, the foam was crushed till a largestress was reached, and in the second, three unload/reloadswere performed during the crush up. Results are shown inFigs. 1 and 2. Strain rates were roughly 7 10-3/s. The initial knee in the compression curve, where the slope of thestress-strain curve greatly diminishes, will be referred to asthe “initial crush-up” and the corresponding stress will bereferred to as the crush-up stress σcrush in this report.However, in the tests that were being performed at SwRIunder the NAIT/CAIB program with foam impacts againstaluminum panels, it was clear that at the higher rates thefoam was not permanently crushing up. It was undergoinglarge deformations, but after the impact it was releasing toits original shape.Based on these observations, it was decided to model thefoam as a nonlinear elastic material. Since impact computations were to be performed in the Eulerian hydrocode CTHfrom Sandia National Laboratories [2], it was important todevelop the model in the context of CTHʼs computationalalgorithm. Within CTH, as with many hydrocodes, thematerial response is divided into a spherical response (i.e.,a pressure-volume response) and a shear response. To correctly model the material, the fact that there was no lateralexpansion of the material was caused by setting Poissonʼsration ν equal to zero:(1)ν 0Within CTH, the local value of the shear modulus is computed from the current value of the bulk modulus and theconstant Poissonʼs ratio. Thus, to model the material as anonlinear elastic material with no lateral expansion, all thatis required is determining the bulk response, that is, the bulkmodulus as a function of pressure.For a linear elastic material with a Poissonʼs ratio of zero, thebulk modulus K is simply 1/3rd the Youngʼs modulus E, andthe shear modulus G is simply 1/2 the Youngʼs modulus:The initial values that were measured for the foam insulationat SwRI from the weight and dimensions of the samples andthe stress-strain curves are given in Table 1. For a nonlinearelastic material with a Poissonʼs ratio of zero, correspondingdifferential relations between the local bulk modulus, shearmodulus and Youngʼs modulus apply. Thus, specifying oneof the moduli as a function of pressure and energy completely determines the elastic response.FoamInsulationTileFigure 2. Test of second foam sample. Note the three unload/reloads.364(2)K E/3, G E/2Figure 1. Results of test of foam cube.Report Volume IIρ0E0σcrushν0.03844 g/cm32.4 lb/ft38.0 MPa1160 psi220 kPa31.9 psi00.18 g/cm311.2 lb/ft327.0 MPa3916 psi345 kPa50 psi0Table 1. Measured Properties of the Foam Insulation and theThermal Tile. October 2003
COLUMBIAACCIDENT INVESTIGATION BOARDWithin CTH, new subroutines were written to model thefoam insulation and thermal tile material response. Somedetails of these routines are described in another portionof the Columbia Accident report since CTH is an ExportControlled code. The model essentially returned the pressure and bulk modulus given a density. The table of valuesfrom which the subroutine linearly interpolated to producepressures and moduli (in particular, the local bulk soundspeed) for the foam insulation is given in Table 2. Sincethese are axial stress values, they correspond to the Youngʼsmodulus, and the corresponding bulk modulus was found bydividing by 3. Also, no thermal component to the stress wasincluded in the EOS. Thus, given the density of the material,its pressure state was determined. The final values with verylarge stresses are to provide robustness to the computationalscheme so that, if large compressions did occur, the EOSwould be able to provide corresponding pressures.DensityAxialStressDensity(g/cm3)Axial Stress(kPa)0 g/cm30 Pa0.00.3 rush-f0.037383-220ρ00 Pa0.0384400(1 sh-f0.128133440ρ0/0.151.31 MPa0.2562671.31 103ρ0/0.057 MPa0.7688007.00 103ρ0/0.047 GPa0.9610007.00 106Figure 3. Stress-strain curve for foam: blue and black from tests,red from model.Figure 4. Enlargement of stress-strain curve for foam in Figure 3:blue and black from tests, red from model.Table 2. Tabular Foam Insulation Values in EOS.Due to the tests with the foam showing no permanent crushup during the dynamic tests, the foam was modeled as purelyelastic by 1) setting a flag within the new EOS to say that thepressure response was elastic (i.e., there was no permanentcrush-up) and 2) setting the yield stress in the elastic-plastic portion of the code to 7 MPa ( 1 ksi). It is unlikely thisstress level will be reached, so this stress is viewed as a largestress to maintain elastic behavior in the foam. Also requiredwithin CTH is a tensile failure stress which was set to 230kPa (33.4 psi).For the foam insulation, Figure 3 compares the model to thedata from the two tests, and Figure 4 is an enlargement of thelow pressure region. The agreement is excellent.Figure 5. Stress-strain curve for shuttle thermal tile.The initial values (i.e., near zero stress) that were measuredfor the thermal tile at SwRI from the weight and dimensionsof the samples and the stress-strain curves are given in Table1. Though it is clearly an LI-900 tile, the measured densitywas larger than the stated 9 lb/ft3. As throughout this report,the values measured at SwRI will be used in the modelingand analysis.Similar material characterization work was performed ona shuttle thermal tile. SwRI was mailed a tile (MISC-794400-120) from which were cut roughly 2” (5.08 cm) cubesamples. Two cubes were then crushed in an MTS machine.The results of the crushing are shown in Figs. 5 and 6. Strainrates were roughly 3 10-3/s.Report Volume II October 2003365
COLUMBIAACCIDENT INVESTIGATION BOARDFigure 7. Stress-strain curve for thermal tile: blue and black aredata, red is model.Figure 6. Stress-strain curve for shuttle thermal tile, includingunload/reloads.Upon loading, the initial crush-up point in the curve occurs at 345 kPa (50 psi). After this point, there is a slowlyincreasing stress as strains increase. A difference betweenthe foam crush-up and the tile crush-up is that the tile breaksapart. Visual observation during the compression test indicated that failure begins when the stress-strain curve beginsto dip in the 40% strain region. Fractures form in the tilematerial and the cube of tile subsequently disintegrates asloading progresses. To model this behavior, the elastic-plastic yield stress was set to 400 kPa (58 psi). The elastic-plastic yield is an important part of the crush-up behavior of thetile (see Figure 8, where the solid curve is without the yieldstress while the dot-dash curve is with the yield stress in theformulation). Also, a failure model was invoked, namelythat the material would fail at 50% equivalent plastic strain(this failure model was invoked by using constants D2 0.5,D1 D3 D4 D5 0 in the Johnson-Cook fracture model).The tensile failure stress was set at 360 kPa (52.2 psi). Alsoimportant in the computations that included both foam andtile was setting certain parameters in the CTH fracture input:pfvoid pffrac -50 kPa and setting nface1 and nface2 equalto the material numbers of the foam and tile. Though thetensile behavior is not well modeled (a general problem forEulerian codes), it is an important part of the model and doesaffect results. Fortunately, the most interest for these modelsis when the materials are under compression.Figure 8. Enlargement of tress-strain curve for thermal tile: blueand black are data, red is model (solid curve is without yield;dashed curve is behavior with yield).DensityAxial StressDensity(g/cm3)Axial Stress(kPa)0 g/cm30 Pa0.00.3 sh-t0.1777-345ρ00 Pa0.18000For the tile model, permanent crush up was assumed to occur. Thus, once compressed beyond the crush-up stress, apermanent set occurs and the unloading curve is differentthan the loading curve. This behavior was accomplished bysetting the appropriate flag in the new EOS model in CTH.(1 σcrush-t/E0t)ρ0σcrush-t0.1823345ρ0/0.8352 kPa0.2250352ρ0/0.62400 kPa0.2903400ρ0/0.50550 kPa0.3600550The model for the thermal tile material is shown in comparison to test data in Figs. 7 and 8. The behavior beyondthe failure of the tile material is extrapolated based on thefoamʼs properties. Table 3 displays the values of axial stressversus the density, similar to Table 2 for foam. This table,with the Poissonʼs ratio equal to zero and the yield stressand fracture model as defined above, completely defines thematerial response.ρ0/0.301.10 MPa0.60001.10 103ρ0/0.253.30 MPa0.72003.30 103ρ0/0.2011.0 MPa0.90001.10 104ρ0/0.1811.0 GPa1.00001.10 107366Report Volume IITable 3. Tabular Tile Values Used in EOS. October 2003
COLUMBIAACCIDENT INVESTIGATION BOARDFOAM IMPACT ON TILE COMPUTATIONSried out to 500 μs. The figure also shows frames of eachcomputation at 200 and 500 μs. The outlines of the materialsshow that the deformation in these cases is quite similar. Thecolors in the figures show σyy , where y is the vertical axis.Though similar, it can be seen that the stresses away fromthe impact region are lower in the 3D computation as the extra dimension has stress-free boundaries that supply rarefaction waves reducing the stress beneath the impact site.The models developed above were then exercised by examining the impact tests reported in [1]. These tests included1” (2.54 cm) cubes of foam insulation impacting individualthermal tiles at various angles and velocities. The experiments included impacts ranging from no-damage to significant damage to and cratering in the tiles, and were thusviewed as a good range of data to compare against.As a quantitative measure, results from the experiment aswell as the computations are shown in Table 4. The finalcrater dimensions agree very well for the three cases. In addition to considering the final crater dimensions, the normalstress (σyy) histories at 0.5 cm interval locations were compared (Figure 10). As can be seen, the normal stress historiesagree very well for the two computations. Due to the agreement, further calculations to explore the behavior of theimpact event were carried out in 2D plane strain.Most of the computations were performed in 2-dimensionalplane strain. It turned out that due to the physics involved(and as was explicitly shown for one case), there was excellent agreement between 3-dimensional and 2-dimensionalcalculations for the impact parameters considered. Computations were performed with CTH for a variety of strikingangles and velocities. Information extracted from the computations primarily focused on the normal stress at the surface of the tile; the histories of these stresses were examinedat locations spaced 0.5 cm apart on the tile surface.As a first example, the comparison between a 2D and 3Dcomputation will be considered. Figure 9 shows the initialgeometry for both the 2D and 3D computation. The thermaltiles are 6” 6” 2” in 3D, and 6” 2” in 2D. The impactvelocity was chosen to be 800 ft/s (244 m/s) at a strikingangle of 30 . The cell size in the computations was 1 mmcube or square, depending on the dimension, with 160 100 40 cells used in 3D (a plane of symmetry was assumed atthe center, and only 1.5” width of the half tile was included),and 160 100 cells used in 2D. The computations were car-CraterDepthCraterLengthCraterWidthExperiment [1]0.64 cm(0.25”)5.1 cm(2”)3.2 cm(1.25”)3D computation0.8 cm(0.3”)6.4 cm(2.5”)2.9 cm(1.15”)2D computation0.8 cm(0.3”)5.4 cm(2.1”)n/aTable 4. Comparison Between Experiment and 3D and 2D-PlaneStrain Computations.Figure 9. CTH computations with new foam insulation and thermal tile models. Top is 3D computation, bottom is 2D plane strain of 1” cubeof foam insulation material impacting thermal tile at 800 ft/s at 30 impact angle. Times are 0, 200 and 500 µs. Colors mark σyy , rangingfrom –200 kPa (-29 psi, purple) to 200 kPa (red); green is 0 kPa.Report Volume II October 2003367
COLUMBIAACCIDENT INVESTIGATION BOARDFigure 10. Normal stress histories for 3D (left) and 2D-plane-strain (right) computations of 1” cube of foam insulation impacting thermal tileat 800 ft/s at 30 impact angle.Damage/No Damage CriteriaHowever, for an impact at the same velocity but a larger impact angle, damage does occur. Figure 12 shows the resultsfor 1” cube of foam insulation impacting a thermal tile at700 ft/s at a 23 impact angle. In this case there is damage:a crater is seen when the surface of the tile is examined andthe normal stresses at the interface exceed 345 kPa by a significant amount and for a significant time duration.Given that the material models and impact simulations werebehaving well and reproducing experimental results, it wasdecided to pursue a damage/no damage transition curvethrough computation. In particular, a sequence of computations was performed with the intent of determining whetheran impacting 1” cube of foam insulation material woulddamage the thermal tile. The damage/no damage decisionwas based on an examination of both the final state of the tilesurface and the normal stress history at the gage locationsalong the tile surface. For example, the computation at 700ft/s at 15 impact angle was decided to have no damage sincethere was little deformation at the surface of the tile (whatdeformation is seen there is typical of numerical anomaliesin interfaces in Eulerian codes) and the stresses remain below the 345 kPa (50 psi) crush-up stress determined abovefor the thermal tiles. The results are shown in Figure 11.Mapping Out the Damage/No Damage Transition CurveA series of computations were performed to determine thedamage/no damage transition curve in the impact speedimpact angle plane. In each case a given impact speed andimpact angle computation was performed with the newmodel in CTH, and based on the arguments presented aboveeither “damage” or “no damage” (or in some in-betweencases, “slight damage”) was assigned to the results. TheseFigure 11. σyy (left) and normal stress (σyy) histories (right) for 1” cube of foam insulation impacting thermal tile at 700 ft/s at 15 impactangle; no damage occurs to the tile.368Report Volume II October 2003
COLUMBIAACCIDENT INVESTIGATION BOARDFigure 12. σyy (left) and normal stress (σyy) histories (right) for 1” cube of foam insulation impacting thermal tile at 700 ft/s at 23 impactangle; damage occurs to the tile.computations were then plotted in the impact speed-impactangle plane. After each computation, the decision was madeon what case to run next, thus allowing the curve to be followed. Table 5 shows the results of the computations. Whenplotted on a graph, these results give indication of a fairlywell defined damage/no damage transition curve in the plane(Figure 13).Velocity (ft/s)No Damage17540 ,50 , 70 20090 Slight DamageDamage40 ,50 , 70 22550 25050 , 90 30030 90 40020 , 25 30 50020 25 30 60017 20 , 23 25 70010 , 15 80013 Figure 13. Damage/no damage results from numerical calculations.Analytical Model for Damage/No Damage Transition CurveWhen the foam insulation material impacts the tile surfaceat an angle, it appears it is possible to separate the velocityof the foam material into two parts: tangential to the surfaceand normal to the surface. As there is no Poissonʼs effect forthe foam, the two behaviors seem to separate nearly completely. Thus, the question arises as to what normal velocity leads to the crush-up of the thermal tile. The Hugoniotjump conditions for mass and momentum conservation for ashock moving to the right state20 ,23 , 30 17 20 15 20 90012 100010 17 110010 15 120010 15 140010 13 16007 10 ρ2 12 Table 5. Results of Computations of 1” Cube of Foam InsulationImpacting a Thermal Tile. Each Angle Entry Represents a CTHCalculation.Report Volume II 1–ρ1u2 – u1U – u1(3)σ2 – σ1 ρ1(U – u1)(u2 – u1)(4)October 2003369
COLUMBIAACCIDENT INVESTIGATION BOARDwhere subscript 1 refers to the region in front of the shock(before passage) and subscript 2 refers to the region behindthe shock, U is the shock velocity, ρ is density, σ is stressand u is particle velocity. For the impact situation here,the crush-up stress of the foam insulation is less than thatof the tile and therefore the foam will achieve its crush-upstress and then continue loading into its relatively flat stressresponse region (Figure 4). The thermal tile, on the otherhand, will be responding in its initial elastic regime up tothe crush-up stress. In equations for each material, with thesubscript e referring to elastic, the material states after thepassage of the initial elastic wave areρe 1–c0 ρ0uec0V – Vcrush/Vsin(θ)For the value of Vcrush computed for the foam insulationimpact into tile, this damage/no damage transition curve isplotted in Figure 14 along with the results from the computations. It is seen that there is excellent agreement.(5)σcrushρ0c0(6)where subscript 0 refers to the initial state and c0 (E0/ρ0)(the Youngʼs modulus is used in this expression for the longitudinal sound speed since Poissonʼs ratio is zero). At thecrush-up stress of the thermal tile, the material velocity inthe tile is uet and the stress is σcrush-t (where the subscript tstands for tile). The Hugoniot jump conditions are now applied to the foam insulation to giveσcrush-t – σcrush-f ρef (c1f uef)(Vcrush – uef – uet)Figure 14. Theoretical damage/no damage transition curve withcomputational results.(7)Returning to the reports of previous work performed atSwRI [1,3], all the experimental results of foam insulationimpact into single thermal tiles were categorized with thesame damage/slight damage/no damage designation. Figure15 breaks out these various impact cases. Figures 15a-c arefor NCFI 24-124 [1]. The material in Figure 15d from [3] isan ablator material with a higher density (around 0.3 g/cm3,19 lb/ft3) and unknown crush strength.* Rough dimensionsof the impactors are shown in the figure captions. Of mostinterest are the foam insulation impactors with leadingcross section 1” 1” (Figure 15a). Though of two differentlengths, the agreement is remarkable. In this case, the tileis fully loaded by the foam, and the length of the impactor does not affect whether damage occurred (it does affectcrater size [1]). In other cases with much smaller cross sections, it is likely the projectile buckled before fully loadingthe tile, thus leading to less damage to the tile. Figure 15eshows results of tests performed during the Columbia investigation (discussed below). Finally, Figure 15f shows all thedata points plotted with the theoretical curve. The agreementis excellent.Solving for the impact velocity at which the tile crush stressis reached yieldsVcrush uet uef σcrush-t – σcrush-fρef (c1f – uef)(8)This equation for the crush velocity can be evaluated usingthe properties of the foam insulation and thermal tile material determined above. The values obtained arec0f 456 m/sc0t 387 m/sc1f 49.8 m/sρef 0.03953 g/cm3ρet 0.18233 g/cm3uef 12.5 m/suet 4.95 m/sVcrush 68.2 m/s (224 ft/s)Thus, for a normal impact of foam insulation against a thermal tile, crush-up of the thermal tile begins at an impact velocity of 68.2 m/s. This derivation was for one-dimensionalresponse. In the situation where the piece of foam is impacting at an angle θ, the normal velocity (the velocity into thetile) is given byVy – Vsin(θ)A strong case can be made that the foam insulation impactingthermal tiles is well understood. Good agreement has beenshown between the large-scale numerical computations, thetheoretical model, and experimental results. Thus, it is clearthat loading from the foam arises from the component of thevelocity normal to the surface being struck. If the resultingnormal stress exceeds the crush-up stress of the tile, then thethermal tile crushes and a crater is formed. Otherwise, thereis minimal or no damage to the tile. Figure 16 puts all three(CTH calculations, theoretical curve, experimental results)on one plot.(9)Thus, for foam insulation impacting thermal tile at a velocityV and angle θ, the thermal tile will begin to crush at370(10)Report Volume II October 2003
COLUMBIAACCIDENT INVESTIGATION BOARDFigure 15a. 2.54 2.54 2.54/7.62 cm.Figure 15b. 0.64 x 2.3 x 2.3 cm.Figure 15c. 0.95 diameter x 7.62 cm.Figure 15d. 0.5 x 0.5 x 5.1 cm (ablator) [3].Figure 15e. Columbia investigation tests.Figure 15f. All data from [1] and [3].Figures 15a – 15f. Theoretical damage/no damage transition curve with results of all impacts into thermal tiles contained in [1,3] andColumbia investigation tests.Report Volume II October 2003371
COLUMBIAACCIDENT INVESTIGATION BOARD3) In the Orbiter configuration, the tiles are separatedand a gap-filler is placed between the tiles. On impactwith foam, the edges of the tiles are essentially beingstruck at a much higher incident angle and are therefore undergoing larger stresses than the flat top of thetile. Crush-up of the tile could begin at the edges andthen propagate across the tile surface causing moredamage.In practice, for foam insulation impacts on tile, only “3” isa concern.The testing performed by NAIT/CAIB during the Columbiainvestigation included the impact of a main landing gear doorfrom Enterprise to which thermal tiles had been added. Fivetests were performed (Table 6). All these tests were with velocities and angles that were well below the damage/no damage transition curve. The critical angle is the angle obtainedfrom Eq. (10) for the given impact velocity and Vcrush 68.2m/s. Thus, no crush-up of the tile is to be expected, and nonewas observed. There was minor damage done to the tiles, butall of it appeared to be due to edge damage due to the foamhitting or catching on an edge of the tile. Thus, the impacttesting for the Columbia investigation agrees with the theoretical damage/no damage transition curve presented here.Figure 16. Theoretical damage/no damage transition curve withresults of computations (blue) and all impacts into thermal tiles contained in [1,3] (black) and the Columbia investigation tests (red).Impact into Tiled Surface of OrbiterSo far, the discussion has focused on the impact of a singletile by a piece o
to the RCC and tile and to set conditions for the foam impact testing program. The conclusions drawn in this report do not necessarily reflect the conclusions of the Board; when there is a conflict, the state- . 8.0 MPa 1160 psi 220 kPa 31.9 psi 0 Tile 0.18 g/cm3 11.2 lb/ft3 27.0 MPa 3916 psi 345 kPa 50 psi 0 Table 1. Measured Properties of .