Transcription
iTRAQ Proteomics Profiling of Regulatory Proteins DuringOligodendrocyte DifferentiationMohit Raja Jain1, Tong Liu1, Teresa L. Wood2 and Hong Li1*1Center for Advanced Proteomics Research and Department of Biochemistry and MolecularBiology, University of Medicine and Dentistry of New Jersey -New Jersey Medical SchoolCancer Center, Newark, NJ 071032Department of Neurology and Neuroscience, University of Medicine and Dentistry of NewJersey -New Jersey Medical School Cancer Center, Newark, NJ 07103Running Head: iTRAQ Proteomics Study of Differentiation*Address correspondence to: Hong Li, Department of Biochemistry and Molecular Biology,University of Medicine and Dentistry of New Jersey-New Jersey Medical School Cancer Center,205 South Orange Avenue, F1226, Newark, NJ 07103. Tel: 973-972-8396, Fax: 973-972-5594,E-Mail: liho2@umdnj.edu1
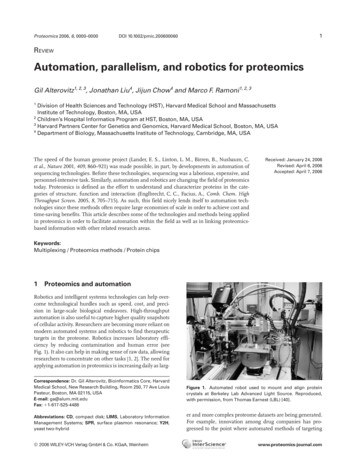
i. SummaryRecent evolution in proteomics approaches from 2-dimensional gel electrophoresis to peptidebased “shotgun proteomics” methods has greatly enhanced the abilities of scientists to uncoverexpression changes among “low abundant” proteins. Shotgun proteomics methods typicallyemploy stable isotope labeling techniques to distinguish peptides from the various sources thatare compared. Recently, a new shotgun quantitative proteomics technology called isobaric tagsfor relative and absolute quantification (iTRAQ) has been developed for protein expressionanalysis. The major strength of the iTRAQ technology is its ability to compare the proteomicchanges among multiple samples in a single experiment. Here we present a protocol on using theeight-plex iTRAQ approach for the discovery of molecular targets in oligodendrocyte progenitorcells during rapamycin-induced inhibition of differentiation. We would provide the technicaldetails on peptide labeling, chromatography, mass spectrometry, database search andbioinformatics procedures for the identification of differentially expressed proteins.2
ii. Key WordsMass spectrometery, iTRAQ, neuroproteomics, expression proteomics, mTOR, oligodendrocyteprogenitor cell, rapamycin3
1. IntroductionSystems biological approaches are increasingly used as unbiased discovery tools to gain insightsinto the functional molecular alterations during neurological diseases (1). Currently microarrayanalysis has been a method of choice for “system-wide” gene expression analysis; however theapplication of microarray approaches has limitations in select biological scenerios, e.g., incerebrospinal fluids which are mostly devoid of mRNAs. Furthermore, mRNA changes do notalways correlate directly to changes at either protein levels or activities as the result of varyingregulatory steps during translation, post-translational modifications, sub-cellular localization anddegradation (2). An evolving approach towards comprehensive understanding of the molecularmechanisms underlying neurological diseases is shotgun neuroproteomics, i.e., the large-scalequantification of peptides and proteins within the contexts of stem cell differentiation,neurodegeneration, neuroregeneration, etc (3, 4). Accurate quantification of peptides relies onthe availability of high resolution mass spectrometers that are increasingly robust and areequipped with sophisticated bioinformatic tools for routine high-throughput analysis. As anexample of earlier shotgun methods, isotope-coded affinity tags (ICAT) reagents are used tolabel proteins (5). They are thiol-reactive chemical “tags” that are designed to contain either alight [12C] or heavy [13C] ICAT reagent with a mass difference of 9 Da. Relative proteinabundance is determined from the relative MS ion abundance of the corresponding ICAT-labeledpeptides. Since the ICAT method selectively quantifies only cysteine-containing peptides, it isable to quantify both protein expression and oxidative modification changes, but unable toquantify proteins that do not contain cysteines (6, 7). Alternatively, in stable isotope labeling byamino acids in cell culture (SILAC) approach (8), the proteomes from two or more cell4
populations are compared which are metabolically labeled during protein synthesis with eitherlight or heavy stable isotope- incorporated amino acids during cell culture. Quantification ofproteins is achieved by comparing the relative abundance of peptides with identical sequences,yet distinguishable in MS by their relative mass due to “heavy” amino acid incorporation.Although SILAC has been proven effective for large scale quantification of proteins and theirphosphorylation changes, it cannot be readily used for studying terminally differentiated cellsincluding neurons since they are not rapidly dividing to incorporate SILAC-specific amino acidsinto proteins. In addition, this method is not suitable for routine analysis of tissues. Bycomparison, the iTRAQ approach has been successfully used for multiplexed protein expressionanalysis from both animal tissues and neuronal cells (9-15). This method utilizes the covalentlabeling of peptides with isobaric mass tags for simultaneous identification and quantification ofpeptides derived from up to eight categories using tandem mass spectrometry (MS/MS) methods.iTRAQ reagents are identical in mass, therefore isobaric, and are consisted of a variety ofisotope-incorporated reporter groups, corresponding stable isotope mass balance groups, and apeptide reactive group. These reagents are covalently linked with peptides via primary amines atlysine side chains and N-termini. The iTRAQ-labeled peptides from up to eight samples can becombined, fractionated using two-dimensional liquid chormatography (LC) and identified andquantified using MS/MS. iTRAQ-labeled peptides labeled with any one of the eight iTRAQ tagsare eluted at the same retention time during the LC steps and they display identical mass duringMS analysis because they are isobaric. During MS/MS peptide fragmentation, the reporter ionsthat contain different combinations of stable isotopes (m/z 113, 114, 115, 116, 117, 118, 119 and121) are released from the iTRAQ-tagged peptides. The peak areas of the reporter ions are usedto determine the relative abundance of each peptide and of the corresponding proteins in each5
sample. A series of peptide y- and b-ions fragments is also generated by MS/MS analysis forprotein identification through protein database matching (16, 17). Since iTRAQ reagents areefficient at labeling nearly all peptides, this method is effective at providing high proteinidentification sequence coverages, allowing sensitive quantification of low-abundant proteinssuch as signal transducers, transcription regulators and membrane receptors (10-12, 14).There are currently two versions of iTRAQ reagents that are available from ABSciex (FosterCity, CA) for the comparison of either four or eight sample categories simultaneously. We willpresent here an 8-plex iTRAQ-based shotgun neuroproteomics method that we have used toelucidate the target pathways downstream from mammalian target of rapamycin (mTOR) inoligodendrocyte progenitor cells (OPCs), following rapamycin induced inhibition of OPCdifferentiation. mTOR is a member of the phosphatidylinositol 3-kinase-like family of serinethreonine kinases that integrates signals from growth factor stimulation and nutrient sensing tomodulate a number of biological processes including cell growth, proliferation, proteintranslation, differentiaton and autophagy (18). mTOR forms two intracellular signalingcomplexes known as mTOR Complex 1 (mTORC1) and mTOR Complex 2 (mTORC2), definedrespectively by the association of mTOR with the adaptor proteins raptor or rictor that directmTOR’s kinase activity towards distinct downstream signaling effectors (19, 20). Inhibition ofmTORC2 during OPC differentiation causes a reduction in the mRNA levels of several keymyelin genes, whereas inhibiting mTORC1 results in decreased myelin protein levels most likelyby interfering with the translation of these transcripts (21). By comparison, recent reports haveshown that the rate of protein translation increases during OPC differentiation in an mTORdependent fashion (22). However, the targets of the mTOR pathway that regulate6
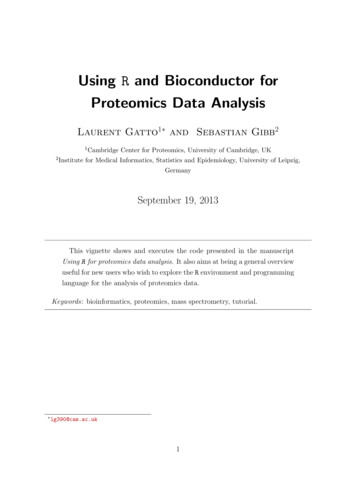
oligodendrocyte differentiation are unknown. To identify novel targets regulated by the mTORpathway during oligodendrocyte differentiation, proteins from four independent control andrapamycin-treated OPCs are processed sequentially with disulfide reduction, alkylation andtrypsin digestion (Fig. 1). The resulting peptides are individually labeled with the iTRAQreagents. The four iTRAQ reagents (113, 114, 115 and 116) are utilized to label the peptidesderived from the four control samples, and another four iTRAQ reagents (117, 118, 119 and 121)are used for labeling the peptides derived from rapamycin-treated samples. Equal amounts of thelabeled peptides are combined and quantified using two-dimensional liquid chormatographycoupled with tandem mass spectrometry.2. Materials2.1 Protein Extraction1. Control and rapamycin treated OPCs2. Phosphate buffer saline (PBS): 1.54 mM Potassium phosphate monobasic (KH2PO4),155.17 mM Sodium chloride (NaCl), 2.71 mM Sodium phosphate dibasic (Na2HPO47H2O)3. Lysis buffer: 500 mM Triethylammonium bicarbonate (TEAB), 1.0 % Igepal CA630(NP-40), 1.0 % Triton X-100, 0.1% v/v each of protease inhibitor cocktail (Sigma, St.Louis, MO), phosphatase inhibitor cocktail 1 (Sigma, St. Louis, MO) and phosphataseinhibitor cocktail 2 (Sigma, St. Louis, MO), pH 8.54. Ultrasonic Homogenizer with 5/32" Micro-Tip (Omni International, Kennesaw, GA)5. Ice bath6. Micro centrifuge 5415 R (Eppendorf, Hauppauge, NY)7
2.2 Protein Estimation1. BCA protein assay kit (Thermo Scientific Pierce, Rockford, IL)2. Protein standard (2.0 mg/ml bovine serum albumin)3. SpectraMax 190 micro plate reader (Molecular Devices, Sunnyvale, CA)2.3 Eight-plex iTRAQ Labeling1. Reducing reagent: 50 mM tris-(2-carboxyethyl) phosphine (TCEP) (AB SCIEX,Foster City, CA)2. Cysteine alkylation reagent: 200 mM methyl methanethiosulfonate (MMTS) (ABSCIEX, Foster City, CA)3. HPLC grade isopropanol4. HPLC grade water5. Trypsin (20 µg/vial, Promega, Madison, WI)6. iTRAQ reagents: 113, 114, 115, 116, 117, 118, 119 and 121 (Part Number 4390811,AB SCIEX, Foster City, CA)7. Vacuum concentrator 5301 (Eppendorf, Hauppauge, NY)2.4 Strong Cation Exchange Liquid Chromatography (SCXLC)1. PerSeptive BioCAD SPRINT Perfusion chromatography system (PerSeptiveBiosystems, Cambridge, MA)2. Mobile phase A: 10 mM KH2PO4 and 25% acetonitrile (ACN), pH 3.03. Mobile phase B: 500 mM KCl, 10 mM KH2PO4 and 25% ACN, pH 3.04. Mobile Phase C: 600 mM KCl, 10 mM KH2PO4 and 25% ACN, pH 6.05. Column: Polysulfoethyl-A column (4.6 mm 200 mm, particle size 5.0 µm, 300 Å(Poly LC Inc., Columbia, MD)8
6. pH paper (Whatman Inc., Piscataway, NJ)7. Two-ml fraction collection tube2.5 Peptide Desalting1. PepClean C18 spin columns (Thermo Scientific Pierce, Rockford, IL)2. Activation solution: 50% ACN3. Equilibration solution: 5% ACN containing 0.5% trifluoroacetic acid (TFA)4. Elution solution: 70% ACN containing 0.1% TFA2.6 Reversed-Phase Liquid Chromatography (RPLC)1. Solvent A: 2% ACN containing 0.1% TFA2. Solvent B: 85% ACN containing 0.1% TFA3. Matrix-assisted laser desorption ionization (MALDI) matrix solution: 6 mg/ml αcyano-4-hydroxycinnamic acid (Sigma, St Louis, MO) in 50% ACN, 5 mMmonobasic ammonium phosphate and internal calibrants (50 fmol/ml each of [Glu1]Fibrinopeptide B (GluFib), m/z 1570.677 (Sigma, St Louis, MO) andadrenocorticotropic hormone 18-39 (ACTH 18-39), m/z 2465.199, (Sigma, St Louis,MO)4. LC-Packings Ultimate chromatography system equipped with a Probot MALDIspotting device (Dionex, Sunnyvale, CA, USA)5. C18 PepMap trapping column (0.3 mm i.d. 5 mm length, 5 µm, 100 Å, Dionex,Sunnyvale, CA, USA)6. C18 PepMap capillary column (0.1 mm i.d. 150 mm length, 3 µm, 100 Å, Dionex,Sunnyvale, CA, USA)9
2.7 Mass Spectrometry1. 4800 Plus MALDI TOF/TOF Analyzer (AB SCIEX, Foster City, CA)2. MALDI plates (AB SCIEX, Foster City, CA)3. Mass standards kit (AB SCIEX, Foster City, CA)4. 4000 Series Explorer (AB SCIEX, Foster City, CA)2.8 Data Analysis Software1. ProteinPilot (AB SCIEX, Foster City, CA, http://www.absciex.com)2. Scaffold (Proteome Software Inc., Portland, OR, http://www.proteomesoftware.com)3. TS2Mascot (Matrix Science Inc., Boston, MA, http://www.matrixscience.com)4. Mascot (Matrix Science Inc., Boston, MA, http://www.matrixscience.com)5. Excel (Microsoft corporation, Redmond, WA, http://office.microsoft.com)3. Methods3.1 Protein Extraction:1. For each sample category, wash 5 106 cells with ice cold PBS twice to remove anyresidual media (see Note 1).2. Carefully harvest the cells in 1 ml of PBS with a corning cell scraper.3. Pellet the cells in a micro centrifuge at 2,500 g at 4 ºC and remove the PBScompletely (see Note 1).4. Re-suspend each cell pellet in 250 µl of cold iTRAQ lysis buffer by vortexing for 15sec at high speed (see Note 2).5. Lyse the cells by a 10-sec sonication pulse followed by a 30-sec incubation in the icebath. Repeat three times. Incubate the cell lysate on the ice bath for 10 min.10
6. Clarify the cell lysate by centrifugation at 16,100 g for 30 min at 4 ºC in a microcentrifuge.7. Carefully transfer the supernatant to a fresh Eppendorf tube.8. Estimate the protein concentrations using the BCA protein assay kit with bovineserum albumin protein standard diluted in the iTRAQ lysis buffer as the standards.Adjust the protein concentrations of all eight samples to same level by diluting thesamples in the iTRAQ lysis buffer (see Note 3).3.2 Protein Digestion with Trypsin1. Transfer 75 µg of proteins from each of the eight samples into a fresh tubes (see Note4).2. Add 2.0 µl of the reducing reagent to each sample. Mix well by vortexing for 15 secand centrifuge briefly to bring down the solution (see Note 4).3. Incubate the mixture at 60 ºC for 1 hr with mixing (see Note 4).4. Add 1 µl of the cysteine alkylating solution. Mix well by vortexing for 15 sec andcentrifuge briefly to bring down the solution. Incubate the solution for 10 min at roomtemperature (see Note 4).5. Reconstitute two vials (20 µg/vial) of sequencing grade trypsin with 80 μl each inHPLC grade water by slowly pipetting the solution up and down a few times. Vortexfor 30 sec and centrifuge briefly to bring down the solution (see Note 5).6. Add 20 μl of the trypsin solution to each sample tube. Vortex for 1 min andcentrifuge briefly to bring the solution down. Incubate the digestion reaction vials at37 ºC for 16 hrs in a water bath. Centrifuge briefly to bring all the solution down atthe bottom (see Note 6).11
3.3 Peptide Labeling with the 8-plex iTRAQ Reagents1. Bring the iTRAQ reagents out of the freezer to room temperature. Centrifuge brieflyto bring the solution to the bottom of the vial (see Note 7).2. Add 100 μL of HPLC grade isopropanol to each vial of the iTRAQ reagent.3. Vortex each vial at high speed for 30 sec and then centrifuge briefly.4. Transfer the entire contents of each freshly prepared iTRAQ reagent to theirrespective tryptic peptide sample tube. Vortex all the tubes at high speed for 30 secand then centrifuge briefly (see Note 8).5. Test the pH of each sample by placing 0.5 μL of the solution onto a pH paper. Ifnecessary, add up to 5 μL of 0.5 M TEAB to adjust the pH of the final solution tobetween 7.5 and 8.5 (see Note 9).6. Incubate the iTRAQ labeling reaction tubes at room temperature for 2 hrs. Vortex andspin down briefly to bring solution to the bottom of the tubes (see Note 10).7. Combine the contents of all eight iTRAQ labeled samples. Vortex to mix, then spindown the solution (see Note11).8. Completely dry the combined sample in a speed vac at room temperature (see Note12).3.4 Two-Dimension LC Separation of PeptidesThe combined iTRAQ-labeled peptides are fractionated first with strong cation exchangechromatography and then with reversed phase chromatography.3.4.1 Strong Cation Exchange Liquid Chromatograpy (SCXLC)12
Various reagents (e.g. TEAB, isopropanol, TCEP, detergents and excess iTRAQ reagents) usedduring protein extraction, digestion and labeling may interfere with either reversed-phase liquidchromatography steps or MS identification and quantification steps; therefore they must beremoved completely beforehand. Peptide mixture is initially fractionated on a PerSeptiveBioCAD SPRINT Perfusion chromatography system equipped with a PolySULFOETHYL Astrong cation exchange column.1. Reconstitute the iTRAQ labeled peptide mixture by adding 4 ml of the SCXLCmobile phase A (see Note 13). Test the pH of the peptide solution using a pH paper.If necessary, adjust the pH of the solution to between 2.7-3.0 by addition of 1 Mphosphoric acid.2. Centrifuge the sample at 20,000 g for 15 min at 25 ºC to pellet the precipitates andparticulates. Carefully transfer the clarified solution into a fresh tube.3. Equilibrate the column for 15 column volume ( 30 mL) with the mobile phase A.4. Inject the iTRAQ-labeled peptides onto the SCXLC column through a 5 ml sampleloading loop (see Note 14).5. After the injection, wash the column with 15 column volume ( 30) with mobile phaseA to remove the unbound iTRAQ reagents and detergents (see Note 15).6. Elute the peptides with a 2-segment linear gradient at a flow rate of 1 ml/minaccording to table below. Collect 2-min fractions during SCXLC in Eppendorf tubes(see Note 16).Time (min)Mobile phase A (%)Mobile phase B (%)Mobile phase C (%)010000455050013
600010075001007. Dry each fraction completely in a speed vac.3.4.2 Concentration and Desalting the SCXLC Fractions with C18 Spin Column1. Re-suspend the peptides in each SCXLC fraction in 200 μl of the equilibrationsolution (see Note 17). Sonicate in a water bath for 15 sec, vortex and then spinbriefly.2. Activate the C18 resin by adding 200 μl of activation solution to the C18 spin columns.Centrifuge at 1,500 g for 1 min. Repeat this step 2 once more.3. Equilibrate the C18 resin by adding 200 μl of the equilibration solution. Centrifuge at1,500 g for 1 min. Repeat this step 3 once more.4. For each re-suspended SCXLC fraction, transfer the solution completely onto anequilibrated C18 spin column. Centrifuge at 1,500 g for 1 min. Collect the flowthrough and load the flow through again onto the spin column. Centrifuge at 1,500 g for 1 min. Repeat the step 4 once more.5. Wash off the unbound salts by adding 200 μl of the equilibration solution onto thecolumn. Centrifuge at 1,500 g for 1 min. Repeat step 5 twice.6. To elute the peptides, add 30 μl of the elution solution onto the column. Collect theeluted peptides by centrifugation at 1,500 g for 1 min in a fresh Eppendorf tube.Repeat this step 6 twice and collect all the eluted peptides from each SCXLC fractionin same tube.14
7. Dry the desalted peptides in speed vac for further fractionation using reversed-phaseliquid chromatography.3.4.3 Reversed-Phase Liquid Chromatography (RPLC)1. Reconstitute the peptides in each SCXLC fraction in 20 μl of RPLC solvent A.Vortex at high speed for 1 min and then spin briefly. Sonicate the sample in a waterbath for 15 sec and vortex. Centrifuge the tubes at 16,100 g for 5 min. Transfer eachsample solution into the bottom of an auto-sampler vial and place all the vials incooled auto sampler tray.2. Equilibrate the RPLC column for at least 20 min with 2% solvent B at 0.300 μl/min.3. For each SCXLC fraction, load 5 μl of the reconstituted peptides onto a C18 trappingcolumn using a microliter pickup injection method at a flow rate of 20 μl/min (seeNote 18). Subsequently, the bound peptides are resolved in a high resolution C18PepMap column at a flow rate of 0.3 μl/min with the following gradient.Time (min)Solvent A (%)Solvent B (%)0982698279010517723775446895959959510098215
1219824. The eluted peptides are mixed with the MALDI matrix solution in a 1:1 ratio througha 30 nL mixing tee and directly spotted onto a MALDI plates in a 33 10 spot arrayformat using Probot, which produces a spot every 12.5 sec (see Note 19).5. Repeat the RPLC steps for each of the SCXLC fractions.3.5 Mass Spectrometry:Peptides spotted on the MALDI plates are analyzed on a 4800 Plus MALDI TOF/TOF Analyzerusing 4000 Series Explorer Software.1. Tune and optimize the sensitivity and resolution of the mass spectrometer using themass standard mixture kit. Check and optimize both metastable ion suppressor andthe timed-ion-selector for specific precursor ion selection at the maximum resolutionof 400, corresponding to 2.5 Da at m/z of 1000. Optimal performing instrument isvery important for accurate iTRAQ quantification outcome (13).2. Using the 6 peptide masses within the mass standard mixture kit, update all three MScalibration parameters (Detector Offset, TOF Offset, B-Factor) of the instrumentusing update default calibration function to ensure maximum mass accuracy. Updatethe MS/MS calibration parameters (Detector Offset, TOF Offset, B-Factor) using theMS/MS ion spectra of the GluFib (m/z 1570.677). (see Note 20)3. For each quantitative project, create a new project on the 4000 Series ExplorerSoftware. Then create a new spot set using a predefined spot set template. Load thesample MALDI plate into the mass spectrometer using the newly established spot set.16
4. Align the plate using the alignment MALDI spots specified in the corresponding spotset template. Confirm that the laser target crosshair in the video viewer is alignedwith the laser spot.5. Create an acquisition, a processing and a job-wide interpretation method for both MSand MS/MS analyses.6. For the MS acquisition method, use positive MS reflector as the operating mode.Specify the mass range of interest as m/z 850-3,000 and the focus mass as 1950 m/z.Set the laser intensity to 3,000 and the detector voltage multiplier at 0.90. Each MSspectrum is averaged over 1,000 laser shots. In the processing method, GluFib (m/z1570.677) and ACTH 18-39 (m/z 2465.199) masses are used as the internalcalibrants. For the interpretation method, set following criteria for precursor selectionfor the subsequent MS/MS analysis; fifteen most abundant precursors per spot,minimum S/N filter at 50, spot to spot precursor mass tolerance at 200 ppm and fromthe rarest to the most abundant MS/MS ion as the data acquisition order.7. For MS/MS acquisition method, use 2KV positive MS-MS method as the operatingmode. Set the laser intensity to 4,000 and detector voltage multiplier at 0.90. Specifythe metastable suppression as “on”, CID as “on” and the precursor mass window atrelative 400 resolution (FWHM). Each MS/MS spectrum is accumulated over 2,000laser shots. In the MS/MS processing method, each spectrum is smoothed using theSavitsky-Golay algorithm with points across peak set at 3 and polynomial order set at4.8. Set the medium CID gas recharge pressure to medium with a threshold of 5.0 107torr.17
3.6 BioinformaticsPeptide identification and quantification is determined by ProteinPilot software (v. 2.0.1) againstthe rat IPI database (v3.55, Release date Feb 12, 2009, 39,874 sequence entries) using theParagon algorithm (23) in the search engine.3.6.1 Protein Identification1. The following default parameters are used for peptide identification by theProteinPilot: identification focused on biological modifications, “thorough” search isengaged, iTRAQ 8-plex as sample type, MMTS as Cys alkylation reagent, trypsin asthe digestion enzyme (see Note 21) and instrument type of 4800 MALDI TOF-TOFare selected. Protein detection threshold is set at an Unused ProtScore of 1.3,corresponding to 95.0% confidence interval (C.I.). The Paragon algorithm setinstrument-appropriate mass error tolerance automatically. The iTRAQ reagentisotopic carryover bias correction is set as automatic.2. In ProteinPilot software, in order to eliminate protein identification redundancy, rawpeptide identification results are first processed by the Pro Group algorithm to createnon-redundant protein groups from the peptides identified. A minimal set of proteinsis produced for a given protein confidence interval threshold. In each group, oneprotein is designated as the winner protein for having the highest Unused ProtScore,meaning with the most number of peptides matched within the homologous group.18
3. To minimize the probability of false identification, consider only the winner proteinswith an Unused ProtScore of at least 1.3 and having at least two distinct peptides witha minimum C.I. of 95% as identified.4. To estimate the protein false discovery rate (FDR), all spectra are also searchedagainst a decoy IPI Rat database containing all the same proteins with reversedsequences using the same search parameters as described above. The FDR iscalculated asFDR 2 (Ndecoy) / (Ndecoy Nforward)where Ndecoy is number of proteins identified using the decoy database, Nforward is thenumber of proteins identified using the regular protein database (in this case Rat IPIprotein database) (13, 24).5. If the FDR is higher than the generally accepted 1.0%, then repeat the search usinghigher Unused ProtScore until the FDR reach less than 1.0%.3.6.2 Protein Quantification1. For relative protein quantification, the Pro Group algorithm calculates the relativeprotein expression ratios using only the iTRAQ ratios obtained from the peptide(s)that are distinct to each protein. The following peptides are excluded fromquantification calculation; a) iTRAQ ion S/N ratio 6. b) C.I. % 1.0%, c) peptidesthat are identified without an iTRAQ modification tag information, d) shared peptides– the spectrum matched to a peptide sequence that is claimed by more than oneprotein.19
2. The relative protein expression for each iTRAQ labeled sample is calculated as theweighted average for all the corresponding peptides.3. Mean protein ratios are normalized for correcting the experimental bias introducedduring labeling. Protein ratios for all iTRAQ labeled proteins are presented as therelative ratios compared to iTRAQ 113-labled proteins (see Note 22).4. To calculate the average protein expression ratios between rapamycin-treated and thecontrol samples, all eight quantification ratios for each protein is exported toMicrosoft Excel and is calculated as follows: (average of the four rapamycintreated)/(average of the four control) values.5. To identify differently expressed proteins, p-values are calculated from the 2-tailedStudent’s T-test for each protein by comparing the four rapamycin treated OPCsratios with the four control OPCs ratio values. Proteins exhibiting a greater than 20%changes (p 0.05) are considered significant (see Notes 23 and 24). These changesare beyond the 10% analytical coefficient of variance for iTRAQ analysis on our MSsystem (13).3.6.3 Alternate Protein Identification and Quantification ProceduresDifferent database search algorithms identify only a fraction of the large number of spectragenerally acquired during a shotgun proteomics experiment. They may also produce differentidentification and quantification results based on the identification cutoff criteria (25). It has beensuggested that by using multiple search engines, a higher proportion of the proteome can bequantified (26, 27). Scaffold software is designed to analyze MS/MS-based proteinidentifications by comparing tandem mass spectrometry data that have been analyzed by the20
more than one search algorithms (e.g. Mascot, X! Tandem etc). To compare and validate thesearch results from multiple search engines; Scaffold uses PeptideProphet and ProteinProphetalgorithms to assign statistical threshold for confidant protein identifications (28, 29).Quantitative analysis of both peptide and protein changes can be further evaluated with the aid ofthe Scaffold Q 2.0 software module. The use of Scaffold analysis of Mascot and X! Tandemsearch results is described below.1. Generate a peak list using TS2Mascot as a mascot generic file (MGF) from thetandem MS spectra using following parameters: mass range form 20-60 dalton belowprecursor, S/N ratio of at least 10.2. Submit the peak list for automated protein sequence database search using a localMascot server (version 2.3) against the rat IPI database (v3.55, Release date Feb 12,2009, 39,874 sequence entries). Set following search parameters, iTRAQ 8-plex (K),iTRAQ 8-plex (N-teminal) and methylthio (C) as fixed modifications; iTRAQ 8-plex(Y) and Oxidation (M) as variable modifications; trypsin as the cleaving enzyme withmaximum of one missed cleavage allowed; monoisotopic, peptide tolerance 50 ppm;MS/MS mass tolerance 0.3 Da. Reverse sequence database search was engaged. Oncethe search is completed, mascot generate a search result file as *.dat file for furtheranalysis.3. Open Scaffold, set up a new file, select quantitative technique as iTRAQ (8-plex), andinsert the iTRAQ reagent purity correction parameters provided by AB SCIEX.4. Load the *.dat file generated by Mascot and select the IPI protein database to be usedfor additional analysis by X! Tandem, using the same search parameters as used forthe Mascot search (see Note 25).21
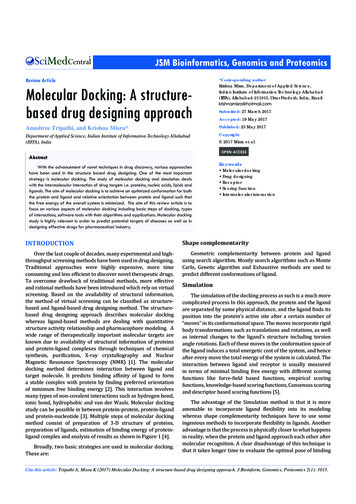
5. After the search is completed, view the list of all the matched proteins in the samplepane of Scaffold. Set the minimum protein identification probability score to 95%,minimum number of peptides to 2 and minimum peptide identification probabilityscore to 95% (see Note 26).6. Invoke the statistics pane in the Q module of Scaffold to evaluate the consistency ofexpression changes among different peptides belonging to the same protein (Fig. 2).If most of the light dots (each representing a peptide) fall near an optimal 45 reporterion correlation line drawn over the scatter plot of all the peptides identified from acontrol and rapamycin-treated sample, such observation represents an 1:1 ratiobetween the selected samples. Therefore, the protein is not differentially expressed. Ifthe selected protein is up-re
University of Medicine and Dentistry of New Jersey-New Jersey Medical School Cancer Center, 205 South Orange Avenue, F1226, Newark, NJ 07103. Tel: 973-972-8396, Fax: 973-972-5594, . dependent fashion (22). However, the targets of the mTOR pathway that regulate . 7