Transcription
AI INNOVATION IN INDUSTRYEditor: Daniel E. O’Leary, University of Southern California, oleary@usc.eduEmerging White-CollarRobotics: The Case ofWatson AnalyticsDaniel E. O’Leary, University of Southern CaliforniaIncreasingly, systems are being built that mightbe called “white-collar robots.” If you watchTV news, you likely would define a white-collar robot as something that takes jobs from white-collarhuman workers. That perspective seems unnecessarily limiting. So, let’s defi ne a white-collar robotas a set of computer-based capabilities that performs a task or a set of tasks historically done bywhite-collar workers, but without the need for human intervention. White-collar robots automateparticular tasks. A human decides what task a robot will do and then chooses a robot to do thattask. As in manufacturing settings, white-collarrobots might be part of a process, providing information inputs or outputs to others, whether peopleor robots. This defi nition is consistent with robotsused for manufacturing and does not require thatthe robot have “consciousness.” Instead, the robotjust does things that need to be done. In general,the robot is likely to be able to do some things better than the person, but the person is likely to dosome things better than the robot.What tasks might a white-collar robot do? Onthe basis of robots in other settings, we wouldprobably expect a white-collar robot to performcertain tasks without the human specifying all ofthe details every time. For example, we might givedata to such a robot and ask it to “analyze it, andI will ask you some questions later—come back tome with some suggestions as to what you think thedata says.” That description is exactly what is beingdone by some analytics software. Increasingly, eventhose with limited statistics or analytics knowledgecan use easy and smart analytic software (robots)to analyze data. These robots are part of an effortto “leave no manager behind” in a “data-drivenMarch/aprIL 2017world” simply because those managers don’t knowmuch about analytics. One such effort, WatsonA naly tics (w w w.ibm.com /analy tics/watsonanalytics), provides active software that helpsany user investigate data. Upload data to the cloud,and Watson Analytics will analyze the data quality, provide initial analysis, and prod you to consider different combinations of variables.Watson Analytics is distinct from Watson Cognitive, which gained fame from capabilities used onthe TV show Jeopardy! The latter’s capabilities focus on text, natural language, and other related applications. As a result, much of the discussion ofWatson’s capabilities is bifurcated into two seemingly independent pieces—cognitive and analytics.Easy and smart analytics may be of great interestto many users. To test the appeal of Watson Analytics, I had roughly 90 master’s degree students use thesoftware as part of a class introducing them to information systems and analytics. The students had limited experience with statistics and analytics, but bythe end of the class, about 90 percent of them identified Watson Analytics as one of the most interesting,important, and potentially useful topics they studied.To begin to understand some of the potentialstrengths and limitations of such software, first see the“Active versus Passive Software” sidebar. I will alsoreview Watson Analytics’ capabilities, analyze twosets of data in the form of case studies, and summarize some of the software’s strengths and limitations.Watson Analytics’ CapabilitiesWatson Analytics requires that the user (or someonehelping the user) negotiate a data upload to the cloud.After the data is uploaded, Watson Analytics provides starting points for the user to analyze the data.These starting points are a sequence of questions that1541-1672/17/ 33.00 2017 IEEEPublished by the IEEE Computer Society63
Active versus Passive SoftwareHistorically, software largely has been passive. Forexample, in the case of statistical software, people input data and then choose which models toanalyze the data. In contrast, Watson Analytics is activesoftware: the software makes recommendations anddoes analysis without needing the user to specify themodels.Increasingly, software is becoming active, and peopleare taking “orders” from it. For example, it is not unusualto have direction or map software guide us when we don’tknow where we are going. Thus, people are beginning toexpect software to make those recommendations, particu-larly if they don’t have any particular knowledge, are unsureabout the set of issues, or don’t want to force themselves tothink about the issues that the software can do (for example, they want to relax and not concentrate, or concentrateon something else).Generally, active software makes assumptions as towhere or what the user wants or needs. Active software islikely to make predictions about what would be useful tothe user. Active software may be autonomous and functionlargely without the user or its inputs. Active software is likelyto be goal oriented. White-collar robots generally will beactive software.Table 1. What drives satisfaction?Independent variable sets*Strength (%)R-squareANOVA statisticalsignificance1. Type of travel370.3551 0.00012. Age and status330.1884 0.00013. No. flights per annumand year of first flight210.0904 0.00014. Price sensitivity and age180.0496 0.00015. No. loyalty cards and age170.0380 0.00016. Status170.1421 0.00017. Age140.0380 0.00018. Status and type of travelModel not testedor found in Watson0.4221 0.00019. Flights per annum and statusModel not testedor found in Watson0.1914 0.0001*The dependent variable is satisfaction.the system has developed on the basis ofthe data—for example, “What drivesX?” “What is a predictive model of Y?”and “What is the trend of Y and Z?”The data format is important toWatson Analytics. Watson doesnot work well when there are morethan two dimensions to the data,say, with row or nested headings, orboth. As an example, column heading by years is appropriate, but column headings that break the datainto multiple layers—such as year,month, revenue, and quantity—will not work well.1 In particular, thesystem works best with data that canbe placed in a classic flat file. However, unlike much statistical software,Watson can analyze variables that are64categorical or numeric. Watson Analytics provides an analysis of the dataquality that indicates “how ready thedata is for analysis.”1 In computingthe data quality for each field, WatsonAnalytics apparently considers severalfactors, including missing values, outliers, symmetry, skewness, and imbalance. The overall data quality score isan average of the data quality score ofevery variable in the dataset. Furthermore, the existence of a data quality score emphasizes the importanceof the data quality to the user. Thisquality number gives the user directinformation about the data’s veracity.Watson Analytics does not appearto use traditional statistical methodssuch as correlation and regressionwww.computer.org/intelligentanalyses, but it does use decision treesto determine which variables appearto influence others and to determinethe “strength” of those relationships.I analyze these and other capabilitiesusing two case studies.Case Study 1:Customer SatisfactionI analyzed a subset of data used byIBM to illustrate Watson Analytics todifferent groups.2 The dataset had 499randomly chosen observations relatedto customer satisfaction in air travel.The variables included type of travel,age, status, number of flights per annum, price sensitivity, number of loyalty cards, gender, and arrival delay.As part of its initial analysis, Watson Analytics analyzed the data andgenerated 10 questions, including thefollowing: What drives satisfaction? How are the variables of flight distance and flights per annum related? What is the relationship betweenarrival delay and departure delay? What is the predictive model ofsatisfaction?Because my interest was in the variable “satisfaction,” two of the questions that Watson asked were of directinterest. I first investigated the question,“What drives satisfaction?” WatsonAnalytics generated seven combinationsIEEE INTELLIGENT SYSTEMS
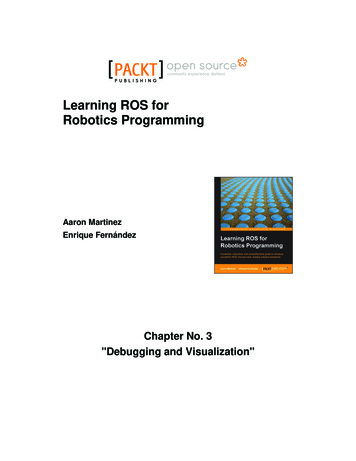
Table 2. Predictive model for satisfaction.Independentvariable sets*R-square forentire sampleSample sizefor modelStatus, type of travel, and no. loyalty cards0.4226156Status, type of travel, arrival delay, and gender0.4483138Status, arrival delay, and type of travel0.433791Arrival delay and type of travel0.3665114*The dependent variable is satisfaction.of one and two variables, listed in Table1 (that is, variable sets 1 through 7). Inaddition, I developed nine regressionequations (for those seven sets and twoadditional sets of variables) to compareWatson’s strength measure and a statistical measure, R-square. Table 1 summarizes the results. Unfortunately, thesystem did not find two of the three setsof variables listed with the largest R-square measures (variable sets 8and 9), although they are combinations of other variables considered byWatson.For this data, the measures ofstrength and R-square are statistically significantly correlated at 0.899,which is statistically significant at better than 0.006, indicating a close relationship between those two variables.However, it is clear there are somedifferences between the two measures for this data, particularly withvariable set 5.All of the variable sets had regression coefficients that were statisticallysignificant at better than 0.05. However, the coefficients on “year of firstflight” and “number of loyalty cards”were not statistically significant. Inaddition, age, number of flights perannum, and price sensitivity hadnegative coefficients, and thus werenegatively related to satisfaction. Iwould expect users to be interestedin knowing whether variables werepositively or negatively related to satisfaction, but unfortunately, Watson Analytics did not provide thatinformation.I also investigated the question,“What is the predictive model of satisfaction?” (see Table 2). As part ofmarch/april 2017building an overall model, Watson Analytics fits different models to differentparts of the data. For this data, usingdecision trees, the system built fourmodels, with corresponding subsamples of 156, 138, 91, and 114 observations. I built regression models for theentire sample on the basis of the fourmodels and included the corresponding R-square for those models. Unlikein Table 1, the number of variables wasnot limited to one or two. Watson Analytics’ measures of strength are notgiven for each of the models and corresponding subsamples, but only for theentire set of models. In this case, it was46.1 percent, which is greater than anyof the one- and two-variable models inTable 1.The decision-tree models are basedon specific values of the particular variables (for example, number of loyalty cards 2). Thus, usingWatson, it is not clear whether the variables are positively or negatively related to satisfaction. Furthermore, inthe predictive model, each submodel isfor only subsets of the variables. As aresult, if actions must be taken for theentire dataset, it is unclear whichmodel to use. However, the predictionmodel does generate what ultimatelyseem to be some sets of variables thatresult in better regression models forthe data, and could clearly be used toguide further analysis. Finally, thosedifferent models offer different potential “global” strategies.Case Study 2:Water Leak DataAs a second case study, I uploaded datafrom a study of the impact of temperawww.computer.org/intelligentture on the total number of water leaksin Los Angeles.3 The data included theobservation number, year, month, totalnumber of leaks in the month (total),and several monthly temperature measures: minimum (min), maximum (max),average (avg), difference betweenthe maximum and minimum (diffmax-min), and difference betweenthe monthly average maximum andminimum (diff-avg). Figure 1 summarizes some of the data, alongwith data quality and reliability measures on each variable. In addition, thesystem provides visualizations of thedata, first in an overview of the dataas a whole, and then for individualobservations.Watson Analytics generates a datareliability measure that can help users consider the data’s quality beforethey make assertions about the data.The system notes that one of the dataelements is a “unique value” and doesnot assess it (it is an index value). Thedata for the number of the month isgiven a score of 100, whereas “total”is given a score of 59. Although usersdon’t directly receive the reasons forthe data’s low reliability, they couldconceivably use the ratings to massage the data to generate a higher reliability rating, which could be appropriate and could drive differentdecisions or data. For example, theuser could remove the more extremeobservations.After the data was input into WatsonAnalytics, the system came back withthe following (starter) questions: What drives diff-avg? What is the predictive model fordiff-avg? How do the variables of diff-avgcompare by month? How are the values of diff-avg andtotal related? What are the most common valuesof month?65
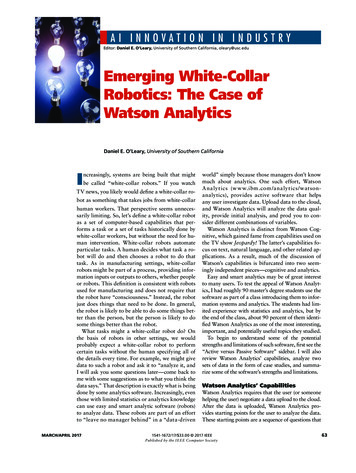
Figure 1. Water leak data quality.Figure 2. Initial Watson analysis of “total” (the number of leaks).Unlike in the first case study, inwhich the system found our particular variable of interest (satisfaction), inthis case, limited attention is given to“total” (that is, the number of waterleaks) and the relationships with temperature. Instead, these questions showprimary interest in diff-avg, ratherthan our concern for the total. Some ofWatson Analytics’ questions wouldprobably rarely be asked by a humaninvestigator (for example, “What arethe most common values of month?”).This illustrates that Watson Analyticsapparently does not employ any semantic understanding of the variables.As a result, its findings do not consider66the semantic reasonableness of the relationships generated. This can result inapparent surprise findings, both interesting and uninteresting.If the system does not generate thequestions that the user wants answered,the user can generate new questions.Thus, I asked the system, “What drivestotal?” and “What is the predictivemodel of total?” In response to the firstquestion, the system created an interesting visualization of a spiral graph (seeFigure 2). As in the first case study, thesystem provided multiple sets of oneand two variables in response to thequestion. The variables are listed by ameasure of “strength.”www.computer.org/intelligentTable 3 summarizes the Watsonstrength measures and the R-squarevalues from the regression models builtwith the corresponding set of variables.Unlike in the first case study, strengthand R-square are not statistically significantly correlated for this data.I also analyzed the findings associated with the question, “What is apredictive model of total?” WatsonAnalytics developed a decision-treemodel with a predictive strength of10.9 percent that employed only asingle variable diff-avg. In previouswork, 3 I built regression models withthe month and year as control variables. Given those two control variables, the best three-variable modelwas with diff-average, a model withan R-square of 0.3078, and not foundby Watson. Whether or not the control variable approach was appropriate, it does not seem that Watson automatically recognizes the notion ofa control variable. In addition, I alsofound an overall best model of year,month, min-min, max-max, and diffavg, with an R-square of 0.3513,which was different than Watson’spredictive model.3Unfortunately, Watson Analyticsdoes not provide information as towhether the variables are positivelyor negatively related to the numberof leaks as part of the prediction.IEEE INTELLIGENT SYSTEMS
Table 3. What drives the total number of leaks?The importance of the relationshipbetween the variables is illustratedby the potential concern of the original analysis, in which the city of LosAngeles claimed that the number ofleaks was decreasing over time. Thiswould result in a negative coefficienton the year variable, and users wouldbe interested in that finding, becauseit indicates that the number of leaks isdecreasing over time, as the Department of Water and Power suggested.Case Studies’ Strengthsand LimitationsIn this short investigation, my analysishas focused on two questions askedby Watson Analytics: “What drivesX?” and “W hat is the predictivemodel of X?”This analysis revealed severalstrengths of Watson Analytics thatprobably apply to other similar analytics software as well. First, suchsoft w are can provide analyticalanaly sis to virtually anyone who canupload data to the cloud. Second, thesystem clearly can generate interesting questions. In some cases, analysisseems likely to bring some surprisingrelationships to the user’s attention.Third, the system considers the dataquality, a variable that is often ignored. Fourth, increased use of analytics through systems such as WatsonAnalytics is likely to impact a manager’s need to understand such analysis,and could lead to more detailed statistical analysis of a broader range of issues. Fifth, Watson is particularly effective in those settings in which somediscrete variables have a thresholdvalue(s) that needs to be managed.However, there are also limitations.Watson Analytics likely frames the datafor the user, which could lead the userto form initial conclusions that are notappropriate under greater scrutiny. Furthermore, Watson Analytics does notfocus on how independent variablesmarch/april 2017Independent variable sets*Strength (%)R-squareANOVA statistical significanceDiff-avg and year500.3007 0.0001Month430.0115 0.0001Diff-max-min and max-max310.1308 0.0001Avg-min210.1089 0.0001Min-min200.1307 0.0001Diff-avg190.1623 0.0001*The dependent variable is “total.”drive the dependent variable, eitherpositively or negatively. As a result, although users might understand whichvariables predict or drive, they may notknow in which direction this occurs.Other limitations include the apparent unavailability of classical statisticaltests, an inability to designate controlvariables, and an inability to chooseparticular statistical methods. In addition, the modeling approach limits thenumber of variables (or at least the user’sperspective) used in estimation to one ortwo variables. Although this approachdoes make it easy to understand the resulting prediction as to what drives avariable, it potentially ignores larger setsof variables. Furthermore, Watson prediction models could be developed onthe basis of multiple variables or not, asboth case studies showed. From a statistical perspective, Watson Analytics doesnot seem to account for multicollinearity or endogeneity.Finally, Watson Analytics does notseem to employ semantic understanding. Perhaps the user could be askedto provide information about thevariables to facilitate the analysis. Alternatively, the system could use naturallanguage and try to understand whatthe variables represent, providing aglimpse at a potential theoretical structure. For example, a person seeing avariable labeled “month” or “year”would likely infer knowledge about thatdata. As another example, in an analysis of another dataset, Watson Analyticsfound that “total time” was related tothe pair “start time” and “finish time,”providing limited insight to the users.www.computer.org/intelligentI n the movie The Incredibles, the vil-lain Syndrome hired Mr. Incredible(a superhero) to unknowingly designan almost unbeatable foe. As Mr. Incredible found limitations in Syndrome’srobot creations, Syndrome would eliminate the limitations and come up witha more formidable and, ultimately, aseemingly indestructible robot. I expectthat Watson Analytics (and other smartand easy analytics) will take a similar evolution as those robots, evolvingfrom its current incarnation to increasingly more capable versions as peoplefind strengths and limitations associated with the software. I expect thatWatson A nalytics will begin to embedadditional analytics and statisticsknowledge. Furthermore, I expect someusers will begin to integrate semanticknowledge and domain expertise tofurther build the capabilities of WatsonAnalytics to provide users with a domain-guided analytics experience.References1. Introduction to IBM Watson AnalyticsData Loading and Data Quality, IBM,Mar. 2016.2. “IBM Watson Analytics WorkshopReference Guide,” IBM, May 2016.3. D.E. O’Leary, “Modeling Los AngelesWater Leaks Using Different Measuresof Temperature,” Advances in Businessand Management Forecasting, K.D.Lawrence and R.K. Klimberg, eds., vol.11, 2016, pp. 187–207.Daniel E. O’Leary is a professor in the Mar-shall School of Business at the University ofSouthern California. Contact him at oleary@usc.edu.67
review Watson Analytics' capabilities, analyze two sets of data in the form of case studies, and summa-rize some of the software's strengths and limitations. Watson Analytics' Capabilities Watson Analytics requires that the user (or someone helping the user) negotiate a data upload to the cloud. After the data is uploaded, Watson .