Transcription
(2022) 22:282Vossius et al. BMC -9Open AccessRESEARCHMortality in nursing home residentsstratified according to subtype of dementia:a longitudinal study over three yearsCorinna Vossius1,2*, Sverre Bergh1,3, Geir Selbæk3,4,5, Jūratė Šaltytė Benth1,5,6, Janne Myhre1, Eivind Aakhus1 andBjørn Lichtwarck1AbstractBackground: There are several subtypes of dementia caused by different pathophysiology and with different clinicalcharacteristics. Irrespective subtype, the disease is progressive, eventually leading to the need for care and supervision on a 24/7 basis, often provided in nursing homes (NH). The progression rate and course of the disease might varyaccording to subtype. The aim of this study was to explore whether the mortality rate for NH residents varied according to the subtype of dementia.Methods: NH residents were followed from admission to NH over a period of 36 months or until death with annualfollow-up examinations. Demographic and clinical data were collected. The diagnosis of dementia and its subtype atbaseline (BL) were set according to international accepted criteria. Kaplan-Meier analysis was performed to estimatemedian survival time. A Cox regression model was estimated to assess the impact of dementia diagnosis and demographic and clinical variables on mortality.Results: A total of 1349 participants were included. When compared to persons with Alzheimer’s disease (AD), persons with frontotemporal dementia (FTD) and dementia with Lewy bodies or Parkinson’s disease dementia (DLB/PDD)were younger and had more neuropsychiatric symptoms. Median survival for the total sample was 2.3 years (95%confidence interval: 2.2–2.5). When compared to persons with AD, having no dementia or unspecified dementia wasassociated with higher mortality, while we found similar mortality in other subtypes of dementia. Higher age, malegender, poorer general health, higher dependency in activities of daily living, and more affective symptoms wereassociated with higher mortality.Conclusion: Mortality did not differ across the subtypes of dementia, except in persons with unspecified dementiaor without dementia, where we found a higher mortality. With a median survival of 2.3 years, NH residents are in thelast stage of their lives and care and medical follow-up should focus on a palliative approach. However, identifying thesubtype of dementia might help carers to better understand and address neuropsychiatric symptoms and to customize medical treatment.Keywords: Nursing home, Mortality, Nursing home mortality, Dementia, Dementia subtypes, Long term nursinghome residents*Correspondence: c.vossius@hotmail.com2Centre for Age‑related Medicine, Stavanger University Hospital,Stavanger, NorwayFull list of author information is available at the end of the articleIntroductionDementia is a syndrome typically occurring in olderadults and characterised by the loss of memory andother cognitive abilities, functional impairment, and The Author(s) 2022. Open Access This article is licensed under a Creative Commons Attribution 4.0 International License, whichpermits use, sharing, adaptation, distribution and reproduction in any medium or format, as long as you give appropriate credit to theoriginal author(s) and the source, provide a link to the Creative Commons licence, and indicate if changes were made. The images orother third party material in this article are included in the article’s Creative Commons licence, unless indicated otherwise in a credit lineto the material. If material is not included in the article’s Creative Commons licence and your intended use is not permitted by statutoryregulation or exceeds the permitted use, you will need to obtain permission directly from the copyright holder. To view a copy of thislicence, visit http:// creat iveco mmons. org/ licen ses/ by/4. 0/. The Creative Commons Public Domain Dedication waiver (http:// creat iveco mmons. org/ publi cdoma in/ zero/1. 0/) applies to the data made available in this article, unless otherwise stated in a credit line to the data.
Vossius et al. BMC Geriatrics(2022) 22:282behavioural symptoms. In Norway, the prevalence ofdementia has been estimated to 100,000 in 2020 or1.8% of the general Norwegian population, and thenumber is projected to rise to more than 236,000,respectively 2.6% of the population by 2050 [1]. Thereare several subtypes of dementia caused by differentpathophysiology and with different clinical characteristics. The most common form in nursing homes (NH)is Alzheimer’s disease (AD), with about 70% of cases,followed by vascular dementia (VaD; 8%), dementia with Lewy bodies or Parkinson’s disease dementia(DLB/PDD; 8%), and frontotemporal dementia (FTD;4%) [2]. Irrespective of subtype, the disease is progressive, eventually leading to the need for care and supervision on a 24/7 basis. However, previous research hasshown that the progression rate and course of the disease might vary according to the subtype, with personswith DLB/PDD having a shorter interval between diagnosis and NH admission and a shorter survival [3–6].In Norway, the highest level of formal care is offeredin NH. Most formal care is organised and financed bythe municipalities. The necessity for NH admission isevaluated by the municipal health and social servicesaccording to functional impairment of the patient.About 50% of persons with dementia have been admitted to NH within three years after the diagnosis ofdementia is made, and 84% of NH residents havedementia [7–9].Population projections predict an increase in theelderly population in the whole world and hence anincrease in the prevalence of persons with dementia,leading again to an increased need for NH services [1, 7].Thus, knowledge about the time from NH admission todeath and predictors for mortality are relevant parameters when dimensioning for future care facilities andplanning for evidence-based end of life care for NH residents. Previous research found that mean survival timefor nursing home residents was just over two years inboth Norwegian and Danish studies [7, 10, 11]. Predicting factors for mortality were higher age, male gender,low functioning in activities of daily living (ADL), poorerphysical health, low nutrition status, and more severedementia [11–15]. A previous study showed that mortality varied across the subtypes of dementia in personsincluded at the point of diagnostic workup, with personswith unspecified dementia having the highest survival,followed by AD and mixed dementia (VaD/AD), whilepersons with VaD and DLB/PDD had the shortest survival [16]. The aim of this study was to explore whetherthe subtype of dementia was a factor predicting mortalityas well in long-term NH residents.Page 2 of 10Material and methodsSettings and participantsIn this study we combined the data from two clinicalstudies following NH residents from admission and overthe whole course of their NH stay with regular follow-up(FU) examinations. Both studies recruited participantsas convenience sample from several counties in Norway,including both rural and urban areas. The demographicand clinical characteristics from both cohorts were similar. These studies were:a. Resource Use and Disease Course in Dementia Nursing Home (REDIC-NH) including 696 persons.Participants were followed over a period of threeyears or until death, with clinical examinations atbaseline (BL) and every six months thereafter. Thestudy took place between 2012 and 2017 [17].b. Cooperation between The Department of Old AgePsychiatry, Innlandet Hospital Trust, and municipalnursing homes in the Innlandet County (SAM-AKSIII). SAM-AKS III is an ongoing study that started in2014. For this study we included 797 residents with aminimum of three years follow-up that were includedin the study from January 2014 to December 2017.Participants were followed with clinical examinationat BL and yearly FU afterwards [18].Inclusion criteria were: (i) 65 years of age or older inREDIC-NH and 60 years of age or older in SAM-AKS IIIor (ii) having dementia irrespective of age. (iii) In addition, expected survival should be six weeks or morefor REDIC-NH and four weeks or more for SAM-AKSIII. Only residents that completed BL assessment wereincluded in the study. BL assessment was aimed to becompleted within four weeks after inclusion, but themean interval between admission and the completedBL assessment was 13.1 weeks (Standard deviation (SD)9.2). A total of 3484 persons were eligible for study inclusion, whereof 1991 (58%) did not participate becausethey or their next of kin did not wish to consent (27%);the resident died before BL assessment (18%); or otherreasons (55%). Those not included were younger (83.7vs 84.7 years; p 0.001) and more often male than thoseincluded (41 vs 35%; p 0.001).For the present study we applied the following exclusion criteria: (i) Participants, where the exact date ofNH admission or end of observation period could notbe established, (ii) participants who moved back homeduring the observation period, and (iii) cases where theinterval between NH admission and BL examination wasmore than one year.
Vossius et al. BMC Geriatrics(2022) 22:282Participants were followed over a period of 36 monthsfrom the time of NH admission or until death. For thisstudy we included data from the clinical monitoring afterone year (FU1), two years (FU2) and three years (FU3).Due to delays in follow-up assessments, FU3 might havetaken place after the end of the observation period.Data collectionData collection was performed by trained healthcareworkers at the NH, mainly registered nurses, undersupervision of research nurses. The research nurses completed a five-day training prior to study start, while thedata collectors completed a two-day training. Data werecollected through structured interviews with the patientand a caregiver [17].All rating scales and inventories were applied using validated Norwegian versions. The following demographicand clinical data were collected:Demographic data, including gender, age, and livingstatus before admission to NH, were collected by reviewing the patient’s journal.Diagnoses of dementia and subtype of dementia at BLwere set according to internationally recognised criteria. The diagnosis of dementia was set independently byfour of the authors (SB, BL, GS, EA). Three were specialists in psychiatry and one was general practitionerand nursing home physician, and all were experiencedin old age psychiatry and research. Diagnoses werebased on all available information about the participants. Each case was reviewed by two of the physicians,and if no consensus was reached, a third psychiatristwas consulted. Dementia, Alzheimer’s disease, vasculardementia, and mixed AD/VaD were diagnosed according to the ICD-10 criteria [19]; DLB/PDD was diagnosed according to the DLB consortium criteria [20].Frontotemporal dementia was diagnosed according tothe Manchester-Lund criteria [21].The Clinical Dementia Rating Scale (CDR) was appliedto assess the severity of dementia. The rating scale comprises six items [22], where total CDR score is givenbased on an algorithm. For statistical purposes we calculated the CDR-sum of boxes (CDR-SoB) that offersan extended range of values compared to the algorithmbased scoring, and is calculated by adding the item scores(range 0–18), where higher scores indicate more severedementia [23].The Neuropsychiatric Inventory (NPI) assesses neuropsychiatric symptoms. The instrument contains 12items and is conducted as an interview with a caregiver.Severity (scored 0–3) was multiplied by frequency(scored 0–4), giving an item score from 0–12, wherehigher scores indicate more severe symptoms [24, 25].Based on a previous principal component analysis, wePage 3 of 10created the following sub-syndromes: NPI-Agitation(agitation/aggression, disinhibition, and irritability),NPI-Psychosis (delusions and hallucinations), and NPIAffective (depression and anxiety) [17].Physical Self-Maintenance Scale (PSMS) consists ofsix items (scored 1–5) and assesses personal activitiesof daily living (PADL) function. The overall score rangesfrom 6 to 30, where higher scores indicate higher PADLdependency [26].General Medical Health Rating (GMHR) rates physical health. It consists of one item, with the four categories excellent, good, moderate, or poor [27].Body mass index (BMI) relates a person’s weight tothe height (BMI weight/height2).EthicsThe residents’ capacity to consent to participation inthe study was considered by the NH staff, includingthe physician. Written informed consent was obtainedby the participants with full capacity to consent, orby next-of-kin on behalf of the participants in caseof reduced capacity to consent. The Regional Ethics Committee for Medical research in South-Eastern Norway approved of the studies (2011/1378a and2014/917) [11].StatisticsDemographic factors and clinical symptoms weredescribed by means and standard deviations (SDs) orfrequencies and percentages. The group differences wereanalysed by Student’s t-test for continuous variables andχ2-test for categorical variables. To evaluate demographicand clinical differences across the subtypes of dementia,we compared the various subtypes to AD as the largestsubtype. Missing values for PSMS, CDR, and NPI itemswere imputed for cases with fewer than 50% missingamong all items by generating an empirical distributionbased on non-missing cases for each item and drawing arandom number from it. Kaplan-Meier analysis was performed to estimate to assess median survival time acrossthe subtypes of dementia. An extended Cox regressionmodel was estimated to assess the impact of dementiadiagnosis, demographic variables, and time-dependentclinical variables on mortality. Bivariate and multiplemodels were estimated. The model assumptions wereassessed by standard statistical tests. A sensitivity analysis was performed by including only participants with BLassessment within 90 days to explore the impact of thetime interval between NH admission and BL assessmenton the distribution of subtypes of dementia and mediansurvival time. Results with p-values below 0.05 were
Vossius et al. BMC Geriatrics(2022) 22:282considered statistically significant. The analyses wereperformed in SPSS v26 and SAS v9.4.ResultsStudy cohortA total of 1493 persons participated in the study at BLexamination (696 from REDIC-NH and 797 from SAMAKS III). Of these, a total of 144 were excluded from further analysis (18 due to missing date of NH admissionor end of observation period; 37 due to an interval ofmore than one year between admission and BL examination; 60 moved back home; 26 withdrew consent; and inthree participants the reason for study termination couldnot be established). Those excluded where younger thanPage 4 of 10those included (mean age 82.6 vs 84.7 years, p 0.002)and a lower proportion had dementia (72% vs 84%,p 0.001).Figure 1 shows a flow chart of the included participantsand attrition during the study period.Table 1 shows demographic and clinical characteristics throughout the observation period and separatelyBL characteristics for those deceased during the observation period, while Table 2 shows demographic and clinical characteristics for the subtypes of dementia at BL.When compared to persons with AD, persons with FTDand DLB/PDD were younger (p 0.011 and p 0.001,respectively) and had more neuropsychiatric symptoms (p 0.003 and p 0.001). Persons with FTD hadFig. 1 Flow chart of the included participants and attrition during the study period. BL baseline, FU follow up
Vossius et al. BMC Geriatrics(2022) 22:282Page 5 of 10Table 1 Demographic and clinical characteristics throughout the observation period and BL characteristics for those deceased duringthe observation periodBLFU1FU2FU3Deceased duringstudy period, BLcharacteristicsParticipants (%)13491014 (75.1)715 (53.0)483 (35.8)778 (57.7)Examination carried out, n (%)1349 (100)849 (84)558 (78)339 (70)Difference since study start, n (%)- Deceased–- othera302 (22.4)566 (42.0)778 (57.7)33 (2)68 (4)88 (6)302 (22.4)264 (26.0)212 (29.7)33 (2)35 (2)20 (1)–Difference since year before, n (%)- Deceased–- other–Gender, female (%)874 (65)677 (67)485 (68)337 (70)482 (62)Age, mean (SD)84.7 (7.5)84.5 (7.5)83.7 (7.7)83.5 (7.7)85.8 (7.0)Living alone before NH; n (%)937 (69)714 (71)506 (71)340 (71)541 (70)GMHR poor or moderate, n (%)648 (52)481 (58)344 (63)205 (65)414 (58)BMI, mean (SD)24.3 (4.9)25.2 (6.6)25.4 (5.3)25.2 (4.7)23.8 (5.0)PSMS, mean (SD)15.0 (4.9)16.5 (4.8)18.1 (4.9)19.5 (5.0)15.9 (4.5)NPI, mean (SD)13.8 (16.8)15.5 (17.3)18.5 (20.0)18.1 (19.6)14.4 (17.0)NPI-AGI, mean (SD)4.3 (7.2)5.3 (7.8)6.7 (8.9)6.4 (8.3)4.4 (7.0)NPI PSY, mean (SD)1.7 (3.7)2.0 (3.9)2.5 (4.3)2.5 (4.5)1.8 (3.8)NPI-AFF, mean (SD)3.7 (4.3)3.4 (5.2)3.6 (5.3)3.5 (5.5)3.8 (4.4)CDR-SoB10.3 (4.3)11.9 (4.1)13.1 (4.1)13.8 (4.0)10.5 (4.4)- No dementia204 (15.1)127 (12.5)82 (11.5)62 (12.8)126 (16.3)- AD766 (57.0)605 (59.7)422 (59.0)284 (58.8)434 (55.8)- VaD81 (6.0)68 (6.7)49 (6.9)33 (6.8)42 (5.4)- AD/VaD64 (4.7)47 (4.6)35 (5.0)25 (5.2)36 (4.6)99 (7.3)74 (7.3)59 (8.3)36 (7.5)57 (7.3)- DLB/PDD66 (4.9)52 (5.1)38 (5.3)25 (5.2)39 (5.0)- Unspecified58 (4.3)31 (3.1)21 (2.9)12 (2.5)39 (5.0)- Cannot be evaluated11 (0.8)10 (1.0)8 (1.1)6 (1.2)5 (0.7)Type of dementia, n (%)-FTDBL baseline, FU follow-up, SD standard deviation, GMHR General medical health rating, BMI Body mass index, PSMS Physical self-maintenance scale, NPINeuropsychiatric inventory, NPI-AGI NPI sub-syndromes agitation/aggression, disinhibition and irritability, NPI-PSY NPI sub-syndromes delusions and hallucinations,NPI-AFF NPI sub-syndromes depression and anxiety, CDR-SoB Clinical dementia rating scale – sum of boxes, AD Alzheimer’s disease, VaD vascular dementia, FTDfrontotemporal dementia, DLB dementia with Lewy bodies, PDD Parkinson’s disease dementiaaOther participants moved to another institution or nursing home has withdrawn from participationmore agitation (p 0.001), and persons with DLB/PDDmore psychosis (p 0.001). Persons with an unspecifieddementia had more affective symptoms (p 0.040). Persons with DLB/PDD lived more rarely alone before NHadmission (p 0.002) and had a higher PADL-dependency at BL (p 0.001).MortalityAt the end of the study period, 57.7% of the participantswhere deceased and 6.5% were lost to follow up due tomoving to another institution or the nursing home withdrawing from participation. Median survival for thewhole cohort was 2.3 years (95% confidence interval (CI)2.2–2.5). Table 1 displays BL characteristics for thosedeceased during the observation period. When compared to participants still alive after 36 months, thosewho deceased were older (83.2 vs 85.8 years; p 0.001),more likely men (31% vs 38%; p 0.009), had more oftenpoor or moderate general health (44% vs 58%; p 0.001),were more dependent in PADL (13.9 vs 15.9; p 0.001),and had a more severe degree of dementia (10.0 vs 10.5;p 0.024).Table 2 shows median survival stratified accordingto subtypes of dementia. NH residents with no dementia had a significantly shorter survival than persons withAD with 1.6 vs 2.4 years (95% CI 1.1–2.0). Persons with
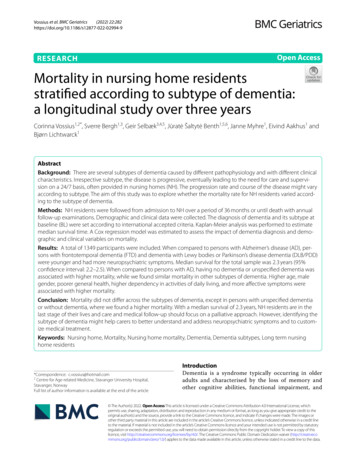
Vossius et al. BMC Geriatrics(2022) 22:282Page 6 of 10Table 2 Demographic and clinical characteristics for the subtypes of dementia at BL, mortality at the end of the observation period,median survival time and a sensitivity analysis including only participants with the BL assessment within 90 days after NH admissionAllNo demen-tia ADVaDAD/VaDFTDDLB/PDDUn-specified dementiaN (%)1349204 (15.1)766 (57.0)81 (6.0)64 (4.7)99 (7.3)66 (4.9)58 (4.3)Age, mean (SD)84.7 (7.5)86.7 (7.7)84.8 (7.3)83.5 (7.0)85.2 (7.9)82.7 (8.0)81.2 (7.9)84.4 (6.4)Gender female (%)874 (65)133 (65)520 (68)52 (64)39 (61)67 (68)23 (35)34 (60)Living alone before NH;n (%)937 (69)155 (76)530 (70)59 (73)44 (69)62 (64)34 (52)45 (78)GMHR poor or moderate, 648 (52)n (%)104 (51)343 (48)51 (63)32 (55)48 (51)40 (64)25 (53)BMI, mean (SD)24.3 (4.9)25.0 (5.9)24.1 (4.8)24.8 (5.0)24.4 (4.7)24.5 (4.2)23.9 (4.9)24.7 (5.0)PSMS, mean (SD)15.0 (4.9)14.7 (4.5)14.8 (4.3)16.0 (4.4)14.9 (4.6)15.0 (4.9)16.9 (4.4)16.4 (4.2)NPI, mean (SD)13.8 (16.8)6.8 (10.5)14.0 (16.7)13.0 (15.6)14.8 (17.7)19.7 (18.0)21.4 (21.6)18.4 (19.1)NPI-AGI, mean (SD)4.3 (7.2)1.4 (3.4)4.4 (7.1)4.1 (7.3)5.0 (7.2)7.9 (8.7)6.2 (9.2)5.2 (8.1)NPI PSY, mean (SD)1.7 (3.7)0.6 (2.1)1.6 (3.5)1.1 (2.8)2.8 (5.1)2.4 (4.5)4.4 (5.6)1.1 (3.2)NPI-AFF, mean (SD)3.7 (4.3)2.5 (4.7)3.9 (5.7)3.3 (5.0)3.0 (5.1)4.2 (5.7)4.0 (6.0)5.6 (6.6)CDR-SoB, mean (SD)10.3 (4.3)5.0 (3.8)11.3 (3.5)11.1 (3.4)10.5 (3.8)11.9 (3.3)11.4 (3.6)10.9 (4.3)Deceased during observation period, n (%)778 (57.7)126 (61.8)434 (57.0)42 (51.9)36 (56.3)57 (57.6)39 (59.1)39 (67.2)Median survival (CI)2.3 (2.2–2.5) 1.6 (1.1–2.0)2.4 (2.2–2.7) 2.6 ( )2.5 (2.1–3.0) 2.7 (2.4–2.9) 2.6 (1.8–3.4) 1.4 (0.6–2.2)Sensitivity analysis: Participants with BL assessment within 90 days after NH admissionN (%)795Median survival (CI)2.3 (2.0–2.5) 1.4 (0.9–1.8)119 (15.0)471 (59.2)40 (5.0)34 (4.3)2.3 (1.9–2.6) 2.6 (1.9–3.3) 2.9 ( )51 (6.4)42 (5.3)31 (3.9)2.7 (2.2–3.2) 2.7 (1.8–3.5) 1.2 (0.6–1.8)BL Baseline, NH Nursing home, AD Alzheimer’s disease, VaD vascular dementia, FTD frontotemporal dementia, DLB dementia with Lewy bodies, PDD Parkinson’sdisease dementia, SD standard deviation, NH nursing home, GMHR General medical health rating, BMI Body mass index, PSMS Physical self-maintenance scale, NPINeuropsychiatric inventory, NPI-AGI NPI sub-syndromes agitation/aggression, disinhibition and irritability, NPI-PSY NPI sub-syndromes delusions and hallucinations,NPI-AFF NPI sub-syndromes depression and anxiety, CDR-SoB Clinical dementia rating scale – sum of boxes, CI Confidence intervalunspecified dementia had a median survival of 1.4 years(95% CI 0.6–2.2), but the result was not statistically significant different from persons with AD. Table 3 shows theresults of the bivariate Cox regression model and the multiple model. When compared to persons with AD, havingno dementia or unspecified dementia was associated withhigher mortality. Of the demographic and clinical characteristics, higher age, male gender, poorer general health,higher PADL-dependency, and more affective symptomswere associated with higher mortality.A sensitivity analysis including only those study participants that completed BL assessment within 90 daysafter NH admission showed that the distribution of thesubtypes of dementia and the median survival timeswere comparable to the findings for the whole cohort.However, in the Cox regression model higher mortality was only associated with higher age, poorer generalhealth, and higher PADL-dependency.Figure 2 displays Kaplan-Meier survival functions forthe various subtypes of dementia. We found that theslopes of the curves were more or less parallel with aneven decline over the course of three years, with onlythe curve for unspecified dementia declining faster.DiscussionWe evaluated the time of survival for the different subtypes of dementia in a cohort of 1349 long-term NHresidents included at admission. Median survival was2.3 years for the whole cohort. Residents with a shortertime of survival were those without dementia (median1.6 years) and those with an unspecified dementia(median 1.4 years, not statistically significantly different),while the different subtypes of dementia did not showany significant difference in survival. Additional predictors of higher mortality were higher age, male gender,poorer general health, higher PADL-dependency, andmore affective symptoms. Our findings of a median survival of 2.3 years, and the demographic and clinical factors associated with higher mortality, are consistent withprevious research [12–15].Previous research has shown that overall survival wasshortest in persons with VaD and DLB/PDD and thatpersons with DLB/PDD were admitted to NH earlierafter the diagnosis of dementia than persons with AD [3,16]. We found that age and the level of neuropsychiatricsymptoms were the BL variables showing the greatestvariance across the subtypes of dementia, with personswith DLB/PDD and FTD being younger and having more
Vossius et al. BMC Geriatrics(2022) 22:282Page 7 of 10Table 3 Results of the cox modelCovariatesBivariate modelsMultiple modelsHR (95% CI)p-valueNo dementia1.36 (1.07; 1.71)0.011AD1HR (95% CI)p-value1.44 (1.08; 1.92)0.012Dementia diagnosis1VaD0.85 (0.58; 1.25)0.4160.81 (0.55; 1.20)0.293AD/VaD0.97 (0.64; 1.47)0.8870.91 (0.60; 1.38)0.648FTD1.08 (0.79; 1.48)0.6391.18 (0.86; 1.62)0.305DLB/PDD0.92 (0.61; 1.39)0.6800.74 (0.49; 1.13)0.168Unspecified dementia1.79 (1.19; 2.70)0.0051.76 (1.17; 2.67)0.007Patient characteristicsAge at admission1.03 (1.02; 1.05) 0.0011.04 (1.03; 1.05) 0.001Gender, male1.24 (1.05; 1.47)0.0141.32 (1.10; 1.58)0.003Lived alone before admission, no1.12 (0.94; 1.34)0.2021.09 (0.90; 1.33)0.360Time dependent variablesGMHR, good or excellent0.64 (0.54; 0.76) 0.0010.80 (0.67; 0.96)0.018PSMS1.10 (1.08; 1.12) 0.0011.10 (1.08; 1.13) 0.001NPI-AGI1.00 (0.99; 1.01)0.9050.99 (0.97; 1.00)0.056NPI- PSY1.02 (1.00; 1.04)0.1421.02 (1.00; 1.04)0.234NPI-AFF1.02 (1.00; 1.03)0.0261.02 (1.00; 1.04)0.022CDR-SoB1.03 (1.01; 1.06)0.0021.00 (0.97; 1.03)0.891HR Hazard ratio, CI Confidence interval, AD Alzheimer’s disease, VaD vascular dementia, FTD frontotemporal dementia, DLB dementia with Lewy bodies, PD Parkinson’sdisease dementia, GMHR General medical health rating, PSMS Physical self-maintenance scale, NPI Neuropsychiatric inventory, NPI-AGI NPI sub-syndromes agitation/aggression, disinhibition and irritability, NPI-PSY NPI sub-syndromes delusions and hallucinations, NPI-AFF NPI sub-syndromes depression and anxiety, CDR-SoBClinical dementia rating scale – sum of boxes, CI Confidence intervalFig. 2 Kaplan-Meier survival functions for the subtypes of dementia. AD Alzheimer’s disease: VaD vascular dementia; FTD frontotemporaldementia; DLB dementia with Lewy bodies; PDD Parkinson’s disease dementia; Unspec unspecified dementia
Vossius et al. BMC Geriatrics(2022) 22:282neuropsychiatric symptoms. These findings are in linewith previous research reporting that neuropsychiatric symptoms are associated with the caregiver burden,while caregiver burden again is associated with the timeto NH admission [28, 29]. Thus, persons with DLB/PDDand FTD were admitted to NH at a younger age, possiblypartly due to more severe neuropsychiatric symptoms,but once admitted to NH the survival time did not differfrom other subtypes of dementia.The shorter survival time in persons without dementiamight be due to higher morbidity as previous researchhas shown that nursing home residents without dementia have a higher frequency of physical diagnoses thanthose with dementia [30]. We also found that personswith unspecified dementia had a shorter survival timethan other subtypes of dementia. This is in contrary toprevious research that evaluated the survival for variousaetiologies of dementia and found that DLB/PDD had theshortest survival while persons with unspecified dementia had the longest survival time [16]. The term “unspecified dementia” subsumes individuals that fulfil thediagnostic criteria for dementia, but where the subtypeof dementia cannot be determined. Thus, this sub-cohortmight be a quite heterogeneous group, where some individuals have developed severe neuropsychiatric symptoms that render an exact diagnosis difficult, while otherparticipants might be admitted to NH due to physicaldiseases as their main health challenge, and the cognitiveimpairment in these cases might be just a comorbidity ora concomitant delirium.Except for unspecified dementia, we did not find anydifferences in survival across the subtypes of dementia. Amedian survival of 2.3 years indicates that nursing homeresidents in general are in the last phase of their lives,where care and medical follow-up should take a palliative approach, focussing on the alleviation of distressingsymptoms and on good quality of life rather than lifeprolonging measures [31]. However, an exact diagnosisof the subtype of dementia will help both the next of kinand the NH staff to better understand and address neuropsychiatric symptoms. In addition, it might give usefulinformation for the choice of medical treatment with forexample anticholinergics or neuroleptics.Strengths and limitations of the studyWe followed a large cohort of 1349 participants in a longitudinal design over three years, with clinical examinations every year. High quality of the data collectionwas secured by a standardized interview carried out byhealthcare workers with adequate training under thesupervision of research nurses. Furthermore, the Norwegian health and social system provides a rather homogenous environment for health service research as there arePage 8 of 10hardly any private actors on the market. Institutional careis provided by the municipalities with comparable criteria for NH admission and standards of care and medicalfollow up during NH residency [11]. Even if the inclusionperiod for the study lasted from 2011 to 2017, we couldshow a stability of the demographic and clinical characteristics over time. In addition, there have not been anyrelevant changes in the Norwegian public health sectorthat would indicate major changes in the NH population,thus ensuring that our finding will still be relevant fortoday’s NH population.Still, the main weakness of this study is that our samplemight not be representative of the general NH populationin Norway. Only participants that completed the BL examination were included, and mean time from admission to BLwas 13.1 weeks. Thus, 338 persons died before BL examination, representing 10% of all residents eligible for the study.Therefore, the overall survival time might be overestimated,and we have no information if some subtypes of dementia might be overrepresented among those dying shortlyafter
follow-up examinations. Demographic and clinical data were collected. The diagnosis of dementia and its subtype at baseline (BL) were set according to international accepted criteria. Kaplan-Meier analysis was performed to estimate median survival time. A Cox regression model was estimated to assess the impact of dementia diagnosis and demo-