Transcription
CNIT 50:Network Security Monitoring6 Command Line Packet Analysis Tools
Topics SO Tool Categories Running Tcpdump Using Dumpcap and Tshark Running Argus and the Ra Client
SO Tool Categories
Three Types of Tools Data presentation Data collection Data delivery
Data Presentation Tools Packet Analysis Tools Read traffic from a live interface or from a savedPCAP file Command-line: tcpdump, Tshark (withDumpcap), and Argus Ra Client Graphical interface: Wireshark, Xplico, andNetworkMiner (see Ch 7)
NSM Consoles Gateways to NSM data Squil, Squert, and ELSA (see Ch 8) Text discusses Snorby but it's abandoned andno longer included in Security Onion Links Ch 1e, 1f
Data Collection Tools These applications collect and generate the NSMdata available to the presentation tools Argus server, Netsniff-ng, PRADS, Snort,Suricata, and Bro
Argus and PRADS Argus server and PRADS create and store theirown form of session data Argus uses a proprietary binary format suited forrapid command-line mining PRADS data is best read through an NSM console
Netsniff-ng Simply writes full-content data to disk in pcapformat
Snort and Suricata Network intrusion detection systems (NIDS) Inspect traffic and write alerts According to signatures deployed with each tool
Bro Observes and interprets traffic that has beengenerted and logged in a variety of NSM datatypes
Data Delivery Tools Middleware between the data presentation anddata collection tools PulledPork manages IDS rules Barnyard2 manages alert processing Capme manages pcap access
Squil Agents Shuttle data from the collection tools to thepresentation software pcap agent and snort agent Apache web server MySQL database Sphinx index application
Integrating Tools Integrate host-centric analysis analysis features OSSEC host IDS Syslog-ng for transport and aggregation of logmessages
Running Tcpdump
Tcpdump Protocol analyzer: understands layers ofnetworking Included in SO but not running by default Often used to analyze pcaps in /nsn/sensor data/ sensorname /dailylogs Can also collect live data
Basic Usage Requires sudoSpecify interface with -i
Other Useful Switches -n Don't resolve names -s # Adjust "snaplength" -- Number of bytes tocollect (default is 68 bytes for IPv4) -c count Only collect count packets (0 for all data) -X Print out packet bytes -w filename.pcap Write PCAP file
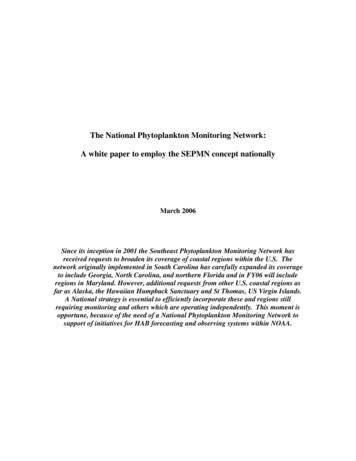
-X
DNS Query & Reply
TCP Handshake [S] SYN[S.] SYN/ACK[.] ACK
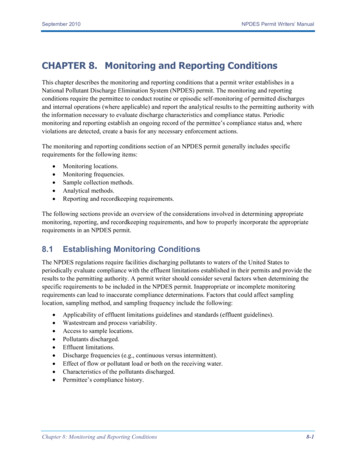
Capture Filters In Berkeley Packet Format (BPF) Add filter to the end of the command line icmp port 53 UDP or TCP port 53 tcp and port 443 man pcap-filter to see all optionsOnly ICMP protocolRequires both conditions
Capture Filters host 192.168.1.1 traffic to or from this IP src host 192.168.1.1 traffic from this IP dst host 192.168.1.1 traffic to this IP src net 192.168.1.0 traffic from this network
Only ICMP Replies
Looping Through Files
Using Dumpcap and Tshark
Shipped with Wireshark Dumpcap is a simple packet collection tool Tshark is the command-line version of Wireshark Analyzes traffic Friendlier than tcpdump Uses human-readable syntax
Tshark as Root Protocol dissectors may contain vulnerabilitiesRecommended: collect with dumpcap, analyzelater with tshark and wireshark
When running as root, Dumpcap can't write to theuser's home directory, so the output's in /tmp Dumpcap captures whole packets by default,unlike tcpdump
Running Dumpcap withoutroot Privileges sudo dpkg-reconfigure wireshark-common
Running Dumpcap withoutroot Privileges sudo usermod -a -G wireshark so sudo reboot
Capturing Pings withDumpcap
Absolute Timestamps inTshark tshark -t ad -r icmp.pcap
Using Display Filters withTshark Display filters use a different format than BPF Display filters don't affect packet capture tshark -r icmp.pcap -Y "icmp.type 0"
Full Decode -V for verbose protocol decode -x for hex and ASCII
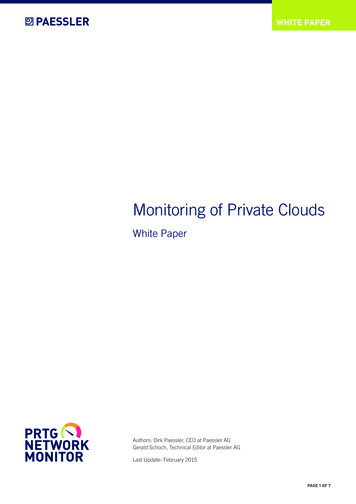
Tshark Display Filters in Action View HTTP Traffic
Tshark Display Filters in Action Use -Y instead of -R
Tshark Display Filters in Action Searching for a range of IP addresses
Running Argus and the RaClient
Argus A session data generation and analysis suite Argus server is running by default on SecurityOnion Client is in /nsm/sensor data/ sensorname /argus directory sudo nsm sensor ps-status --only-argus Shows Argus status
Was Off by Default Do this to start argus sudo sed -i 's ARGUS ENABLED "no" ARGUS ENABLED "yes" g' /etc/nsm/*/sensor.conf sudo service nsm restart
Stopping and Starting Argus sudo nsm sensor ps-stop --only-argus sudo nsm sensor ps-start --only-argus
Argus Data
Argus File Format Argus stores flows, not complete pcaps Much smaller: ex: 48 days of data
Examining Argus Data -n Don't resolve port numbers to names tcp and dst port 21 -s Specify which fields to displayBPF packet filter
Argus Data in SO
Ra Help - switch to filter
Ra Filtered for ICMP
Ra for SSH Many records for the same conversation
Racluster Ra can break a long conversation into separatesections Racluster combines them into one record
Number of Lines
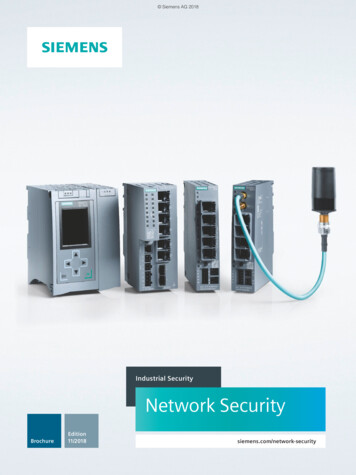
Advanced Usage Example -m saddr daddr groups records by source anddestination IP address
Without -m
With -m Combines many conversations into one record
Advanced Usage Example
Data Presentation Tools Packet Analysis Tools Read traffic from a live interface or from a saved PCAP file Command-line: tcpdump, Tshark (with Dumpcap), and Argus Ra Client Graphical interface: Wireshark, Xplico, and NetworkMiner (see Ch 7)