Transcription
Correlation discovery from network monitoring data in abig data clusterKim ErvastiUniversity of Helsinkikim.ervasti@gmail.comABSTRACTMonitoring of telecommunications network is a tedious task.Diverse monitoring data is propagated through the networkto different kinds of monitoring software solutions. Processing rules are needed for monitoring the data. As manuallyentering the rules is not an option in today’s telecommunication network sizes, automatic data mining inclusive solutions are needed. Existing solutions of data mining thenetwork monitoring data are impacted by performance issues of computationally demanding algorithms. A scalabledistributed solution is needed. This paper surveys existingstudies on distributed solutions for data mining and processing the network monitoring data. We also summarize andevaluate experiment results of these studies and propose direction for future research.Categories and Subject DescriptorsD.4.7 [Organization and Design]: Distributed SystemsKeywordsBig data, network monitoring, event correlation, decentralized data mining, frequent item set, frequent patterns, assocation rules, mapreduce, apache hadoop1.INTRODUCTIONTelephone companies and telecommunications operators havecritical need to monitor their systems: networks and services. Bad quality or even downtime of a service causes lossof money and profits to both the operator and its customers.A telephone company offers broad catalogue of services. Forexample a telephone company could serve mobile phone networks, broadband networks, core networks, hosting services,web services and nowadays even streaming services like Internet movie rentals, home security services etc., as valueadding services. These services are provided on top of mixture of technologies and networks. Also the network equipment rooms and server rooms, the latter often referred ascolocation centres, must be monitored for the safety hostingof these equipment.Network monitoring consists of monitoring data, measurements and event messages from the network equipment. Tounderstand the causes and causalities of this received data,the data must be processed. Processing the network monitoring data is referred as correlating. To correlate the monitoring data, it is required to determine what data is important, which alarms are related to each other, and whichalarm indicates the real cause for a network issue. Thesecorrelation rules are either defined by network experts orgenerated automatically after discovering the rules by datamining the monitoring data.Telecommunication networks are continuously growing bothin size and complexity. Today there is an urgent need fordata mining solutions to automate discovering the effectivecorrelation rules. Countless data mining solutions do exist in this field, but they mostly are not scalable to handlethe rapidly growing amount of data they should be able toprocess.This paper surveys the existing studies on scaling up thesedata mining solutions of network monitoring data to big datascale. The paper is organized as follows: Section 2 presentsa quick overview on the architecture behind network monitoring. Section 3 demonstrates how monitoring data is usedto detect faults in the network and why is this non-trivial.Section 4 then presents how this problem can be solved andimproved by using data mining. Section 5 presents whatare the potential issues in scaling up the data mining of network monitoring data. Section 6 surveys the existing studiesand evaluates the results of these studies and makes furtherproposal. Section 7 concludes the paper.2.NETWORK MONITORING ARCHITECTURETelecommunications operators must monitor their servicesand networks to assure the functionality of the networkand availability of the services provided. All of these networks, consisting different technologies, equipment rooms,server rooms, servers, and services on top of them are monitored by wide spectrum of complex monitoring softwaresolutions. Each monitoring software solution used is specialised to monitor specific part of the network: the monitoring protocols and methods vary depending on what isbeing monitored. The variety is so great that a common
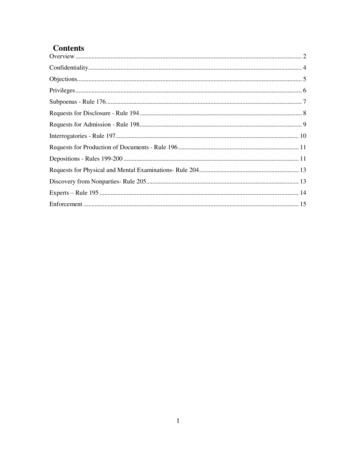
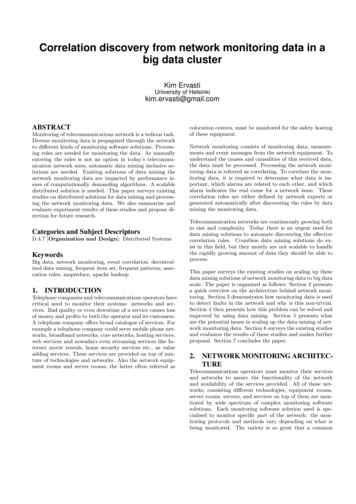
TicketingAutomationsNotificationsNetwork devicesRadio access ork monitoring systemEquipment roomsFigure 1: Network monitoring architecturemonitoring software solution to monitor everything is practically impossible to make. Equipment manufacturers tendto make the monitoring software specialised to their equipment in a closed source manner. In addition to monitoring, these software products work also as network elementmanagers required to operate the equipment. Equipmentlicenses, if nothing else, might prevent using other softwarefor managing as well. Figure 1 illustrates a simplified hierarchy of network monitoring. At the bottom, there are themonitored equipment, referred as network nodes. On theupper level there are the element managers or equipmentspecific monitoring software solutions monitoring and managing these specific technologies. They are used by networkoperators - experts on the specific technology in question.These monitoring systems in turn forward the monitoringdata to a collective network monitoring system capable ofprocessing this monitoring data on a higher level by combining data and discovering correlations of events from differentsources. By processing the data, important network eventsare detected and commonly these three options exist to makeuse of the discovered information: 1) customer notificationscan be generated to notify customers of the situation, 2) automations can be executed to automatically try to fix theissue, for example resetting the equipment, and 3) a serviceticket requesting repairs can be generated to a subcontractor responsible for the equipment. These options are notmutually exclusive.There are different ways to monitor the network. Networkequipment, equipment rooms, servers and services are mostoften monitored from three aspects: 1. by collecting continuous metric measurements data, also known as perfor-mance data, 2. by collecting somewhat continuous end-toend (E2E) testing data, and 3. by receiving discrete eventmessages, referred to as events, from the network nodes.Monitoring software solutions are usually only specialised inone of these ways to monitor the network.Performance data is gathered by collecting numeric datafrom equipment device sensors, network router transfer rates,amount of point-to-point connections (telephone calls), number of Short Message Service (SMS) messages (also knownas text messages) sent per hour, etc. Performance data canbe transformed to discrete event data. This is called discretization. Discretization is done by defining threshold values that when exceeded by the measurement value, causean event to be generated. For example, if the temperaturemeasurement of an CPU increases above 70 C degrees, analarm with minor severity is created. If the temperaturemeasurement further increases above 80 C, another eventwith major severity is created. If the temperature decreasesback to normal, let’s say below 50 C, an acknowledging eventwith severity of normal is created.End-to-end data is results of various end-to-end tests or measurements. As a few examples, 1) how fast a server or aservice is responding from end-to-end, 2) how fast can 1024kilobytes be transferred through 3G mobile network fromdevice to device, 3) is a specific service responding? Theresults of these end-to-end tests are also often transformedto events, for example when the test fails (the tested service is not responding) or the measurement result is abovethreshold (transfer rate is too slow).
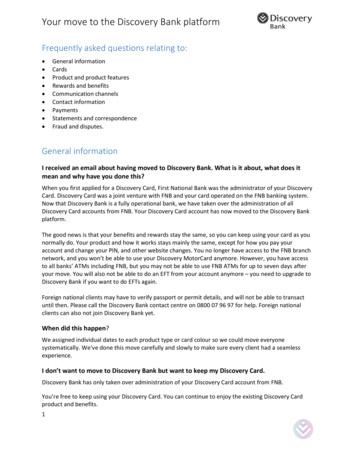
Event data is about equipment hardware or a monitoringagent on a server sending an event message to the monitoringsystem of an event detected on the device. A network eventis for example a device startup, network interface linkdown,or a measurement data value increasing over a predefinedthreshold.3.NETWORK FAULT ISOLATIONNetwork monitoring is about collecting mainly two kindsof equipment state information from the network: 1. statechanges as events, and 2. metric information as measurements, as described earlier. Network monitoring systems donot magically get information of the possible problems in thenetwork [4], because the broken equipment might not be ableto send alarm events to the monitoring systems or the degraded equipment is unable detect the problem by itself. Bygathering measurement and status information, a networkmonitoring system can collect enough known symptoms todetect the fault. In other words, in a case of a problem inthe network or in a service, the monitoring data usually contains symptoms of the fault. A simple example is a brokenhard drive in a server. The server sends an alarm to themonitoring system that the hard drive is unreadable. Thisevent is a very clear symptom of a fault situation occurred:a broken hard drive. However it is not always this trivial.As an example of this is the following scenario of a brokennetwork router. In this example, the router broke without awarning, and therefore it did not manage to send any alarmevent before the fault occurred and now the router is unable to handle any network traffic. But the monitoring dataindicates alarm events coming from other routers in the network saying that network links to this specific router are alldegraded or down. From these symptoms we can concludethat the router is in fact faulted. For a fault, there can bedifferent kinds of symptoms depending on the case. Veryoften multiple different symptoms are observed as a resultof a single fault in the network. Event messages are produced based on those symptoms. It is not rare that a singlefault in the network actually produces a storm of events.The underlying real reason for the occurred fault, the rootcause, is not always obvious even when a fault in the network is detected. In other words the fault in the networkis the problem produced by a certain root cause. In thisexample, the fault is lost or degraded network connectivityaround the broken router, and the broken router equipmentis the root cause for this fault. Symptoms of the fault areslow or zero transfer speeds or high packet loss when usingthis degraded network link.Another more complex, but a very concrete correlation example is illustrated in figure 2. In the figure it is shownthat there is a fault in connectivity in Multiprotocol LabelSwitching (MPLS) core network between two Dense wavelength division multiplexing (DWDM) transponders. As aneffect, the connectivity to the Provider Edge (PE) routeris lost, and a Digital Subscriber Line Access Multiplexer(DSLAM) using that router has lost its connectivity, andall the different equipment using that DSLAM for connectivity are now out of service: a small 3G base station site,and several corporal networks. All three of these types ofequipment, DSLAM, 3G site and Corporal networks, areunder active monitoring of an element manager or monitoring software, so it is quickly discovered that the connectionto those services is lost. Alarms are generated from all ofthese systems individually. The monitoring of the MPLScore network also creates an alarm from the lost link to oneof the DWDM transponders. Although a total of four alarmsare being generated, only one of them is directly indicatingto the device needing repairs. It is however non-trivial todiscover that these four alarms are actually related to eachother when received in a central network monitoring system,seen in figure 1.Finding the root cause for the fault requires root cause analysis based on the available monitoring data of the symptoms.The monitoring data must be combined and correlated. Bycorrelating the network monitoring data we can find whichevents and measurement data are related to a certain problem and which data is not. By combining this problem related data, we can further track down the root cause for theproblem. For example, if we have observations that we havelost a connection to exactly all the base stations under a certain Base Station Controller (BSC), we can conclude fromthis that the problem is not any of the base stations individually, but either the BSC or the transmission link to the BSC.Transmission links provides the transfer of the phone calls,text messages and mobile data between the BSC and the operator, and also the management communication connectionto the BSC, but as we do not observe any alarm event ofthis specific transmission link that provides the connectivityto this BSC, we can conclude that the problem is BSC being broken. To discover the root cause this way, correlationbetween the alarms must be discovered first. That is, whichreceived alarms or measurements are associated with eachother, and which ones are not. For example, if we receivetwo alarms from two different Base Stations, it is not knownautomatically whether those alarms have real correlation toeach other or not. With data mining approaches correlationinformation can be discovered as event correlation patterns[20].4.DATA MINING OF THE ALARM DATAIdentifying the root cause for a network fault, the alarmsrelated to the fault must be discovered. This can be done ifthe network topology is known: a faulted device obviouslyaffects the devices topologically related to the faulted device. Unfortunately in a big telephone company the networktopology is rarely known in a format that could be used inroot cause analysis. This is especially true if the alarms related to the fault are emitted from several different types ofnetworks. Multiple topologies of different types of networkswould be needed and the connections between them wouldbe needed to be known. Services served on top of physicalnetwork, or often a combination of different types of networks, are rarely mapped to the underlying network as acombined topology. As services are often mapped to logicalhosts and connections instead of the physical ones, linkingthem all together as a single combined topology is a complextask. If the topology is not available, the effective relationsamong network equipment must be data mined. Becauseof the huge networks of telecommunications companies, thisapproach requires lots of learning data being provided froma lengthy time period. This makes the data size very bigand the data mining therefore computationally very timeconsuming task.
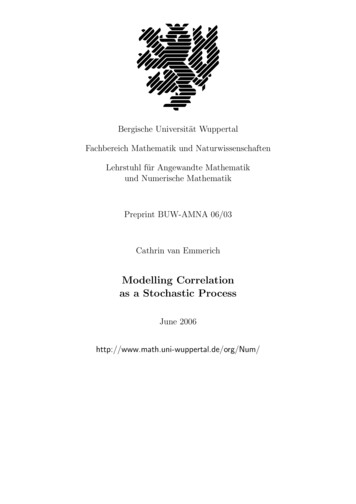
MPLS Core3G siteAlarmDWDMFaultDWDMProvider Edge routerDSLAMAlarmCorporal NetworksAlarmFigure 2: Fault impact in the networkDiscovered patterns of network events and measurementscan also be used for pre-emptive monitoring of the network[18]. Proactive network management in the form of failureprediction is a hot topic in today’s telephone companies.Low severity alarms, warnings and information about routine state changes, are continuously received from networkdevices. Rarely they indicate a real problem occurring inthe near future. Which low severity alarms are an indication of an occurring problem, and with what probability, isnot known a priori. Unfortunately, even equipment manufacturers themselves usually do not know this either. Thatis why it has been a trend to discard these alarms all together. Reacting to everyone of them is not possible whenthe network is in telephone company scale. A low severityalarm or a group of alarms predicting a real problem is astatistic that can be discovered by mining monitoring data,if enough learning data is present. Ren et al. [14] put it abit differently: if we can find a statistical rule that identifiesa correlation between warning events and a fatal event, theoccurrence of those warning events indicates the elevatedprobability of the fatal event occurring in the near future.The figure 3 uses graphical form to illustrate two different,but related predictive patterns discovered from event data.In the example, three different events about symptoms 1, 2and 3, received in this order, are known to precede a network fault with high probability. Also two events aboutsymptoms 1 and 2 in this order are known to precede thesame fault, but with lower probability as shown with edgeD in the figure. Symptom 1 alone does not seem to indicateany fault. In general, patterns of low severity events leadingto severe fault situations do exist in the network monitoring data. When combined with network measurement data,even more useful patterns exist. As the patterns exist, theycan also be discovered with right tools. Discovering thesehidden patterns in the data is the basis of fault prediction.Because of the massive amount of the data, instead of human work data mining approaches must be applied to findthem.In terms of data mining, alarm correlations are regarded asalarm association rules [20]. Association rules are discoveredby searching frequent item sets from the data. The found frequent item sets can then be transformed to association rules.Frequent item sets are sets of one or more items, discoveredfrom the data, that occur in data frequently. The occur-DASymptom 1BSymptom 2CSymptom 3ProblemTimeFigure 3: Pre-emptive patternrence frequency of an item set is called as the support valueof the item set. Support value is defined as ”the amount oftransactions that have the item set” divided by ”the amountof all transactions”. The threshold for an item set being frequent is a user predefined value, called as minimum supportvalue. Frequent item sets are often data mined from transactional data. An easy and typical real life example of transactional data is market purchase data: collections of shoppingitems bought together by customers. In this example, itemsets present sets of merchandise that are often bought together. The association rules present causalities in frequentitem sets. For example, if bread and butter are frequentlybought together, and therefore can be discovered as being afrequent item set, an association rule saying that ”customersthat buy bread, also buy butter often” could be discovered.Discovering association rules is very useful for finding predictive patterns from the network monitoring data. Figure 3could present the following association rule: ”if symptoms 1,2, 3 are detected from the network, the Problem will occur.”A confidence value is attached to each association rule. Thevalue presents the probability that the rule holds. The confidence of a rule is rarely 100%. For example, some peoplemight want to eat their bread without butter, so they buytheir bread without it. Therefore the rule could have confidence of 80%. In the figure 3, the confidence of the edge Dpresented, saying ”if symptoms 1 and 2 occur, the Problemwill occur” has a lower confidence than the rule of detecting all the symptoms first, the edge C. Association rules aregenerated from discovered frequent item sets.In addition to frequent item set discovery, rare events, likecatastrophic failures, which obviously do not occur frequently,can also be of interest. In that case, rare item sets aresearched instead [18, 19, 17, 15]. However, the rare tar-
get event must be known and specified. Data mining is thenapplied to discover the predictive pattern leading to it. Afterperforming either rare or frequent item set data mining andtransforming them to association rules, a confidence can becalculated for each rule. After discovery of such patterns andrules, high confidence rules can be selected to be searchedfrom the new incoming alarm data stream in real time. After detecting a such discovered pattern, a new high severityalarm can be generated in advance with additional information about the root cause before the fault has actuallyoccurred. Depending on whether the fault can actually beprevented or not, either pre-emptive actions or preparationsfor repairments can be made.5.CHALLENGES IN DATA MINING THENETWORK MONITORING DATAApriori algorithm is very commonly proposed and used formining frequent item sets and discovering association rulesfrom transactional data [1]. The Apriori works as follows:First, it finds all the single items in the data, that arefrequent, in other words, the support value of the item isgreater than the predefined minimum support value. Second, it then generates pairs from all the frequent items discovered in step one. Third, the occurrences of these candidate pairs in the data is then counted. The candidates having a support value lower than the minimum support, arepruned. After this step, frequent item sets of two items havebeen discovered. Fourth, then item sets of three items aregenerated among the frequent pairs and items as new candidate item sets of size three, and then counted and prunedsimilarly to candidate pairs. This procedure is continuedby raising the size of the item set until no item set is morefrequent than the minimum support value defines. All theitem sets discovered to be more frequent than the minimumsupport value during the runtime of the algorithm, are frequent item sets. The length of the item sets vary, but ofcourse the interest can be outlined to specific length of sets.The classic Apriori algorithm suffers from exponential exploring space in mining the frequent item sets [20] and itneeds to scan through the data multiple times. Telecommunications networks are often huge and evergrowing notjust in size, but also in complexity and variety of different technologies used. The amount of measurement data intelecommunications network monitoring is daily in terabytescale. Event data is smaller than measurement data, hundreds of megabytes or gigabytes per day, but as discoveryof frequent sets is computationally expensive [20], even thisamount of data introduces challenges for centralized datamining. Both measurement and event data combined makesthe data easily to big data scale. Therefore, to find the patterns in reasonable time, the data mining must be scalable[22]. Apriori algorithm is incapable to discover the temporalrelationship among alarms [20]. Temporality and timing order of alarms has a central role in correlations [20, 14]. Thusthe Apriori algorithm must be modified to work in parallel ina distributed platform and to take temporality into account.6.SURVEY OF PROPOSED SOLUTIONSDistributing Apriori with MapReduce [2, 6] is widely studiedand proposed as implementations. MapReduce is a programming model and implementation for processing massive datasets in parallel in a distributed fashion. Users define onlythe map and reduce functions and the underlying framework automatically handles the distribution of the computation across the cluster, hardware failures and load balancing. Just to name few important groups of contributorson MapReduce distributed Apriori [22, 8, 7, 23]. However,only very few authors have addressed the problem also in thecontext of network event correlation, so the algorithms lackthe ability to take temporality into account. Other big datascaled data mining solutions exist to discover patterns fromfor example market purchase data, medical data and financial data, but this solutions also lack the temporal, timingorder or data dimensionality capabilities network monitoring data requires [14].As described above, network events have an important temporal relationship which also has to be taken into account.This also excludes the possibility to make use of the considerable amount of studies made for big data solutions to datamine market purchase data, medical data financial data.6.1Study 1: Distributed AprioriWu et al. [20] proposed the following interesting features intheir study:1. MapReduce-Apriori algorithm, a MapReduce based implementation of Apriori to discover frequent item setsin parallel.2. translation of network events into transaction formtaking also temporality of events into account.3. decentralized solution of the database to make paralleldata mining possible.4. an approach to filter irrelevant events locally to reducethe total amount of alarm data and further improve theperformance.The problem with data mining the network monitoring datain parallel is in distributing the alarm data. As the correlations among alarms are not known a priori, there is no wayof knowing which alarms are needed at which mining nodeeither. For this, Wu et al. proposed solution of shared filesystem between the nodes, the Global Distributed File System (GDFS). Each node uses their local storage as a cacheand can upload and download files to and from the GDFS.Wu et al. [20] processed all monitoring data into events.Discretizating the measurement data counts on predefinedthreshold values, as described earlier. Because the thresholds are defined by an expert, a risk exists for losing interesting anomalies which might pose relevant information for patterns when combined with other event data, if the thresholdsare set too high or low by misunderstanding the behaviour ofthe equipment, for example. On the other hand, discretizating the measurement data makes the data much easier toapply for data mining and also radically reduces the size ofthe data.Wu et al. [20] transformed the collected events into transactions. Their monitoring environment processes events onlyin durations of five minutes. This simplifies dividing the
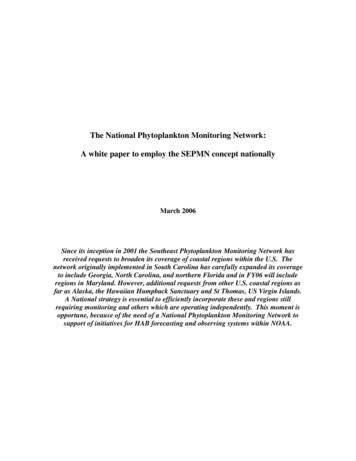
TID1234Time slot00:0000:0500:1000:15TransactionNode 1: eventNode 1: eventNode 1: eventNode 2: ntevent2, Node 2: event 3, Node 3: event 32, Node 2: event 33, Node 3: event 2, Node 4: event 12Table 1: Example of events transformed in to transactionsalarms in to transactions, but in real world use it also introduces unwanted bias to the temporal information of theevents. An example of alarms divided in to transactions isillustrated in table 1. In this simplified example only 4 different nodes, numbered from 1 to 4, have sent events andthe events only have one attribute: an alarm identificationnumber. Alarms are divided in to 5 minute periods.Transactions are then handled as item sets. The goal is tofind correlations among these items in form of associationrules. Apriori-based iterative process is proposed to tacklethis task. Wu et al. divided association rule mining processin to two phases:1. find frequent item sets whose support count is greateror equal to predefined minimum support value2. generate association rules whose confidence is greateror equal to predefined minimum confidence valueBoth of these steps are implemented using MapReduce toparallelize the computations. In frequent item set mining,the candidate sets are generated in the map function, andthe reduce function counts the frequency of the candidategiven to it and only outputs the candidate set if it exceedsthe support threshold. To generate the association rules, allsubsets for every frequent item set must be discovered. Toparallelize rule discovery, subsets are generated in the mapfunction, and the reduce function counts the confidence ofthe rule given to it and only outputs the rule if the confidenceis greater than the confidence threshold. Algorithms arepresented in detail in [20].Wu et al. [20] implemented their algorithm on top of ApacheHadoop framework [3], a widely used open-source implementation of MapReduce architecture. They built a synthetic distributed network for mimicking network environment that generated events. Simulated network elementswere related to each other so the events had correlationsto each other as well. To demonstrate the effectiveness oftheir algorithm they applied both distributed MapReduceApriori and classical centralized Apriori on the data andcompared the execution times to each other. They used twosimilar computers in the distributed implementation to thecomputer they used with the centralized mining.They tested the algorithms with data of 10.000, 20.000,40.000, 70.000 and 100.000 events. The execution times increased exponentially as the amount of data increased to100.000 events. However, despite that one might expectoverhead with the distributed solution, execution times werealmost halved with every data set by using MapReduceApriori when compared to classical Apriori.The implementation Wu et al. proposed shows potential.However, test results with more than just two worker nodesexecuting the data mining would be very interesting to see.6.2Study 2: Overhead of MapReduceAnother group of authors, Reguieg et al. [12], more extensive report also available [13], studied event correlation in abit different context than network alarm data. They usedthe extensive work of Motahari-Nezhad et al. [10] as a basisof their study. Motahari-Nezhad et al. analysed web serviceinteraction log files to identify correlations among eventsthat belong to the same process execution instance. However, this kind of work for discovering of patterns from anevent log is somewhat similar to discovering event patternsfrom system and service log files in a telecommunication service context as well. Motahari-Nezhad et al. structured thelog files in to messages, each containing multiple attributes.Correlated messages are identified by using correlation conditions. In their model, two types of conditions exist: 1)atomic conditions and 2) conjunctive conditions. An atomiccondition is met when two attributes of two messages equalsto each other. A conjunctive condition is a conjunction ofseveral atomic conditions. They did not use Apriori algorithm but developed their own algorithm for finding, candidate generating and pruning the conditions.Reguieg et al. [12] introduced a MapReduce-based approachto discover these correlation conditions in parallel fashion.They partitioned the logs across the cluster nodes to balancethe workload. The implementation had two stages: 1) mapand reduce to compute atomic correlation conditions andtheir associated process instances 2) map and reduce resultslevel-wise to compute conjunctive conditions per process instance.Reguieg et al. [12] experimented their implementation withboth real world datasets and randomly generated data withdiffere
Monitoring of telecommunications network is a tedious task. Diverse monitoring data is propagated through the network to di erent kinds of monitoring software solutions. Process-ing rules are needed for monitoring the data. As manually entering the rules is not an option in today's telecommu-nication network sizes, automatic data mining .