Transcription
Putnam MunicipalOpportunitiesTrustAnnual report4 30 22Income funds invest in bondsand other securities with the goalof providing a steady stream ofincome over time.FUND SYMBOLPMO
Putnam MunicipalOpportunitiesTrustAnnual report4 30 22Message from the Trustees1About the fund2Interview with your fund’s portfolio manager5Your fund’s performance10Information about the fund’s goal, investment strategies,principal risks, and fundamental investment policies12Terms and definitions17Other information for shareholders18Important notice regarding Putnam’s privacy policy19Summary of dividend reinvestment plans20Audited financial statements22Report of Independent Registered Public Accounting Firm23Federal tax information56Shareholder meeting results57About the Trustees58Officers60The fund has adopted a managed distribution policy (the “Distribution Policy”) with the goalof providing shareholders with a consistent, although not guaranteed, monthly distribution. In accordance with the Distribution Policy, the fund currently expects to make monthly distributionsto common shareholders at a distribution rate per share of 0.0531. Distributions may includeordinary and/or tax-exempt income, net capital gains, and/or a return of capital of your investmentin the fund. You should not draw any conclusions about the fund’s investment performance fromthe amount of this distribution or from the terms of the Distribution Policy. The Distribution Policyprovides that the Board of Trustees may amend or terminate the Distribution Policy at any timewithout prior notice to fund shareholders.
Message from the TrusteesJune 14, 2022Dear Fellow Shareholder:The year to date has been difficult for investors, with bond and stock prices fallingin repeated market downturns. Inflation has climbed to levels not seen in decades,prompting the U.S. Federal Reserve to reverse the stimulus that had helped supportfinancial assets since 2020. Markets globally also have reacted to the Russia-UkraineWar and the worsening Covid-19 pandemic in China. In the underlying economy, wehave seen encouraging signs, such as abundant job openings and wage gains in theUnited States.History has shown us that markets eventually recover from crises and may rewardthose focused on long-term goals rather than short-term uncertainties. At Putnam,professional, active investors are working for you. They are monitoring risks while lookingfor strong potential investments for your fund. Learn more in the interview with your fundmanager(s) in the following pages.Thank you for investing with Putnam.Respectfully yours,Robert L. ReynoldsPresident and Chief Executive OfficerPutnam InvestmentsKenneth R. LeiblerChair, Board of Trustees
About the fundPotential for income exempt fromfederal income taxPutnam Municipal Opportunities Trust has the flexibility to invest in municipal bondsissued by any U.S. state or territory. As a closed-end fund, it shares some commoncharacteristics with open-end mutual funds, but there are some key differences thatinvestors should understand as they consider their portfolio.MORE ASSETS AT WORKOpen-end funds are subject to ongoing sales and redemptions thatcan generate transaction costs for long-term shareholders. Closed-endfunds, however, are typically fixed pools of capital that do not need tohold cash in connection with sales and redemptions, allowing the fundsto keep more assets actively invested.TRADED LIKE STOCKSClosed-end fund shares are traded on stock exchanges. As a result,their prices fluctuate because of the influence of several factors.THEY HAVE A MARKET PRICELike an open-end fund, a closed-end fund has a per-share net assetvalue (NAV). However, closed-end funds also have a “market price” fortheir shares — which is how much you pay when you buy shares of thefund, and how much you receive when you sell them.2 Municipal Opportunities Trust
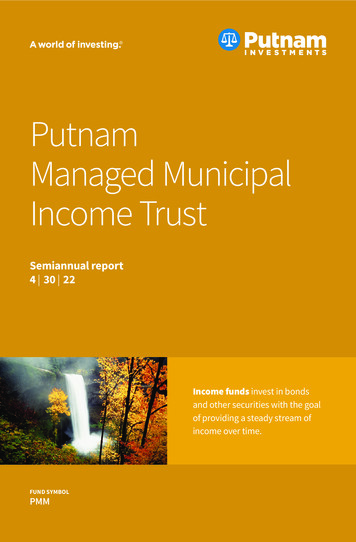
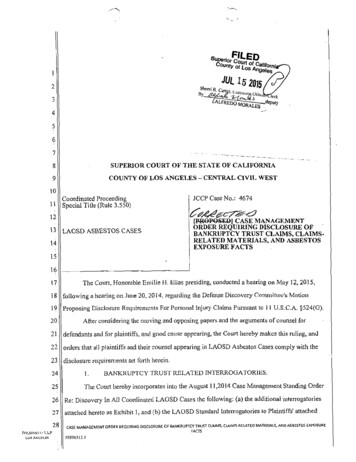
Looking at a closed-end fund’s performanceYou will usually see that the NAV and the market price differ. The market price canbe influenced by several factors that cause it to vary from the NAV, includingfund distributions, changes in supply and demand for the fund’s shares, changingmarket conditions, and investor perceptions of the fund or its investment manager.PUTNAM MUNICIPAL OPPORTUNITIES TRUSTNet asset valueMarket price16Price per share1412108 5/935/985/035/085/135/184/22A mix of credit qualitiesIn addition to its flexible geographical focus, Putnam Municipal Opportunities Trustcombines bonds of differing credit quality. The fund invests in high-quality bonds,but also includes an allocation to lower-rated bonds, which may offer higher incomein return for more risk.Municipal Opportunities Trust 3
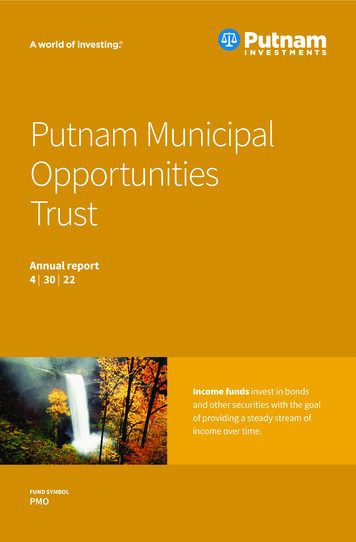
Performance history as of 4/30/22Annualized total return (%) comparisonThe fund — at NAVPutnam Municipal OpportunitiesTrust (NYSE ticker: PMO)5.554.61 5.384.15LIFE OF FUND(since 5/28/93)2.48Fund’s benchmarkBloomberg MunicipalBond Index3.7610 YEARS2.80Fund’s Lipper peer group averageGeneral & Insured Municipal DebtFunds (leveraged closed-end)1.80 2.100.66 0.46 0.305 YEARS3 YEARS1 YEAR–7.88–12.60–11.81Data are historical. Past performance does not guarantee future results. More recent returns may be less or more thanthose shown. Investment return and net asset value will fluctuate, and you may have a gain or a loss when you sell yourshares. Performance assumes reinvestment of distributions and does not account for taxes. Fund returns in the bar chartare at NAV. See below and pages 10–11 for additional performance information, including fund returns at market price.Index and Lipper results should be compared with fund performance at NAV. Fund results reflect the use of leverage,while index results are unleveraged and Lipper results reflect varying use of, and methods for, leverage.All Bloomberg indices are provided by Bloomberg Index Services Limited.Lipper peer group average is provided by Lipper, a Refinitiv company.Recent broad market index and fund performanceU.S. stocks(S&P 500 Index)0.21%Cash(ICE BofA U.S. 3-Month Treasury Bill Index)0.08%Fund’s benchmark(Bloomberg Municipal Bond Index)–7.88%U.S. bonds(Bloomberg U.S. Aggregate Bond Index)Putnam Municipal Opportunities Trust(at net asset value)–8.51%–12.60%This comparison shows your fund’s performance in the context of broad market indexes for the 12 monthsended 4/30/22. See above and pages 10–11 for additional fund performance information. Index descriptions canbe found on page 17.All Bloomberg indices are provided by Bloomberg Index Services Limited.4 Municipal Opportunities Trust
Interview with your fund’s portfolio managerPaul Drury discusses the municipal bondmarket and fund performance for the12 months ended April 30, 2022, as well ashis outlook for the asset class.Paul, how did municipal bonds performduring the 12‑month period endedApril 30, 2022?Paul M. Drury, CFAPortfolio ManagerPaul has a B.A. from Suffolk University. Hehas been in the investment industry sincehe joined Putnam in 1989.Garrett L. Hamilton, CFA, is also a PortfolioManager of the fund.Municipal bonds began the period on solidground, supported by positive supply/demandtechnicals, low interest rates, and strongeconomic growth. In the second half of theperiod, market conditions became more challenging. Investors feared that persistently highinflation might prompt the Federal Reserve topare back pro-growth monetary policies fasterthan expected. Inflation concerns were stokedby supply chain disruptions, rising labor costs,and higher commodity prices. Geopolitical andeconomic uncertainties surrounding Russia’sinvasion of Ukraine in February 2022 alsounnerved investors.At their March 2022 meeting, Fed policymakersraised their benchmark interest rate by aquarter percentage point and signaled theirintent to take further measures to curb thehighest inflation in 40 years. The markets beganpricing in a higher probability that the Fedwould raise interest rates more aggressively. Atthe May 2022 meeting [shortly after the close ofthe fund’s reporting period], Fed officials raisedtheir key rate by half a percentage point, theMunicipal Opportunities Trust 5
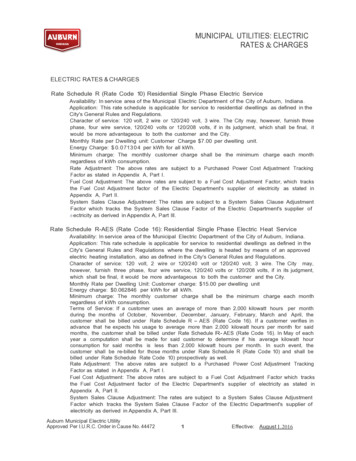
Credit quality overviewAAA4.4%AA30.1A33.7BBB21.4BB3.8Not rated6.6Credit qualities are shown as a percentage of the fund’s net assets (common and preferred shares) as of 4/30/22.A bond rated BBB or higher (SP-3 or higher, for short-term debt) is considered investment grade. This chart reflects thehighest security rating provided by one or more of Standard & Poor’s, Moody’s, and Fitch. Ratings may vary over time.Cash and net other assets, if any, represent the market value weights of cash, derivatives, and short-term securities inthe portfolio. The fund itself has not been rated by an independent rating agency.Portfolio allocation — Top 10 %6.2%NEW YORKOHIO3.1%MASSACHUSETTS5.2%NEW JERSEY11.8%4.2%CALIFORNIAFLORIDA6.2%TEXASTop 10 state allocations are shown as a percentage of the fund’s net assets (common and preferred shares) as of4/30/22. As of 4/30/22, the fund did not have any investments in Puerto Rico. Summary information may differ fromthe portfolio schedule included in the financial statements due to the differing treatment of interest accruals, thefloating-rate portion of tender option bonds, derivative securities, if any, and the use of different classificationsof securities for presentation purposes. Holdings and allocations may vary over time.6 Municipal Opportunities Trust
largest hike in 22 years. The Fed also announcedthat it would begin reducing bond holdings onits balance sheet on June 1, 2022.These actions led to significant outflows frommunicipal bond funds, resulting in increasinglydifficult market technicals. For the 12 monthsended April 30, 2022, the Bloomberg MunicipalBond Index [the fund’s benchmark] returned–7.88%. Short-term municipal bonds outperformed intermediate- and long-term cohorts.From a credit perspective, investment-grademunicipal bonds held up better than higheryielding, lower-rated municipal bonds in therisk-off environment.How did the fund perform during thereporting period?For the 12 months ended April 30, 2022,the fund underperformed its benchmark, anon-leveraged index, due to our leveragingstrategies. The fund’s return was close to that ofthe median fund ranked within its Lipper peergroup, General & Insured Municipal Debt Funds[leveraged closed-end]. [Median is the midpointin a series of values laid out in numerical order.]What strategies or holdings influenced thefund’s performance during the period?With the significant sell-off in fixed income inearly 2022, we believed municipal bonds hadbecome more attractive. We extended theportfolio’s duration, a measure of the fund’sinterest-rate sensitivity. At period-end, thefund’s duration was modestly long relative tothe level of its Lipper peer group. We believe thispositioning may help the fund outperform if theyear-to-date rise in interest rates reverses course.At period-end, the fund held an overweightexposure to bonds rated A and BBB relativeto the benchmark. From a sector- orindustry-positioning perspective, we favoredcontinuing-care retirement communities,water/sewer, and charter school bonds relativeto the fund’s Lipper peer group.Regarding our strategy for state debt, the fundheld an overweight exposure to Illinois relativeAlthough supply/demandtechnicals remain challenged,we believe credit fundamentalsare strong and valuationsare attractive.Paul Druryto its Lipper peer group. We believe Illinois’sfinancial profile continues to stabilize, andits flexibility and credit fundamentals haveimproved since the onset of the Covid-19pandemic in the United States.The fund remained underweight in its exposureto uninsured Puerto Rico municipal debtrelative to its Lipper peer group. At period-end,the fund had no holdings in bonds issuedby Puerto Rico. However, we have becomesomewhat more optimistic about the U.S.territory’s credit fundamentals. In March2022, Puerto Rico ended its nearly five-yearbankruptcy with a plan to restructure its debt,resume payments to bondholders, and restoreits public pension system. We continue tomonitor Puerto Rico-related debt for potentialinvestment opportunities.How did you use derivatives duringthe period?We utilized swaps to hedge or gain exposureto interest-rate and term structure riskand to hedge or gain exposure to inflation.Additionally, we used futures for hedgingTreasury term structure risk and yieldcurve positioning.What were the fund’s distributions duringthe period?The fund’s distributions are fixed at a targetedrate. The targeted rate is not expected to varywith each distribution but may change fromtime to time. During the last fiscal year, the fundmade monthly distributions totaling 0.6372per share, which were characterized as 0.2331per share of net realized gain, and 0.4041 pershare of net investment income. While thereMunicipal Opportunities Trust 7
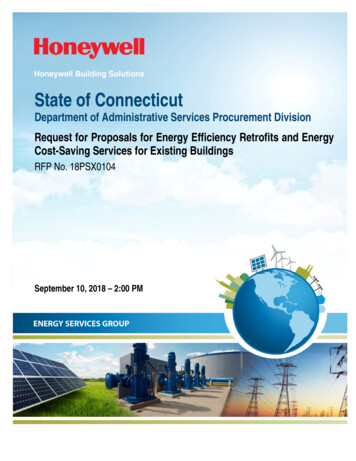
were no distributions of capital during the fiscalyear, distributions of capital decrease the fund’stotal assets and total assets per share and,therefore, could have the effect of increasingthe fund’s expense ratio. In general, the policy offixing the fund’s distributions at a targeted ratedoes not affect the fund’s investment strategy.However, in order to make these distributions,on occasion the fund may have to sell portfoliosecurities at a less than opportune time.[Please see the Distributions to shareholdersnote on page 56 for more information onfund distributions.]What is your current assessment of thehealth of the municipal bond market?Municipal bonds have faced headwinds so far in2022 as positive seasonal factors waned, fundflows turned negative, and the market adjustedto a quicker pace of monetary policy normalization. However, municipal credit fundamentalsremain strong, in our view. Unprecedentedfiscal support, tax revenue outperformance, andstrong economic growth expectations put moststate and local governments in their best fiscalshape for more than a decade. State and local taxcollections also were up 13.6% in 2021 comparedwith 2020. Finally, municipal defaults are runningbelow long-term averages year to date throughApril 30, 2022, and remain isolated to the lowestrated cohorts. As such, we believe the creditoutlook is currently the most favorable factorsupporting the asset class.What is your outlook?Higher-than-expected inflation and stronglabor reports during the early months of 2022have seemingly cemented the Fed’s pivotto a hawkish stance. The market has quicklyrepriced to reflect a faster pace of policy normalization. In our view, the Fed is likely to continuethe path of monetary policy normalization. Webelieve this process could contribute to heightened market volatility but also present investorswith attractive opportunities.We expect pandemic-related supply chainpressures will begin to ease and U.S. economicactivity will slow in the second half of 2022.We think the combination could contributeto slower growth and lower inflation, whichComparison of top sector weightingsHealth careas of 10/31/21as of 4/30/2215.3%19.1%Transportation14.9%14.4%State debt15.1%12.0%Local debt7.3%10.6%Education9.3%9.8%This chart shows how the fund’s top weightings have changed over the past six months. Allocations are shown asa percentage of the fund’s net assets (common and preferred shares). Current period summary information maydiffer from the information in the portfolio schedule notes included in the financial statements due to the inclusionof derivative securities, any interest accruals, the timing of matured security transactions, the use of differentclassifications of securities for presentation purposes, and rounding. Holdings and allocations may vary over time.8 Municipal Opportunities Trust
could lead to a slower pace of monetary policynormalization than is currently priced in.Although supply/demand technicals remainchallenged, we believe credit fundamentalsare strong and valuations are attractive. Futurereturns look more promising for longer-terminvestors, in our opinion.Thank you, Paul, for your time andinsights today.The views expressed in this report are exclusivelythose of Putnam Management and are subject tochange. Disclosures provide only a summary ofcertain changes that have occurred in the past fiscalperiod, which may not reflect all of the changesthat have occurred since an investor purchased thefund. They are not meant as investment advice.Please note that the holdings discussed in thisreport may not have been held by the fund for theentire period. Portfolio composition is subject toreview in accordance with the fund’s investmentstrategy and may vary in the future. Currentand future portfolio holdings are subject to risk.Statements in the Q&A concerning the fund’sperformance or portfolio composition relative tothose of the fund’s Lipper peer group may referenceinformation produced by Lipper Inc. or through athird party.HOW CLOSED-END FUNDS DIFFER FROM OPEN-END FUNDSMore assets at work Open-end fundsare subject to ongoing sales and redemptions that can generate transaction costsfor long-term shareholders. Closed-endfunds, however, are typically fixed poolsof capital that do not need to hold cash inconnection with sales and redemptions,allowing the funds to keep more assetsactively invested.Traded like stocks Closed-end fund sharesare traded on stock exchanges and, as aresult, their prices fluctuate because of theinfluence of several factors.They have a market price Like anopen-end fund, a closed-end fund has aper-share net asset value (NAV). However,closed-end funds also have a “marketprice” for their shares — which is howmuch you pay when you buy shares of thefund, and how much you receive when yousell them.When looking at a closed-end fund’sperformance, you will usually see that theNAV and the market price differ. The marketprice can be influenced by several factorsthat cause it to vary from the NAV, includingfund distributions, changes in supply anddemand for the fund’s shares, changingmarket conditions, and investor perceptions of the fund or its investment manager.A fund’s performance at market pricetypically differs from its results at NAV.Putnam Municipal Opportunities TrustNet asset valueMarket price 1612Price per shareClosed-end funds and open-end fundsshare many common characteristics butalso have some key differences that youshould understand as you consider yourportfolio strategies.8404/12 4/13 4/14 4/15 4/16 4/17 4/18 4/19 4/20 4/21 4/22Municipal Opportunities Trust 9
Your fund’s performanceThis section shows your fund’s performance, price, and distribution information for periods endedApril 30, 2022, the end of its most recent fiscal year. In accordance with regulatory requirementsfor mutual funds, we also include performance information as of the most recent calendarquarter-end. Performance should always be considered in light of a fund’s investment strategy.Data represent past performance. Past performance does not guarantee future results. More recentreturns may be less or more than those shown. Investment return, net asset value, and market pricewill fluctuate, and you may have a gain or a loss when you sell your shares.Fund performance Total return and comparative index results for periods ended 4/30/22Life of fund(since 5/28/93)10 years5 years3 years1 yearNet asset value5.55%4.15%2.80%0.66%–12.60%Market price5.233.832.470.64–18.22Bloomberg MunicipalBond Index4.612.481.800.46–7.88Lipper General & InsuredMunicipal Debt Funds(leveraged closed-end)category average*5.383.762.100.30–11.81Performance assumes reinvestment of distributions and does not account for taxes.Index and Lipper results should be compared with fund performance at net asset value. Fund results reflect the useof leverage, while index results are unleveraged and Lipper results reflect varying use of, and methods for, leverage.Lipper peer group average is provided by Lipper, a Refinitiv company.All Bloomberg indices are provided by Bloomberg Index Services Limited.* Over the 1-year, 3-year, 5-year, 10-year, and life-of-fund periods ended 4/30/22, there were 58, 51, 49, 44, and 23funds, respectively, in this Lipper category.Performance includes the deduction of management fees and administrative expenses.Change in the value of a 10,000 investmentCumulative total return from 4/30/12 to 4/30/22Putnam Municipal Opportunities Trust at net asset valuePutnam Municipal Opportunities Trust at market priceBloomberg Municpal Bond Index 15,018 15,000 10,000 12,770 10,000 5,000’12’13 14,557’14’15’16Past performance does not indicate future results.10 Municipal Opportunities Trust’17’18’19’20’21’22
Fund price and distribution information For the 12-month period ended 4/30/22DistributionsNumber12Income 1 0.404123Capital gains 2Long-term gains0.144297Short-term gains0.088780Total 0.637200Distributions — Preferred sharesIncome 1Series B(2,876 shares)Series C(2,673 shares) 41.30 41.42Capital gains 2Long-term gains5.044.94Short-term gains3.153.04Total 49.49 49.41NAVMarket price4/30/21 13.95 13.724/30/2211.6310.69NAVMarket priceShare valueCurrent dividend rate (end of period)Current dividend rate 35.48%Taxable equivalent 49.265.96%10.07The classification of distributions, if any, is an estimate. Final distribution information will appear on your year-endtax forms.1 For some investors, investment income may be subject to the federal alternative minimum tax. Income fromfederally exempt funds may be subject to state and local taxes.2 Capital gains, if any, are taxable for federal and, in most cases, state purposes.3 Most recent distribution, including any return of capital and excluding capital gains, annualized and divided by NAVor market price at end of period.4 Assumes maximum 40.80% federal tax rate for 2022. Results for investors subject to lower tax rates would not beas advantageous.Fund performance as of most recent calendar quarter Total return for periods ended 3/31/22Life of fund(since 5/28/93)10 years5 years3 years1 yearNet asset value5.76%4.90%4.08%2.62%–6.34%Market price5.544.854.693.49–8.86See the discussion following the fund performance table on page 10 for information about the calculation offund performance.Municipal Opportunities Trust 11
Information about the fund’s goal, investment strategies,principal risks, and fundamental investment policiesGoalThe goal of the fund is to seek as high a level ofcurrent income exempt from federal income tax as webelieve to be consistent with preservation of capital.The fund’s main investment strategies andrelated risksThis section contains detail regarding the fund’s maininvestment strategies and the related risks you faceas a fund shareholder. It is important to keep in mindthat risk and reward generally go hand in hand; thehigher the potential reward, the greater the risk.The fund intends to achieve its objective by investingin a portfolio of investment-grade and some belowinvestment-grade municipal bonds selected byPutnam Management. The fund also uses leverage,primarily by issuing preferred shares in an effort toenhance the returns for the common shareholders.The fund’s shares trade on a stock exchange atmarket prices, which may be lower than the fund’s netasset value. The fund’s use of leverage involves risks,which are discussed in more detail below, and mayincrease the volatility of the fund’s net asset value. Tax-exempt investments. These investments areissued by or for states, territories or possessions ofthe United States or by their political subdivisions,agencies, authorities or other government entities,and the income from these investments is exemptfrom federal income tax. These investments areissued to raise money for public purposes, suchas loans for the construction of housing, schoolsor hospitals, or to provide temporary financing inanticipation of the receipt of taxes and other revenue.They also include private activity obligations of publicauthorities to finance privately owned or operatedfacilities. Changes in law or adverse determinationsby the Internal Revenue Service could make theincome from some of these obligations taxable. Alternative minimum tax risk. The fund may investin municipal securities and private activity bondsthat generate interest that is subject to federal alternative minimum tax (AMT). As a result, taxpayerswho are subject to the AMT potentially could earn alower after-tax return. Corporate shareholders willbe required to include all exempt interest dividendsin determining their federal AMT. For more information, including possible state, local and other taxes,contact your tax advisor. General obligations. These are backed by theissuer’s authority to levy taxes and are consideredan obligation of the issuer. They are payable fromthe issuer’s general unrestricted revenues, although12 Municipal Opportunities Trustpayment may depend upon government appropriation or aid from other governments. Theseinvestments may be vulnerable to legal limits on agovernment’s power to raise revenue or increasetaxes, as well as economic or other developmentsthat can reduce revenues. Revenue obligations. These are payable fromrevenue earned by a particular project or otherrevenue source. They include private activity bondssuch as industrial development bonds, which arepaid only from the revenues of the private owners oroperators of the facilities. Investors can look only tothe revenue generated by the project or the privatecompany operating the project rather than the creditof the state or local government authority issuing thebonds. Revenue obligations are typically subject togreater credit risk than general obligations because ofthe relatively limited source of revenue. Tender option bonds. The fund may leverage itsassets through the use of proceeds received throughtender option bond transactions. In a tender optionbond transaction, the fund transfers a fixed-ratemunicipal bond to a special purpose entity trust (TOBtrust) sponsored by a broker. The TOB trust funds thepurchase of the fixed rate bonds by issuing short-termfloating-rate bonds to third parties and allowing thefund to retain the residual interest in the TOB trust’sassets and cash flows, which are in the form of inversefloating rate bonds. The inverse floating rate bondsheld by the fund give the fund the right to (1) causethe holders of the floating rate bonds to tender theirnotes at par, and (2) to have the fixed-rate bond heldby the TOB trust transferred to the fund, causing theTOB trust to be liquidated. The fund will look throughto the underlying municipal bond held by a TOB trustfor purposes of the fund’s 80% policy referencedbelow under the heading “The fund’s fundamentalinvestment policies.” Interest rate risk. The values of bonds and otherdebt instruments usually rise and fall in responseto changes in interest rates. Interest rates canchange in response to the supply and demand forcredit, government and/or central bank monetarypolicy and action, inflation rates, and other factors.Declining interest rates generally result in an increasein the value of existing debt instruments, and risinginterest rates generally result in a decrease in thevalue of existing debt instruments. Changes in adebt instrument’s value usually will not affect theamount of interest income paid to the fund, butwill affect the value of the fund’s shares. Interestrate risk is generally greater for investments withlonger maturities.
Some investments give the issuer the option to call orredeem an investment before its maturity date. If anissuer calls or redeems an investment during a timeof declining interest rates, we might have to reinvestthe proceeds in an investment offering a lower yield,and, therefore, the fund might not benefit from anyincrease in value as a result of declining interest rates. Credit risk. Investors normally expect to be compensated in proportion to the risk they are assuming.Thus, debt of issuers with poor credit prospectsusually offers higher yields than debt of issuerswith more secure credit. Higher-rated investmentsgenerally have lower credit risk.We invest mainly in investment-grade debt investments. These are rated at least BBB or its equivalentat the time of purchase by a nationally recognizedsecurities rating agency, or are unrated investmentsthat we believe are of comparable quality. We mayinvest up to 30% of the fund’s total assets in noninvestment-grade investments. However, we will notinvest in investments that are rated lower than BBor its equivalent by each agency rating the investment, or are unrated securities that we believe areof comparable quality. We will not necessarily sell aninvestment if its rating is reduced after we buy it.We may also invest in investment that are belowinvestment-grade (sometimes referred to as “junkbonds”), which can be more sensitive to changes inmarkets, credit conditions, and interest rates andmay be considered speculative. These investmentsare rated below BBB or its equivalent, which reflectsa greater possibility that the issuers may be unable tomake timely payments of interest and principal andthus default. If default occurs, or is perceived as likelyto occur, the value of the investment will usually bemore volatile and is likely to fall. The value of a debtinstrument may also be affected by changes in, orperceptions of, the financial condition of the issuer,borrower, counterparty, or other entity, or underlyingcollateral or assets, or changes in, or perceptions of,specific or general market, economic, industry, political, regulatory, geopolitical, environmental, publichealth, and other conditions. A default or expecteddefault could also make it difficult for us to sell theinvestment at a price approximating the value we hadpreviously placed on it. Tax-exempt debt, particularlylower-rated tax-exempt debt, usually has a morelimited market than taxable debt, which may at timesmake it difficult for us to buy
Putnam Municipal Opportunities Trust Annual report 4 30 22 Message from the Trustees 1 About the fund 2 Interview with your fund's portfolio manager 5 Your fund's performance 10 Information about the fund's goal, investment strategies, principal risks, and fundamental investment policies 12 Terms and definitions 17