Transcription
PutnamManaged MunicipalIncome TrustSemiannual report4 30 22Income funds invest in bondsand other securities with the goalof providing a steady stream ofincome over time.FUND SYMBOLPMM
PutnamManaged MunicipalIncome TrustSemiannual report4 30 22Message from the Trustees1About the fund2Interview with your fund’s portfolio manager5Your fund’s performance10Consider these risks before investing12Terms and definitions13Other information for shareholders14Summary of dividend reinvestment plans15Financial statements17Shareholder meeting results54The fund has adopted a managed distribution policy (the “Distribution Policy”) with the goalof providing shareholders with a consistent, although not guaranteed, monthly distribution. In accordance with the Distribution Policy, the fund currently expects to make monthly distributionsto common shareholders at a distribution rate per share of 0.0320. Distributions may includeordinary and/or tax-exempt income, net capital gains, and/or a return of capital of your investmentin the fund. You should not draw any conclusions about the fund’s investment performance fromthe amount of this distribution or from the terms of the Distribution Policy. The Distribution Policyprovides that the Board of Trustees may amend or terminate the Distribution Policy at any timewithout prior notice to fund shareholders.
Message from the TrusteesJune 14, 2022Dear Fellow Shareholder:The year to date has been difficult for investors, with bond and stock prices fallingin repeated market downturns. Inflation has climbed to levels not seen in decades,prompting the U.S. Federal Reserve to reverse the stimulus that had helped supportfinancial assets since 2020. Markets globally also have reacted to the Russia-UkraineWar and the worsening Covid-19 pandemic in China. In the underlying economy, wehave seen encouraging signs, such as abundant job openings and wage gains in theUnited States.History has shown us that markets eventually recover from crises and may rewardthose focused on long-term goals rather than short-term uncertainties. At Putnam,professional, active investors are working for you. They are monitoring risks while lookingfor strong potential investments for your fund. Learn more in the interview with your fundmanager(s) in the following pages.Thank you for investing with Putnam.Respectfully yours,Robert L. ReynoldsPresident and Chief Executive OfficerPutnam InvestmentsKenneth R. LeiblerChair, Board of Trustees
About the fundPotential for income exempt fromfederal income taxPutnam Managed Municipal Income Trust has the flexibility to invest in municipal bondsissued by any U.S. state or territory. As a closed-end fund, it shares some commoncharacteristics with open-end mutual funds, but there are some key differences thatinvestors should understand as they consider their portfolio.MORE ASSETS AT WORKOpen-end funds are subject to ongoing sales and redemptions thatcan generate transaction costs for long-term shareholders. Closed-endfunds, however, are typically fixed pools of capital that do not need tohold cash in connection with sales and redemptions, allowing the fundsto keep more assets actively invested.TRADED LIKE STOCKSClosed-end fund shares are traded on stock exchanges. As a result,their prices fluctuate because of the influence of several factors.THEY HAVE A MARKET PRICELike an open-end fund, a closed-end fund has a per-share net assetvalue (NAV). However, closed-end funds also have a “market price” fortheir shares — which is how much you pay when you buy shares of thefund, and how much you receive when you sell them.2 Managed Municipal Income Trust
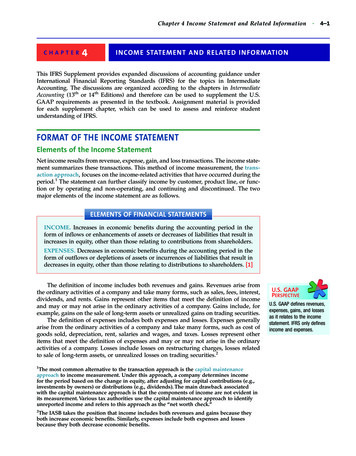
Looking at a closed-end fund’s performanceYou will usually see that the NAV and the market price differ. The market price canbe influenced by several factors that cause it to vary from the NAV, includingfund distributions, changes in supply and demand for the fund’s shares, changingmarket conditions, and investor perceptions of the fund or its investment manager.PUTNAM MANAGED MUNICIPAL INCOME TRUSTNet asset valueMarket price12Price per share10864 2/892/942/992/042/092/142/194/22A mix of credit qualitiesIn addition to its flexible geographical focus, Putnam Managed Municipal IncomeTrust combines bonds of differing credit quality. The fund invests in high-qualitybonds, but also includes an allocation to lower-rated bonds, which may offer higherincome in return for more risk.Managed Municipal Income Trust 3
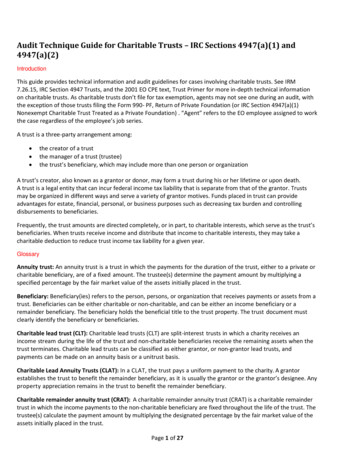
Performance history as of 4/30/22Annualized total return (%) comparisonThe fund — at NAVPutnam Managed Municipal IncomeTrust (NYSE ticker: PMM)5.90 5.31 5.27LIFE OF FUND(since 2/24/89)4.122.484.08Fund’s benchmarkBloomberg MunicipalBond Index2.58 1.80 2.1110 YEARS5 YEARSFund’s Lipper peer group averageHigh Yield Municipal Debt Funds(closed-end)0.48 0.46 0.063 YEARS1 YEAR6 39Data are historical. Past performance does not guarantee future results. More recent returns may be less or more thanthose shown. Investment return and net asset value will fluctuate, and you may have a gain or a loss when you sell yourshares. Performance assumes reinvestment of distributions and does not account for taxes. Fund returns in the bar chartare at NAV. See below and pages 10–11 for additional performance information, including fund returns at market price.Index and Lipper results should be compared with fund performance at NAV. Fund results reflect the use of leverage,while index results are unleveraged and Lipper results reflect varying use of, and methods for, leverage.Returns for periods of less than one year are not annualized.All Bloomberg indices are provided by Bloomberg Index Services Limited.Lipper peer group average is provided by Lipper, a Refinitiv company.Recent broad market index and fund performanceCash(ICE BofA U.S. 3-Month Treasury Bill Index)0.07%Fund’s benchmark(Bloomberg Municipal Bond Index)–7.90%U.S. bonds(Bloomberg U.S. Aggregate Bond Index)–9.47%U.S. stocks(S&P 500 Index)–9.65%Putnam Managed Municipal Income Trust(at net asset value)–12.78%This comparison shows your fund’s performance in the context of broad market indexes for the six monthsended 4/30/22. See above and pages 10–11 for additional fund performance information. Index descriptions canbe found on page 13.All Bloomberg indices are provided by Bloomberg Index Services Limited.4 Managed Municipal Income Trust
Interview with your fund’s portfolio managerPaul Drury discusses the investmentenvironment and fund performance for thesix months ended April 30, 2022, as well as hisoutlook for the fund.Paul, how did municipal bonds performduring the six‑month period endedApril 30, 2022?Paul M. Drury, CFAPortfolio ManagerPaul has a B.A. from Suffolk University. Hehas been in the investment industry sincehe joined Putnam in 1989.Garrett L. Hamilton, CFA, is also a PortfolioManager of the fund.Municipal bonds encountered headwinds due tofears that persistently high inflation might promptthe Federal Reserve to pare back pro-growthmonetary policies faster than expected. Inflationconcerns were stoked by supply chain disruptions, rising labor costs, and higher commodityprices. Geopolitical and economic uncertaintiessurrounding Russia’s invasion of Ukraine in lateFebruary also unnerved investors.The Fed faces the difficult task of tamping downinflation without slowing economic growth orcausing unemployment to rise. In January 2022,the Fed indicated it was on track to start a seriesof rate hikes in March 2022 and end its bondbuying stimulus program. The war in Ukraineand ensuing sanctions on Russia elevatedcommodity prices, complicating the Fed’sbalancing act. This shifted expectations higherfor the number and degree of interest-rate hikes.At their March 2022 meeting, Fed policymakersraised their benchmark rate by a quarterpercentage point and signaled their intent to takefurther measures to curb the highest inflation in40 years. At the May 2022 meeting [shortly afterthe close of the fund’s reporting period], FedManaged Municipal Income Trust 5
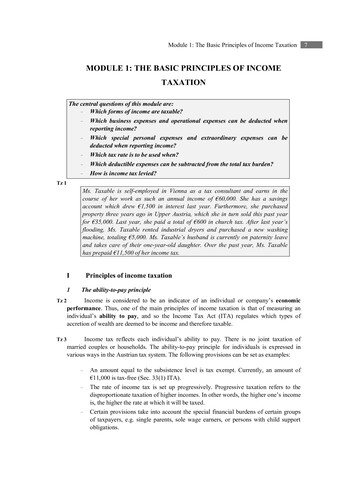
Credit quality overviewAAA2.4%AA12.1A21.0BBB22.5BB10.9B1.0Not rated26.6Cash and net other assets3.5Credit qualities are shown as a percentage of the fund’s net assets (common and preferred shares) as of 4/30/22.A bond rated BBB or higher (SP-3 or higher, for short-term debt) is considered investment grade. This chart reflects thehighest security rating provided by one or more of Standard & Poor’s, Moody’s, and Fitch. Ratings may vary over time.Cash and net other assets, if any, represent the market value weights of cash, derivatives, and short-term securities inthe portfolio. The fund itself has not been rated by an independent rating agency.Portfolio allocation — Top 10 states11.4%ILLINOIS5.3%NEW YORK3.2%WISCONSIN3.2%MICHIGAN5.4%NEW FLORIDATop 10 state allocations are shown as a percentage of the fund’s net assets (common and preferred shares) asof 4/30/22. Investments in Puerto Rico represented 1.5% of the fund’s net assets. Summary information maydiffer from the portfolio schedule included in the financial statements due to the differing treatment of interestaccruals, the floating-rate portion of tender option bonds, derivative securities, if any, and the use of differentclassifications of securities for presentation purposes. Holdings and allocations may vary over time.6 Managed Municipal Income Trust
officials raised their key rate by half a percentagepoint, the largest hike in 22 years. The Fed alsoannounced that it would begin reducing bondholdings on its balance sheet on June 1, 2022.These actions led to significant outflows frommunicipal bond funds, resulting in increasinglydifficult market technicals. For the six monthsended April 30, 2022, the Bloomberg MunicipalBond Index [the fund’s benchmark] returned–7.90%. Short-term municipal bonds outperformed intermediate- and long-term cohorts.From a credit perspective, investment-grademunicipal bonds held up better than higheryielding, lower-rated municipal bonds in therisk-off environment.How did the fund perform during thereporting period?For the six months ended April 30, 2022, thefund underperformed its benchmark, a nonleveraged index, due to our use of leveragingstrategies. The fund outperformed the medianfund ranked within its Lipper peer group, HighYield Municipal Debt Funds [closed-end].[Median is the midpoint in a series of values laidout in numerical order.]What strategies or holdings influenced thefund’s performance during the period?With the significant sell-off in fixed income inearly 2022, we believed municipal bonds hadbecome more attractive. We extended theportfolio’s duration, a measure of the fund’sinterest-rate sensitivity. At period-end, thefund’s duration was modestly long relative tothe level of its Lipper peer group. We believe thispositioning may help the fund outperform if theyear-to-date rise in interest rates reverses course.At period-end, the fund held an overweightexposure to bonds rated BBB and BB relative tothe benchmark. From a sector- or industrypositioning perspective, we favored landsecured, continuing-care retirement communities, and charter school bonds relative to thefund’s Lipper peer group.Regarding our strategy for state debt, the fundheld an overweight exposure to Illinois relativeAlthough supply/demandtechnicals remain challenged,we believe credit fundamentalsare strong and valuationsare attractive.Paul Druryto its Lipper peer group. We believe Illinois’sfinancial profile continues to stabilize, andits flexibility and credit fundamentals haveimproved since the onset of the Covid-19pandemic in the United States.The fund remained underweight in its exposureto uninsured Puerto Rico municipal debtrelative to its Lipper peer group during theperiod. However, we narrowed the fund’srelative underweight as we believe Puerto Rico’seconomy has stabilized under the supervisionof the Financial Oversight and ManagementBoard. In March 2022, Puerto Rico ended itsnearly five-year bankruptcy with a plan torestructure its debt, resume payments to bondholders, and restore its public pension system.We continue to monitor Puerto Rico debt forpotential investment opportunities.How did you use derivatives duringthe period?We utilized swaps to hedge or gain exposure tointerest-rate and term structure risk and to hedgeor gain exposure to inflation. Additionally, weused futures for hedging Treasury term structurerisk and yield curve positioning.What is your current assessment of thehealth of the municipal bond market?Municipal bonds have faced headwinds so far in2022 as positive seasonal factors waned, fundflows turned negative, and the market adjustedto a quicker pace of monetary policy normalization. However, municipal credit fundamentalsremain strong, in our view. Unprecedentedfiscal support, tax revenue outperformance,and strong economic growth expectations putmost state and local governments in their bestfinancial shape for more than a decade. StateManaged Municipal Income Trust 7
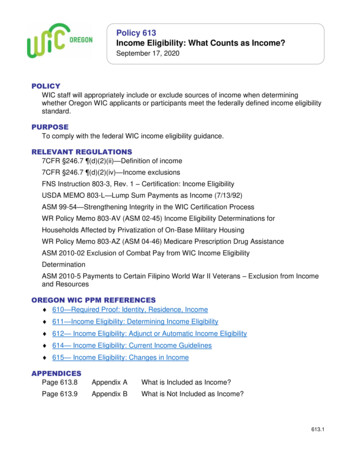
and local tax collections also were up 13.6% in2021 compared with 2020. Finally, municipaldefaults are running below long-term averagesyear to date through April 30, 2022, and remainisolated to the lowest-rated cohorts. As such, webelieve the credit outlook is currently the mostfavorable factor supporting the asset class.What is your outlook?Higher-than-expected inflation and stronglabor reports during the early months of 2022have seemingly cemented the Fed’s pivotto a hawkish stance. The market has quicklyrepriced to reflect a faster pace of monetarypolicy normalization. In our view, the Fed islikely to continue the path of policy normalization. We believe this process could contributeto heightened market volatility but also presentinvestors with attractive opportunities.We expect pandemic-related supply chainpressures will begin to ease and U.S. economicactivity will slow in the second half of 2022.We think the combination could contributeto slower growth and lower inflation, whichcould lead to a slower pace of monetary policynormalization than is currently priced in.Although supply/demand technicals remain challenged, we believe credit fundamentals are strongand valuations are attractive. Future returns lookmore promising for longer-term investors, inour opinion.Thank you, Paul, for your time andinsights today.The views expressed in this report are exclusivelythose of Putnam Management and are subject tochange. Disclosures provide only a summary ofcertain changes that have occurred in the past fiscalperiod, which may not reflect all of the changesthat have occurred since an investor purchased thefund. They are not meant as investment advice.Please note that the holdings discussed in thisreport may not have been held by the fund for theentire period. Portfolio composition is subject toreview in accordance with the fund’s investmentstrategy and may vary in the future. Currentand future portfolio holdings are subject to risk.Statements in the Q&A concerning the fund’sperformance or portfolio composition relative tothose of the fund’s Lipper peer group may referenceinformation produced by Lipper Inc. or through athird party.Comparison of top sector weightingsHealth careas of 10/31/21as of ate debt8.6%7.5%Transportation6.1%6.8%This chart shows how the fund’s top weightings have changed over the past six months. Allocations are shown asa percentage of the fund’s net assets (common and preferred shares). Current period summary information maydiffer from the information in the portfolio schedule notes included in the financial statements due to the inclusionof derivative securities, any interest accruals, the timing of matured security transactions, the use of differentclassifications of securities for presentation purposes, and rounding. Holdings and allocations may vary over time.8 Managed Municipal Income Trust
HOW CLOSED-END FUNDS DIFFER FROM OPEN-END FUNDSMore assets at work Open-end funds aresubject to ongoing sales and redemptions thatcan generate transaction costs for long-termshareholders. Closed-end funds, however,are typically fixed pools of capital that do notneed to hold cash in connection with sales andredemptions, allowing the funds to keep moreassets actively invested.Traded like stocks Closed-end fund sharesare traded on stock exchanges and, as a result,their prices fluctuate because of the influence ofseveral factors.They have a market price Like an open-endfund, a closed-end fund has a per-share netasset value (NAV). However, closed-end fundsalso have a “market price” for their shares —which is how much you pay when you buyshares of the fund, and how much you receivewhen you sell them.When looking at a closed-end fund’s performance, you will usually see that the NAV andthe market price differ. The market price canbe influenced by several factors that cause itto vary from the NAV, including fund distributions, changes in supply and demand for thefund’s shares, changing market conditions, andinvestor perceptions of the fund or its investment manager. A fund’s performance at marketprice typically differs from its results at NAV.Putnam Managed Municipal Income TrustNet asset valueMarket price 1612Price per shareClosed-end funds and open-end fundsshare many common characteristics butalso have some key differences that youshould understand as you consider yourportfolio strategies.8404/12 4/13 4/14 4/15 4/16 4/17 4/18 4/19 4/20 4/21 4/22Managed Municipal Income Trust 9
Your fund’s performanceThis section shows your fund’s performance, price, and distribution information for periodsended April 30, 2022, the end of the first half of its current fiscal year. In accordance with regulatoryrequirements for mutual funds, we also include performance as of the most recent calendarquarter-end. Performance should always be considered in light of a fund’s investment strategy.Data represent past performance. Past performance does not guarantee future results. More recentreturns may be less or more than those shown. Investment return, net asset value, and market pricewill fluctuate, and you may have a gain or a loss when you sell your shares.Annualized fund performance Total return and comparative index results for periods ended 4/30/22Life offund (since2/24/89)10 yearsNet asset value5.90%4.12%2.58%Market price5.533.732.28Bloomberg MunicipalBond Index5.312.48Lipper High Yield MunicipalDebt Funds (closed-end)category average*5.274.085 years3 years1 year6 rformance assumes reinvestment of distributions and does not account for taxes.Index and Lipper results should be compared with fund performance at net asset value. Fund results reflect the useof leverage, while index results are unleveraged and Lipper results reflect varying use of, and methods for, leverage.Returns for periods of less than one year are not annualized.Lipper peer group average is provided by Lipper, a Refinitiv company.All Bloomberg indices are provided by Bloomberg Index Services Limited.* Over the 6-month, 1-year, 3-year, 5-year, 10-year, and life-of-fund periods ended 4/30/22, there were 16, 13, 12, 11, 11,and 6 funds, respectively, in this Lipper category.Performance includes the deduction of management fees and administrative expenses.10 Managed Municipal Income Trust
Fund price and distribution information For the six-month period ended 4/30/22DistributionsNumber6Income 1 0.192Capital gains 2—Total 0.192Distributions — preferred sharesSeries A(240 shares)Series C(1,507 shares) 150.400 83.650NumberIncome 1Capital gains 2—— 150.400 83.650Share valueNAVMarket price10/31/21 8.19 8.25Total4/30/226.976.44Current dividend rate (end of period)NAVMarket priceCurrent dividend rate 35.51%Taxable equivalent 49.315.96%10.07The classification of distributions, if any, is an estimate. Final distribution information will appear on your year-endtax forms.1 For some investors, investment income may be subject to the federal alternative minimum tax. Income fromfederally exempt funds may be subject to state and local taxes.2 Capital gains, if any, are taxable for federal and, in most cases, state purposes.3 Most recent distribution, including any return of capital and excluding capital gains, annualized and divided by NAVor market price at end of period.4 Assumes maximum 40.80% federal tax rate for 2022. Results for investors subject to lower tax rates would not beas advantageous.Fund performance as of most recent calendar quarter Total return for periods ended 3/31/22Life of fund(since2/24/89)10 years5 years3 years1 yearNAV6.10%4.93%3.92%2.54%–5.42%Market price5.834.764.573.02–9.036 months–8.34%–13.11See the discussion following the fund performance table on page 10 for information about the calculation offund performance.Managed Municipal Income Trust 11
Consider these risks before investingLower-rated bonds may offer higher yields in return for more risk. Bond investments are subjectto interest-rate risk (the risk of bond prices falling if interest rates rise) and credit risk (the risk of anissuer defaulting on interest or principal payments). Interest-rate risk is generally greater for longerterm bonds, and credit risk is generally greater for below-investment-grade bonds. Unlike bonds,funds that invest in bonds have fees and expenses.The value of investments in the fund’s portfolio may fall or fail to rise over extended periods oftime for a variety of reasons, including general economic, political, or financial market conditions;investor sentiment and market perceptions; government actions; geopolitical events or changes;and factors related to a specific issuer, geography, industry, or sector. These and other factors maylead to increased volatility and reduced liquidity in the fund’s portfolio holdings. The fund’s sharestrade on a stock exchange at market prices, which may be lower than the fund’s net asset value.Our investment techniques, analyses, and judgments may not produce the outcome we intend. Theinvestments we select for the fund may not perform as well as other securities that we do not selectfor the fund. We, or the fund’s other service providers, may experience disruptions or operatingerrors that could have a negative effect on the fund. You can lose money by investing in the fund.12 Managed Municipal Income Trust
Terms and definitionsImportant termsTotal return shows how the value of the fund’sshares changed over time, assuming youheld the shares through the entire period andreinvested all distributions in the fund.Net asset value (NAV) is the value of all yourfund’s assets, minus any liabilities, divided bythe number of outstanding shares.Market price is the current trading priceof one share of the fund. Market prices areset by transactions between buyers andsellers on exchanges such as the New YorkStock Exchange.Fixed income termsCurrent rate is the annual rate of returnearned from dividends or interest of aninvestment. Current rate is expressed as apercentage of the price of a security, fundshare, or principal investment.Yield curve is a graph that plots the yields ofbonds with equal credit quality against theirdiffering maturity dates, ranging from shortestto longest. It is used as a benchmark for otherdebt, such as mortgage or bank lending rates.Comparative indexesBloomberg Municipal Bond Index is anunmanaged index of long-term, fixed-rate,investment-grade t ax-exempt bonds.Bloomberg U.S. Aggregate Bond Index is anunmanaged index of U.S. investment-gradefixed-income securities.ICE BofA (Intercontinental Exchange Bank ofAmerica) U.S. 3-Month Treasury Bill Index isan unmanaged index that seeks to measure theperformance of U.S. Treasury bills available inthe marketplace.S&P 500 Index is an unmanaged index ofcommon stock performance.Indexes assume reinvestment of all distributions and donot account for fees. Securities and performance of afund and an index will differ. You cannot invest directlyin an index.BLOOMBERG is a trademark and service mark ofBloomberg Finance L.P. and its affiliates (collectively“Bloomberg”). Bloomberg or Bloomberg’s licensorsown all proprietary rights in the Bloomberg Indices.Neither Bloomberg nor Bloomberg’s licensors approveor endorse this material, or guarantee the accuracy orcompleteness of any information herein, or make anywarranty, express or implied, as to the results to beobtained therefrom, and to the maximum extent allowedby law, neither shall have any liability or responsibility forinjury or damages arising in connection therewith.ICE BofA permits use of the ICE BofA indices and relateddata on an “as is” basis; makes no warranties regardingsame; does not guarantee the suitability, quality, accuracy, timeliness, and/or completeness of the ICE BofAindices or any data included in, related to, or derivedtherefrom; assumes no liability in connection with theuse of the foregoing; and does not sponsor, endorse, orrecommend Putnam Investments, or any of its productsor services.Lipper, a Refinitiv company, is a third-partyindustry-ranking entity that ranks mutualfunds. Its rankings do not reflect sales charges.Lipper rankings are based on total return at netasset value relative to other funds that havesimilar current investment styles or objectivesas determined by Lipper. Lipper may changea fund’s category assignment at its discretion.Lipper category averages reflect performancetrends for funds within a category.Managed Municipal Income Trust 13
Other information for shareholdersImportant notice regarding sharerepurchase programIn September 2021, the Trustees of your fundapproved the renewal of a share repurchaseprogram that had been in effect since 2005.This renewal allows your fund to repurchase, inthe 365 days beginning October 1, 2021, up to10% of the fund’s common shares outstandingas of September 30, 2021.Important notice regarding delivery ofshareholder documentsIn accordance with Securities and ExchangeCommission (SEC) regulations, Putnam sendsa single notice of internet availability, or asingle printed copy, of annual and semiannual shareholder reports, prospectuses, andproxy statements to Putnam shareholders whoshare the same address, unless a shareholderrequests otherwise. If you prefer to receiveyour own copy of these documents, please callPutnam at 1-800-225-1581, and Putnam willbegin sending individual copies within 30 days.Proxy votingPutnam is committed to managing our mutualfunds in the best interests of our shareholders.The Putnam funds’ proxy voting guidelinesand procedures, as well as informationregarding how your fund voted proxies relatingto portfolio securities during the 12-monthperiod ended June 30, 2021, are available inthe Individual Investors section of putnam.comand on the SEC’s website, www.sec.gov. If14 Managed Municipal Income Trustyou have questions about finding forms onthe SEC’s website, you may call the SEC at1-800-SEC-0330. You may also obtain thePutnam funds’ proxy voting guidelines andprocedures at no charge by calling Putnam’sShareholder Services at 1-800-225-1581.Fund portfolio holdingsThe fund will file a complete schedule of itsportfolio holdings with the SEC for the firstand third quarters of each fiscal year on FormN-PORT within 60 days of the end of suchfiscal quarter. Shareholders may obtain thefund’s Form N-PORT on the SEC’s websiteat www.sec.gov.Prior to its use of Form N-PORT, the fund filedits complete schedule of its portfolio holdingswith the SEC on Form N-Q, which is availableonline at www.sec.gov.Trustee and employee fund ownershipPutnam employees and members of theBoard of Trustees place their faith, confidence,and, most importantly, investment dollars inPutnam mutual funds. As of April 30, 2022,Putnam employees had approximately 492,000,000 and the Trustees had approximately 72,000,000 invested in Putnam mutualfunds. These amounts include investments bythe Trustees’ and employees’ immediate familymembers as well as investments throughretirement and deferred compensation plans.
Summary of Putnam closed-end funds’ amended and restateddividend reinvestment plansPutnam Managed Municipal Income Trust,Putnam Master Intermediate Income Trust,Putnam Municipal Opportunities Trust andPutnam Premier Income Trust (each, a “Fund”and collectively, the “Funds”) each offer adividend reinvestment plan (each, a “Plan”and collectively, the “Plans”). If you participatein a Plan, all income dividends and capital gaindistributions are automatically reinvestedin Fund shares by the Fund’s agent, PutnamInvestor Services, Inc. (the “Agent”). If you arenot participating in a Plan, every month youwill receive all dividends and other distributions in cash, paid by check and mailed directlyto you.Upon a purchase (or, where applicable, uponregistration of transfer on the shareholder recordsof a Fund) of shares of a Fund by a registeredshareholder, each such shareholder will bedeemed to have elected to participate in thatFund’s Plan. Each such shareholder will have alldistributions by a Fund automatically reinvestedin additional shares, unless such shareholderelects to terminate participation in a Plan byinstructing the Agent to pay future distributionsin cash. Shareholders who were not participantsin a Plan as of January 31, 2010, will continue toreceive distributions in cash but may enroll in aPlan at any time by contacting the Agent.If you participate in a Fund’s Plan, the Agentwill automatically reinvest subsequentdistributions, and the Agent will send you aconfirmation in the mail telling you how manyadditional shares were issued to your account.To change your enrollment status or to requestadditional information about the Plans, youmay contact the Agent either in writing, atP.O. Box 8383, Boston, MA 02266-8383, or bytelephone at 1-800-225-1581 during normalEast Coast business hours.H
Putnam Managed Municipal Income Trust Semiannual report 4 30 22 Message from the Trustees 1 About the fund 2 Interview with your fund's portfolio manager 5 Your fund's performance 10 Consider these risks before investing 12 Terms and definitions 13 Other information for shareholders 14 Summary of dividend reinvestment plans 15 Financial .