Transcription
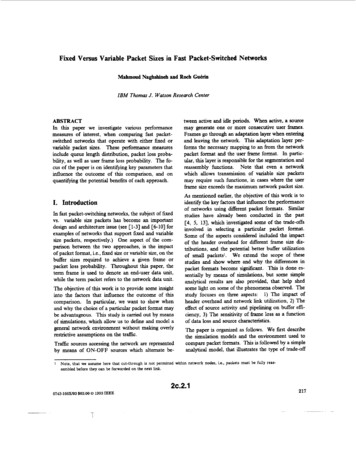
GREENBRIAR MALL2841 Greenbriar Pkwy SWAtlanta, GA 303313445 Peachtree Road, Suite 465Atlanta, GA 30326
Leasing ContactsFor Leasing Information:Permanent Leasing Contact:Richard orary and Cart Leasing Contact:Hazel Payne404-629-3925hpayne@shopgreenbriar.com
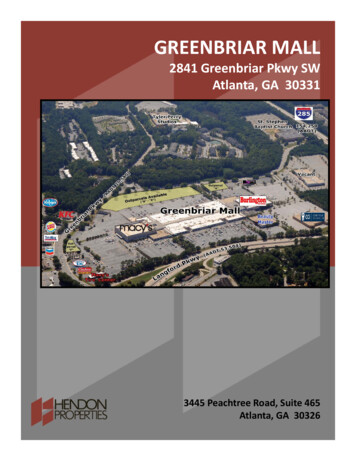
Site SummaryLOCATION:2841 Greenbriar Pkwy SWAtlanta, GA 30331SIZE:807,697 SFANCHOR TENANTS:Burlington Coat FactoryMacy’sCorinthian CollegeSuper BeautyDEMOGRAPHICS:Radius:3 Miles5 Miles7 MilesTotal Households3,33427,53962,546 50,616 49,707 46,367Residential Population7,53266,353155,276Employee Population2,49119,83163,7245 Minutes10 Minutes15 Minutes12,44864,166185,454 43,732 45,231 e HH IncomeDrivetime:Total HouseholdsAverage HH IncomeResidential PopulationEmployee PopulationTRAFFIC COUNTS:Langford Parkway53,504Greenbriar Parkway SW20,580
GreenbriarMall
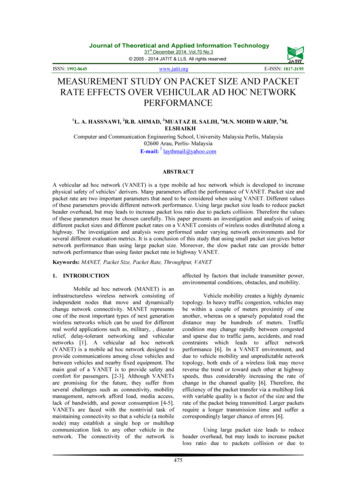
GreenbriarMall3 Miles5 Miles7 Miles
Executive SummaryGreenbriar MallRings: 3, 5, 7 mile radiiPrepared by Shannon MullinaxLatitude: 33.688228Longitude: -84.4935983 miles5 miles7 milesPopulation2000 Population2010 Population2013 Population2018 Population2000-2010 Annual Rate2010-2013 Annual Rate2013-2018 Annual Rate2013 Male Population2013 Female Population2013 Median .59%1.50%46.3%53.7%34.0In the identified area, the current year population is 279,334. In 2010, the Census count in the area was 274,015. The rate of change since2010 was 0.59% annually. The five-year projection for the population in the area is 300,909 representing a change of 1.50% annually from2013 to 2018. Currently, the population is 46.3% male and 53.7% female.Median AgeThe median age in this area is 34.0, compared to U.S. median age of 37.3.Race and Ethnicity2013 White Alone7.1%7.0%6.5%87.4%87.8%87.9%2013 American Indian/Alaska Native Alone0.3%0.3%0.3%2013 Asian Alone0.6%0.5%0.7%2013 Pacific Islander Alone0.0%0.0%0.0%2013 Other Race2.8%2.6%2.8%2013 Two or More Races1.8%1.8%1.8%2013 Hispanic Origin (Any Race)5.6%5.2%5.5%2013 Black AlonePersons of Hispanic origin represent 5.5% of the population in the identified area compared to 17.4% of the U.S. population. Persons ofHispanic Origin may be of any race. The Diversity Index, which measures the probability that two people from the same area will be fromdifferent race/ethnic groups, is 30.4 in the identified area, compared to 62.1 for the U.S. as a whole.Households2000 Households25,53657,281104,1072010 Households27,28359,294105,9762013 Total Households27,75560,507108,3782018 Total Households30,08565,685117,8012000-2010 Annual Rate0.66%0.35%0.18%2010-2013 Annual Rate0.53%0.63%0.69%2013-2018 Annual Rate1.63%1.66%1.68%2.392.462.502013 Average Household SizeThe household count in this area has changed from 105,976 in 2010 to 108,378 in the current year, a change of 0.69% annually. The fiveyear projection of households is 117,801, a change of 1.68% annually from the current year total. Average household size is currently 2.50,compared to 2.51 in the year 2010. The number of families in the current year is 63,094 in the specified area.Data Note: Income is expressed in current dollarsSource: U.S. Census Bureau, Census 2010 Summary File 1. Esri forecasts for 2013 and 2018. Esri converted Census 2000 data into 2010 geography.October 23, 2013 2013 EsriPage 1 of 2
Executive SummaryGreenbriar MallRings: 3, 5, 7 mile radiiPrepared by Shannon MullinaxLatitude: 33.688228Longitude: -84.4935983 miles5 miles7 milesMedian Household Income2013 Median Household Income2018 Median Household Income2013-2018 Annual RateAverage Household Income 36,430 40,8212.30% 34,915 38,9932.23% 32,008 35,8002.26%2013 Average Household Income2018 Average Household Income2013-2018 Annual RatePer Capita Income 50,616 58,8193.05% 49,707 58,0203.14% 46,367 53,8533.04% 21,062 24,6453.19% 20,136 23,6573.28% 18,286 21,3533.15%2013 Per Capita Income2018 Per Capita Income2013-2018 Annual RateHouseholds by IncomeCurrent median household income is 32,008 in the area, compared to 51,314 for all U.S. households. Median household income isprojected to be 35,800 in five years, compared to 59,580 for all U.S. householdsCurrent average household income is 46,367 in this area, compared to 71,842 for all U.S households. Average household income isprojected to be 53,853 in five years, compared to 83,667 for all U.S. householdsCurrent per capita income is 18,286 in the area, compared to the U.S. per capita income of 27,567. The per capita income is projected tobe 21,353 in five years, compared to 32,073 for all U.S. householdsHousing2000 Total Housing Units2000 Owner Occupied Housing Units2000 Owner Occupied Housing Units2000 Vacant Housing Units2010 Total Housing Units2010 Owner Occupied Housing Units2010 Renter Occupied Housing Units2010 Vacant Housing Units2013 Total Housing Units2013 Owner Occupied Housing Units2013 Renter Occupied Housing Units2013 Vacant Housing Units2018 Total Housing Units2018 Owner Occupied Housing Units2018 Renter Occupied Housing Units2018 Vacant Housing , 34.0% of the 134,972 housing units in the area are owner occupied; 46.3%, renter occupied; and 19.7% are vacant. Currently,in the U.S., 56.4% of the housing units in the area are owner occupied; 32.3% are renter occupied; and 11.3% are vacant. In 2010, therewere 132,355 housing units in the area - 36.6% owner occupied, 43.5% renter occupied, and 19.9% vacant. The annual rate of change inhousing units since 2010 is 0.87%. Median home value in the area is 119,775, compared to a median home value of 177,257 for the U.S.In five years, median value is projected to change by 5.63% annually to 157,525.Data Note: Income is expressed in current dollarsSource: U.S. Census Bureau, Census 2010 Summary File 1. Esri forecasts for 2013 and 2018. Esri converted Census 2000 data into 2010 geography.October 23, 2013 2013 EsriPage 2 of 2
Corinthian College Super Beauty Drivetime: 5 Minutes 10 Minutes 15 Minutes Total Households 12,448 64,166 185,454 Average HH Income 43,732 45,231 54,053 . Greenbriar Mall Prepared by Shannon Mullinax Rings: 3, 5, 7 mile radii Latitude: 33.688228 Longitude: -84.493598 3 miles 5 miles 7 miles


![FIPS 140-2 Non-Proprietary Security Policy Acme Packet 1100 [1] and .](/img/49/140sp3490-5601486.jpg)