Transcription
Fixed Versus Variable Packet Sizes in Fast Packet-Switched NetworksMahmoud Naghshineh and Roch GueinIBM Thomas J . Watson Research CenterABSTRACTIn this paper we investigate various performancemeasures of interest, when comparing fast packetswitched networks that operate with either fixed orvariable packet sizes. These performance measuresinclude queue length distribution, packet loss probability, as well as user frame loss probability. The focus of the paper is on identifying key parameters thatinfluence the outcome of this comparison, and onquantdjing the potential benefits of each approach.I. IntroductionIn fast packet-switchingnetworks, the subject of fixedvs. variable size packets has become an importantdesign and architecture issue (see [l-31 and [6-101 forexamples of networks that support fixed and variablesize packets, respectively.) One aspect of the comparison between the two approaches, is the impactof packet format, i.e., fixed size or variable size, on thebuffer sizes required to achieve a given frame orpacket loss probability. Throughout this paper, theterm frame is used to denote an end-user data unit,while the term packet refers to the network data unit.The objective of this work is to provide some insightinto the factors that influence the outcome of thiscomparison. In particular, we want to show whenand why the choice of a particular packet format maybe advantageous. This study is carried out by meansof simulations, which allow us to define and model ageneral network environment without making overlyrestrictive assumptions on the trafEc.TrafEc sources accessing the network are representedby means of ON-OFF sources which alternate be1tween active and idle periods. When active, a sourcemay generate one or more consecutive user frames.Frames go through an adaptation layer when enteringand leaving the network. This adaptation layer performs the necessary mapping to an from the networkpacket format and the user frame format. In particular, this layer is responsible for the segmentation andreassembly functions. Note that even a networkwhich allows transmission of variable size packetsmay require such functions, in cases where the userframe size exceeds the maximum network packet size.As mentioned earlier, the objective of this work is toidentify the key factors that influence the performanceof networks using different packet formats. Similarstudies have already been conducted in the past[4, 5, 131, which investigated some of the trade-offsinvolved in selecting a particular packet format.Some of the aspects considered included the impactof the header overhead for different frame size distributions, and the potential better buffer utilizationof small packets'. We extend the scope of thesestudies and show where and why the differences inpacket formats become significant. This is done essentially by means of simulations, but some simpleanalytical results are also provided, that help shedsome light on some of the phenomena observed. Thestudy focuses on three aspects: 1) The impact ofheader overhead and network link utilization, 2) Theeffect of source activity and pipelining on buffer e a ciency, 3) The sensitivity of frame loss as a functionof data loss and source characteristics.The paper is organized as follows. We first describethe simulation models and the environment used tocompare packet formats. This is followed by a simpleanalytical model, that illustrates the type of trade-offNote, that we assume here that cut-through is not permitted withm network nodes, i.e., packets must be fully reassembled before they can be forwarded on the next link.2c.2.10743-166)3/93 03.000 1993 IEEE217
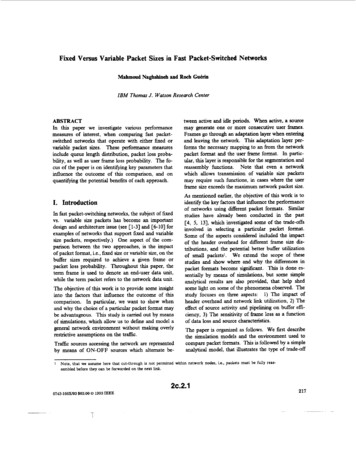
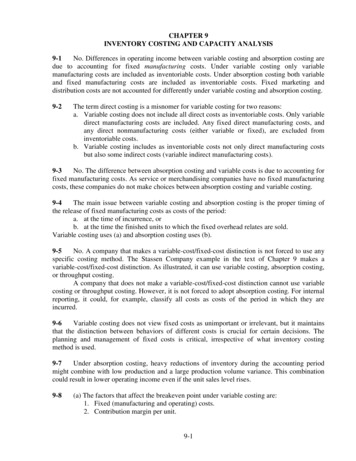
that can be expected when comparing fixed versusvariable size packet formats. The next three sectionsare devoted to the study of the three aspects mentioned earlier, and it is shown when and why differentpacket formats can yield better performances.Finally, a brief conclusion summarizes the findingsof this paper.ON period are generated A sec. apart2,where P 48 bytes and &wk is the source peak rate.In the reassembly phase, the AL must ensure that allpackets generated from a user frame have been properly received. In this study, we assume that a userframe is “lost” if one or more of its segments, i.e.,network packets, is in error or missing. In otherwords, we assume that error recovery is performedabove the network layer.11. Simulation ModelsIn the case of an ATM-type network with fixed sizepackets or cells, we assumed a 48-byte data payloadand a 5-byte header. Note, that this ignores the additional overhead introduced by the ATM adaptationlayer itself, which ranges from 0 to 4 additional bytes[l-31. A 10-byte header with a 2-Kbyte maximumpacket size were chosen for networks that allow variable length packets (denoted by VLP model in therest of this paper.) Note that although the raw datagenerated by sources and passed to the AL is the samefor both ATM and VLP models, the differences inheader overhead result in different outputs into thenetwork.In this section we describe the simulation models, thatwere built to compare the impact of fixed and variablesize packet formats on the buffer requirements in thenetwork. An overview of these simulation models isprovided in Figure 1 and Figure 2.II.A Network ModelThe purpose of this fist model is to observe a singleintermediate network link, which merges traffic generated from different sources after it has traveledthrough different paths in the network. The modelhas four major components. From left to right inFigure 1, we distinguish between traffic sources, adaptation layer, intermediate network nodes, and thetagged network link. As mentioned earlier, the trafficsources generate data according to an ON-OFFprocess, which is characterized by its peak data generation rate RPmk,and the distribution of its ON andOFF periods. For illustration purposes, these distributions were taken to be exponential, with meanduration Tonand to , respectively. Because of theflexibility of a simulation-based approach, otherchoices are clearly possible.The second component of the simulation model is theadaptation layer (AL) that separates the traffic sourcesfrom the network. This layer is responsible for theconversion from the user frame format into the network packet format, and conversely. In particular,the AL performs segmentation and reassembly of userframes, as well as bit padding whenever necessary, i.e.,in the last cell of a user frame in the case of a fixedsize packet format. The time A, out of the segmentation unit between two consecutive packets from thesame ON period, is proportional to the ratio of thepacket size to the source peak rate. For example, inthe case of an ATM network, packets from the same2The third component of the model is an “intermediate” network node, which attempts to account for therandom delay that packets encounter when goingthrough several stages of a network. A possible approach to capture this effect, would have been to actually simulate a large network and the correspondingtraffic so as to effectively recreate the interactions thattake place within a network. Such an approach isunfortunately computationally too costly. Instead,we use a single “waif node” to represent the effect ofnetwork interactions on a packet. The wait node addsa random delay to packets entering the network.Specifically, the wait node is modelled as an M/M/1(or M/D/l for fixed size packets) queue with fixedload p, e.g., p 85%. The node receives two trafficstreams: the traffic generated by the source itself, anda background traffic of intensity p ’ , where p‘ is chosenso that the aggregate trafEc has intensity p . The delayseen by a source packet arriving at the .wait node depends on the position of the packet within the corresponding ON period of the source. The fvst packetgenerated during an ON period is assumed to see arandom system upon its arrival and it, therefore, seesan unfinished work at the wait node equal to the average unfinished work in an M/M/l (M/D/l) queue.With possibly the exception of the last packet2c.2.2218
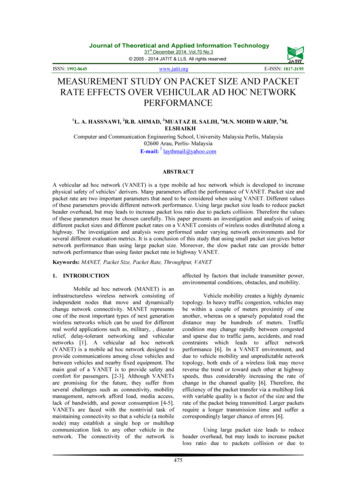
This yields [ll] a delay (including the service time)forthisfirstpacketoftheformWl P/P(l - P ) Pl/S (W1 P/2P(l - P ) Pl/S),where 1/p is the average service time of a packet (l/p PIS, with P the average network packet sizeand S the speed of a network link) and Pl is the sizeof the first packet in the ON period.Subsequent packets generated during the same ONperiod are then taken to see a delay, which reflects thedependency on the system seen by the first packet andthe impact of additional background traffic that mayhave joined the queue since then. In other words,assuming that the first packet arrived at the wait nodeat t 0, the i-th packet generated during anON-period will leave the wait node at timet, W, X j f 2 y ,where Wj is the expected amountof work that anived at the wait node (including thenew packet itself) between the arrivals of thej-th and(j- 1)-th packets. The quantities W, are easily foundto be given by W, p'A, PIS, where p' and A, areas previously defined. This wait node model providesus with a simple means to randomize the networkdelay seen by packets, white keeping some of thecorrelation that exists between the network states seenby consecutive packets from the same source3. The last component of the simulation model is thetagged network node (and link), where the traffic fromall the sources is merged. The inputs to this taggednode are the outputs of all the wait nodes, and thequantity being monitored is the queue length orbuffer content distribution. This distribution is usedto compare the buffer requirements of the ATM andVLP formats.II.B Frame Loss ModelThe second simulation model shown in Figure 2, wasdeveloped to study user frame loss probability, and inparticular its sensitivity to the network packet formatand the ratio between source and link speeds. Recallthat a user frame is assumed lost if any of the corresponding network packets is lost. The model consistsof three components: a traffic source characterizedby its peak rate and the distributions of the ON andOFF period.#, an adaptation layer identical to whathas been previously described, and a network linkcarrying both the source traffic and some backgroundtraffic. The background traffic was assumed to be either Poisson or generated by ON-OFF sources. Userframes are produced by the tagged source (and thebackground t r a c ) and are assumed to consist of allthe packets generated during an ON period. Individual packets coming fiom the tagged and backgroundsources are aggregated and offered to the networklink. Reassembly of user frames from the taggedsource is carried out at the output of the network link.As mentioned above, the quantity of interest is thefiame loss probability corresponding to the data lossprobability induced by the finite size of the linkbuffer. Here, we define data loss probability as theratio of the number of dropped or lost bytes to thenumber of bytes transmitted on the tagged links. Weare interested in the impact of network packet foxmatand speed of the network link on the user fiame loss.In particular, we want to capture the impact of thelink speed on the correlation between queue sizes seenby packets from the same fiame. This investigationis carried out by varying the speed of the networklink, while keeping the characteristics of the taggedsource constant, and adjusting the intensity of thebackground traffic to keep the data loss constant.This is done for both the ATM and VLP packet formats and additional details on this investigation areprovided in section V.111. Impact of Packet OverheadIn this section, we investigate the sigdicance of theper packet overhead under Werent scenarios. Thisoverhead corresponds to the header and possiblepadding bits (for fixed size packets), that must beadded to each packet carried by the network. Its impact is clearly a fimction of the frame size distributionand the packet format. For example, a 1 kbyte packetonly carries a 10-byte overhead in a VLP networkwith a maximum packet size greater than 1 kbyte,while the overhead is 113 bytes in an ATM networkIn particular for high-speed sources, where AiN 0.Exponential distributions have again been selected in the examples, but other choices are possible.Note, that in the case of fixed size packets ths is also thepacket loss probability.2c.2.3219
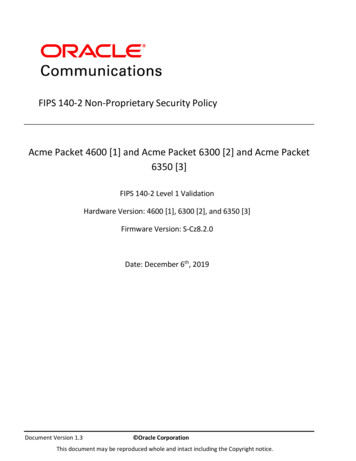
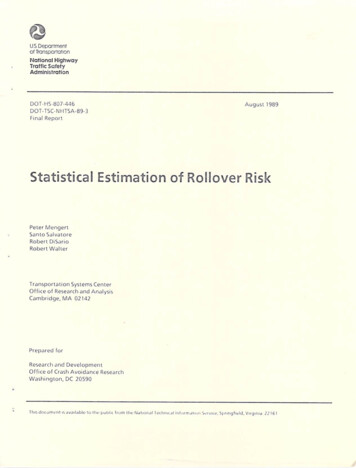
(21 packets each with a 5-byte header, and 8 bytes ofpadding in the last packet.) Figure 3 illustrates thedifference in overhead for VLP and ATM networksas a function of the average message length or Eramesize. Exponentially distributed frame sizes were assumed and it should be noted that under this assumption, the overhead due to padding bits results inthe ATM format being always less efficient (on average) than the VLP format. This may not hold withother kame sue distributions, for example small constant (e.g., 48 bytes!) W e sizes, where the smallerper packet header of ATM network can yield betterefficiency. (See [SI for similar results with otherframe size distributions.)The difference in per packet overhead between ATMand VLP networks results in different link utilizationsfor the same amount of carried user data. Typically,imposing fixed size packets results in higher linkutilization. This may in tum influence the buffercontent distribution, and therefore the packet losswithin the network. The impact of this effect is,however, strongly dependent on the load at whichnetwork links are being operated. In particular, thehigher utilization imposed by fixed size packets istypically not sigrufcant and packet loss is dominatedby other factors when the link utilization is relativelylow.A simple “illustration” of this behavior can be obtained by plotting the average buffer content in bothan M/M/ 1 and an M/D/ 1 system as a function of theoriginal data load [ 121. Despite a higher link utilization, the M/D/l system outperforms the M/M/l system except at high loads. Intuitively, this is due to themore regular service in the M/D/1 system, which results in better buffer utilization. Spedically, an idleserver in the M/D/ 1 system starts serving an incomingpacket earlier because of its fured small size. At higherloads, incoming packets hardly ever find an idleserver, and the the difference in link utilization becomes sigdicant and the performance advantage ofthe M/D/ 1 system disappears.This phenomenon is further illustrated for a more realistic system in Figure 4, which plots for differentlink utilizations the buffer content distribution at anintermediate node in ATM and VLP networks. The67results are obtained by means of simulations, usingthe network model described in section 1I.A. Thetraffic on the tagged network link is generated fiom10 identical ON-OFF sources, each with a peak rateof 16 Mbps, an average ON period of 0.5 msec (1kbytes average fiame size), and a utilization of 10%.Both ON and OFF periods are assumed to be exponentially distributed. The distribution of the buffercontent is obtained for different link speeds, andtherefore utilizations. Because of the impact of otherfactors such as the correlation between successive arrivals fiom the same source, the outcome is not aspronounced as in the simplified comparison ofM/M/l and M/D/l systems. However, it can againbe seen that at low link utilizations, the additionaloverhead imposed by the fixed packet size of ATMis more than compensated for by the better buffer efficiency. This is again reversed when link utilizationincreases beyond a value6, above which the price ofthe higher overhead of ATM becomes the dominantfactor. These observations are in line with resultsfrom previous studies [4].The impact of packet overhead and more specificallythe padding bits (for fixed size packets) also dependson the burst length or message size. As can be seenin Figure 3, the effective’ message length of ATMcells increases sharply as the mean message size decreases (i.e., assuming an exponential frame size disThis means that the buffer lengthtribution.)distribution is also heavily influenced by the meanframe size. As a result, the outcome of the comparison between the buffer length distributions of ATMand VLP systems can change in favor of VLP as theaverage kame size decreases. This is because for verysmall average message sizes the effective message size,as a result of padding bits of ATM, brings the linkutilization above the threshold where the VLP startsto perform better. This effect is illustrated inFigure 5, which shows simulation results for a set of10 ON-OFF sources with utilization of 50% and apeak rate of 16 Mbps. The raw link utilization isabout 50-55%. We observe, that for small messagesizes (mean message size of 20 Bytes,) the effectivelink utilization of the ATM system becomes so highthat the link becomes almost saturated. This is a byproduct of padding bits. This deficiency of the ATMOf the order of 60-65% for this example.By this we mean the original data length plus the added overhead.2c.2.4220
system vanishes as the mean message size increases,up to a point where pipelining efficiency becomes thedominant factor so that ATM systems outperformsVLP ones.outperforms VLP, clearly depends on other parameters such as link utilization, etc.V. Frame and Data Loss ProbabilitiesIV. Impact of Source UtilizationIn this section, we study the impact of another parameter that intluences the outcome of the comparison between ATM and VLP formats. Specifically,we investigate the effect of varying source utilizationwhile keeping network link utilizations constant.Here, source utilization p denotes the fraction of timethe source is active generating data at its peak rate(i.e., p T,/(T, Tof).) Obviously, for a given linkutilization, higher source utilizations result in a linkspeed closer to the aggregate peak rate of the sourceswhose traffic is routed on that link. This should inturn favor networks operating with small packet sizessince on such links packets will essentially be servedas they arrive, without being able to accumulate in thelink buffer. Intuitively, smaller packets result in amore progressive arrival of data. This makes the system resemble more closely a fluid-flow model, whichhas minimal queueing when the service rate and theaggregate input rate are close. Conversely,low sourceutilizations allow for link rates much smaller than theaggregate peak rate of all sources with traffic routedon the link. The advantage of the better buffer efficiency of the ATM format should then be much lesssignificant. In order to observe these behaviors we simulated asystem similar to the one used in the previous section.As before, it consists of 10 identical ON-OFF sourcessharing a common network link, each with a 16 Mbpspeak rate and a 0.5 msec average ON period (1 kbytesaverage frame size). The raw link utilization was keptconstant at about 80%, while source utilization wasvaried from 10 to 70%. The buffer content distribution was again obtained for different cases by meansof simulations, and the results are shown inFigure 6. As expected, the potential for better bufferutilization of the ATM format is realized at highsource utilizations. Conversely, the VLP formatshows better results when the source utilization is lowand the effect of the smaller overhead becomes thedominant factor. Note, however, that the crossoverpoint, i.e., the source utilization above which ATMIn this section, we investigate the relation between theframe loss probability experienced by a source, andthe data loss probability provided by the network.The first quantity is the one of real interest to endusers, while the second is typically the only one thenetwork can control and monitor. We are interestedin comparing the frame loss seen by an end-usersending its data over either an ATM or a VLP network, each ensuring the same data loss. In otherwords, given that two different networks -one withfixed and another with variable length packets- provide comparable packet or data loss, how do theycompare in terms of frame loss, i.e., do the differentpacket formats have any effect.For the purpose of this comparison, we use the simulation model described in section II.B, where wevary the ratio of the source to link speeds. As mentioned earlier, this ratio is expected to have a si@icant impact on the performance, i.e., frame lossprobability, seen when using different packet formats.Intuitively, segmentation is expected to have limitedimpact when the ratio of source to link speed is large.In such cases, the high speed of the source ensuresthat all segments (packets) of frame arrive nearlyback-to-back in the network, emulating, therefore, theappearance of a single packet carrying the full frame.The impact of the adaptation layer is then, except forthe different overheads, similar for both packet formats. In the case of low speed sources, the spacingbetween packets of the same frame introduced by thesegmentation layer of the ATM format, produces apacket stream significantly different from that of theVLP format. This is likely to result in different frameloss probabilities.In particular, when the source speed is much lowerthan the network link speed, packets from the sameframe will essentially see uncorrelated network queues(the time between two packets is large compared tothe time constant of the network queue). Assuminga packet loss probability of p (in the case of ATMnetworks this is equal to the data loss probability), theloss probability of a Game consisting of n packets isapproximately equal to np. As n is much larger in2c.2.522 1
ATM than in VLP networks, it is clear that for thesame data loss probability p, low speed sources willsee a worse Game loss probability when going over anetwork that enforces a small fixed size packet format.This is the “avalanche” effect mentioned in [SI.More problematic than the sheer degradation of frameloss probability which also depends on a number ofadditional factors (see below), is the fact that this behavior makes it very difficult to translate networkperformance into user performance in ATM typenetworks. In other words, for a given network performance (data loss probability), end-users can seedrastically different quality of service (kame lossprobability) depending on their own peak rate.This aspect is illustrated in Figure 7, which reportsthe results of a set of simulations based on the modeldescribed in section 1I.B. The tagged source.has apeak rate of 16 Mbps, an average ON period of 0.5msec, and a utilization of 10%. The link speed wasvaried from a fraction (around 20%) to several times(6 to 7) the source peak rate, while its utilization waskept constant at about 80% by changing the intensityof the Poisson background traffic. The data loss atthe link buffer was kept approximately constant (beand 7 x 10⁻³ for both network types,tween 5 xby appropriately adjusting the size of the link buffer.As expected, the Game loss probability seen by anend-user shows a sharp increase when its source peakrate decreases in ATM type networks, while it is quiteinsensitive to this parameter in VLP type networks.This implies, that the difficulty in ATM type networkto translate network performance into user performance, is not present in VLP type networks. .This difference is mainly due to the fact that the latter onesallow users to transparently send their data throughthe network*,with mini” constraint on the packetformat to be used. This feature is likely to si&icantly simplify the Grade-Of-Service (GOS) negotiations between users and the network.The previous scenario compared frame loss probabilities for ATM and VLP networks carrying the sametraffic and ensuring the same data loss probability.This was achieved by properly adjusting the buffersues needed in each case to achieve the desired dataloss. This comparison, however, did not capture thefact that for the same user traffic and buffer sizes,8ATM and VLP networks typically yield different dataloss probabilities. This was illustrated in the previoussections, where it was shown that ATM and VLPnetworks have Werent buffer content distributions,that vary as a function of source characteristics andlink utilizations. In particular, ATM type networkshave the potential for lower data loss probabilitieswhen link utilizations are not too high. In such cases,it is possible that the lower data loss probability offsets the penalty imposed on the frame loss probabilityby the fixed size packet format.This was investigated in [121 through a simple analytical model. A more realistic investigation wouldcombine the influence of finite link speeds as illustrated in Figure 7, and the impact of the difference indata losses due to packet format. In other words, thequestions we should ask are: How do the Gamelosses of ATM and VLP compare for networks withequal buffer sizes, finite speed links, and various linkutilizations? When does the fact that ATM networkpackets see decorrelated buffer lengths for very highlink speeds dominates ATM’s potential advantage oflower data loss, and result in a higher frame loss?This investigation is again carried out using the simulation model of section II.B, where both networksnow have the same finite buffer space. Traffic isgenerated from 10 ON-OFF sources all with a utilization of 10% and an ON-time of 0.5 msec. One ofthe sources is tagged and assigned a peak rate of 16Mbps, while the link speed is varied. The link utilization is kept constant at about 30% by changing thepeak rate of the 9 other sources accordingly. For eachset of simulations the buffer size of the ATM simulation was adjusted to give a data loss of aboutat the link. This buffer size was then kept5xfor the VLP system. The kame loss of both systemswas obtained and the results are shown in Figure 8.From the figure, one can conclude that as the ratioof the link speed to the source peak rate increases, theframe loss of ATM increases so that at some point itcrosses the frame loss line of the VLP and becomesworse even though the data loss of VLP always remains higher. Therefore, despite its lower packet lossATM’s user Game loss can often be worse than inVLP networks in particular for low speed users.for additional discussions on the benefits of networktransparency.See [lo]2c.2.6222
J.-Y.Le Boudec, "About Maximum TransferVI. ConclusionRates for Fast Packet Switching Networks,"In this paper, we have studied the influence of anumber of parameters on the performance of networks operating with either ATM or VLP packetformats. It was shown that the outcome heavily depends on the assumed operating conditions andsource characteristics. In particular, by appropriatelyadjusting parameters such as link utilization, kamesize distribution, buffer sizes, source utilization, etc.,it is possible to claim that either approach outperforms the other. A conclusion of this work is, therefore, that network performance cannot be used asdecisive factor when comparing networks using different packet formats. Rather, the emphasis shouldbe on other aspects such as network complexity andflexibility in supporting various user requirements.From this perspective, VLP type networks may havesome advantage because of the more direct relationbetween network data loss and user message loss.This can help simpllfy the mapping from networkinto user performance.I B M Research Report, no. RZ 2111, April 1991.I. Cidon, J. Derb , I. Gopal, and B. Kadaba, "ACritique of A T d f r o m a Data CommunicationsPerspective," Proc. ICCC90, November 1990.I. Cidon and 1. Go al. "PARIS: An Approachto Integrated High- eed Private Networks," Int.J. Digital and Analog Cabled Systems, vol. 1. no.2, pp. 77-86. April-June 1988.I. Cidon, I. Gopal, P. M. Gopal, R. GuC?rin, J.Janniello, and M. Kaplan, "The plaNET/ORBITHi Speed Network," I B M Research Re ort, no.R p 1 8 2 7 0 , August 1992. (Available {om theauthors).I. Cidon, I. Gopal, G. Grover, and M. Sidi," R e a l - T i e Packet Switching: A PerformanceAnalysis," IEEE J. Select. Areas Commun., vol.SAC-6, no. 9, pp. 1576-1586, December 1988.D. Clark, B. Davie, D. Farber, I. Gopal, B.Kadaba, D. Sincoskie, J. Smith, and D.Tennenhouse, "The AURORA Gigabit Testbed."Computer Networks and ISDN, 1991.1. Gopal and R. Gukin, "Network Trans arency:The laNET Approach," Proc. INFOPOM92,pp. 580-601, Florence, Italy, May 1992.L. Kleinrock, Queueing Systems, vol. I : Theory,New York, John Wiley & Sons, 1975.[13"Special Issue on Asynchronous Transfer Mode,"Int. J. Digital and Analog Cabled Systems, vol.1 , no. 4, 1988.[2]"Draft - General B-ISDN Aspects," CCITTStudy Group X V I I I , Report R 34, June 1990.M. Naghshineh and R. A. Gu(rrin, "Fixed VersusVariable Packet Sizes in Fast Packet-Switched,''IBM Research Report, 1992.[3]J.-Y. Le Boudec, "The Asynchronous TransferMode: A Tutorial," IBM Research Report, no.RZ 2133, May 1991.S. Parekh and K. Sohraby, "Some PerformanceTrade-offs Associated With ATM Fixed-Lengthvs Variable-Length Cell Formats," Proc. ICC'88,November 1988.--[nOn-Off SourceNetworkN SourcesFLCNetworkFigure 1.Network Simulation ModelFigure 2. Frame Loss Simulation Model2c.2.72231
miIIIIIII1IVorlable Length Pockets.-.Fixes Size Celloxi\ i .1-.".I4. .""".".c -mE-IIIIIIIIIFigure 3. Network Overhead as A Function of Average Frame SizeLink Vlil.i?- 0.727VLP: tint Uti1:; - 0.659nk Utll.-0.521VCP: Unk Utll.',AM:Unk Utll.bllrrFigure 4.- 0.332Sn In KUaImpact of Link Utilization2c.2.8224-0.467L
Pcmk Rmte-16 ybpp, Rour hhk UtU.- 0.66, SouroeTal .oxnVtU.- 0.6, 10 Smmvurrmu.-.-ATMVLPFigure 5.Impact of Frame Size, Header and Padding Bits OverheadPeak Rote-18 Y b s , T o n-1 mea.M-aiFigure 6. Impact of Source Utilization2c.2.91225
EId-IIIIIIII-Vorlable Slze Packets-. Fixed Size Pocke
This yields [ll] a delay (including the service time) for this first packet of the form Wl P/P(l - P) Pl/S (W1 P/2P(l - P) Pl/S), where 1/p is the average service time of a packet ( l/p PIS, with P the average network packet size and S the speed of a network link) and Pl is the size of the first packet in the ON period. .


![FIPS 140-2 Non-Proprietary Security Policy Acme Packet 1100 [1] and .](/img/49/140sp3490-5601486.jpg)