Transcription
PERFORMANCE EXCELLENCEIN THE WOOD PRODUCTS INDUSTRYEM 8720-EOctober 1998 3.00Using the Simplex Method to Solve LinearProgramming Maximization ProblemsJ. Reeb and S. LeavengoodA key problem faced by managers is how to allocate scarce resourcesamong activities or projects. Linear programming, or LP, is a method ofallocating resources in an optimal way. It is one of the most widely usedoperations research (OR) tools. It has been used successfully as a decisionmaking aid in almost all industries, and in financial and service organizations.Programming refers to mathematical programming. In this context, itrefers to a planning process that allocates resources—labor, materials,machines, and capital—in the best possible (optimal) way so that costs areminimized or profits are maximized. In LP, these resources are known asdecision variables. The criterion for selecting the bestAbout this seriesvalues of the decision variAccording to the Operations Research Society ofables (e.g., to maximize profitsAmerica,“Operations research [OR] is concerned withor minimize costs) is known asscientifically deciding how to best design and operatethe objective function. Theman-machine systems, usually under conditionslimitations on resource availrequiring the allocation of scarce resources.”ability form what is known asThis publication, part of a series, should be usefula constraint set.for supervisors, lead people, middle managers, andFor example, let’s say aanyone who has planning responsibility for either afurniture manufacturer prosingle manufacturing facility or for corporate planningduces wooden tables andover multiple facilities. Although managers andchairs. Unit profit for tables isplanners in other industries can learn about OR 6, and unit profit for chairs istechniques through this series, practical examples are 8. To simplify our discussion,geared toward the wood products industry.let’s assume the only tworesources the company uses toproduce tables and chairs are wood (board feet) and labor (hours). It takes30 bf and 5 hours to make a table, and 20 bf and 10 hours to make a chair.James E. Reeb, Extension forest products manufacturing specialist; and Scott Leavengood, Extensionagent, Klamath County; Oregon State University.
OPERATIONS RESEARCHDecision variables. . .“The resourcesavailable.”Constraint set. . .“The limitations onresource availability.”Objective function. . .“The criterion forselecting the bestvalues of the decisionvariables.”2There are 300 bf of wood available and 110 hours of labor available. The company wishes to maximize profit, so profit maximization becomes the objective function. The resources (wood andlabor) are the decision variables. The limitations on resourceavailability (300 bf of wood and 110 hours of labor) form theconstraint set, or operating rules that govern the process. Using LP,management can decide how to allocate the limited resources tomaximize profits.The “linear” part of the name refers to the following: The objective function (i.e., maximization or minimization) canbe described by a linear function of the decision variables, thatis, a mathematical function involving only the first powers of thevariables with no cross products. For example, 23X2 and 4X16 arevalid decision variable terms, while 23X22, 4X163, and (4X1 * 2X1)are not. The entire problem can be expressed as straight lines,planes, or similar geometrical figures. The constraint set can be expressed as a set of linear equations.In addition to the linear requirements, nonnegativity conditionsstate that the variables cannot assume negative values. It is notpossible to have negative resources. Without these conditions, itwould be mathematically possible to use more resources than areavailable.In EM 8719, Using the Graphical Method to Solve LinearPrograms, we use the graphical method to solve an LP probleminvolving resource allocation and profit maximization for a furniture manufacturer. In that example, there were only two variables(wood and labor), which made it possible to solve the problemgraphically.Problems with three variables also can be graphed, but threedimensional graphs quickly become cumbersome. Problems withmore than three variables cannot be graphed. Most real-worldproblems contain numerous objective criteria and resources, sothey’re too complicated to represent with only two or three variables. Thus, for all practical purposes, the graphical method forsolving LP problems is used only to help students better understand how other LP solution procedures work.This publication will build on the example of the furniturecompany by introducing a way to solve a more complex LP problem. The method we will use is the simplex method.
SIMPLEX METHODOverview of the simplex methodThe simplex method is the most common way to solve large LPproblems. Simplex is a mathematical term. In one dimension, asimplex is a line segment connecting two points. In two dimensions, a simplex is a triangle formed by joining the points. A threedimensional simplex is a four-sided pyramid having four corners.The underlying concepts are geometrical, but the solution algorithm, developed by George Dantzig in 1947, is an algebraicprocedure.As with the graphical method, the simplex method finds themost attractive corner of the feasible region to solve the LP problem. Remember, any LP problem having a solution must have anoptimal solution that corresponds to a corner, although there maybe multiple or alternative optimal solutions.Simplex usually starts at the corner that represents doing nothing. It moves to the neighboring corner that best improves thesolution. It does this over and over again, making the greatestpossible improvement each time. When no more improvementscan be made, the most attractive corner corresponding to theoptimal solution has been found.A moderately sized LP with 10 products and 10 resource constraints would involve nearly 200,000 corners. An LP problem10 times this size would have more than a trillion corners. Fortunately, the search procedure for the simplex method is efficientenough that only about 20 of the 200,000 corners are searched tofind the optimal solution.In the real world, computer software is used to solve LP problems using the simplex method, but you will better understand theresults if you understand how the simplex method works. Theexample in this publication will help you do so.PROFITSReview of the graphical methodFirst, let’s quickly review the graphical procedure for solving anLP problem, which is presented in EM 8719, Using the GraphicalMethod to Solve Linear Programs. Let’s say a furniture manufacturer wishes to maximize profit. Information about availableresources (board feet of wood and hours of labor) and the objective criterion is presented in Table 1. For a complete, step-by-stepreview of the graphical method, see EM 8719 or one of the textbooks listed in the “For more information” section.3
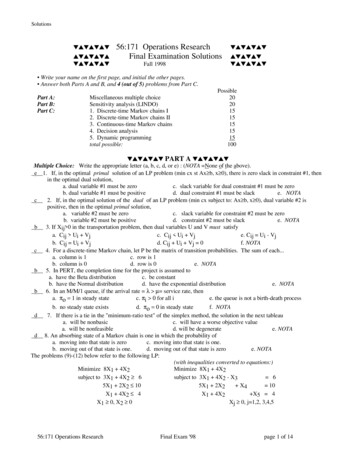
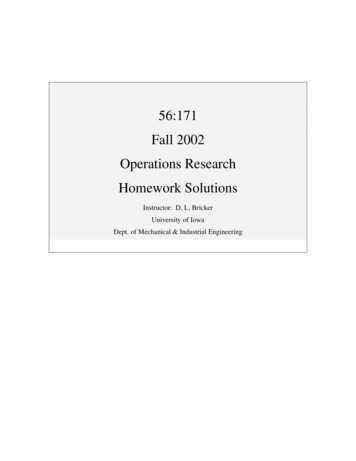
OPERATIONS RESEARCHTip . .In our example,X1 refers to tables,X2 refers to chairs, andZ refers to profit.Table 1.—Information for the wooden tables and chairs linear programmingproblem.ResourceWood (bf)Labor (hr)Table (X1)305Chair (X2)2010Unit profit 6 8Available300110Maximize:Z 6X1 8X2(objective function)Subject to:30X1 20X2 300(wood constraint: 300 bf available)5X1 10X2 110(labor constraint: 110 hours available)X1, X2 0(nonnegativity conditions)Based on the above information, graphically solve the LP(Figure 1). Graph the two constraint equation lines. Then plot twoobjective function lines by arbitrarily setting Z 48 and Z 72 tofind the direction to move to determine the most attractive corner.The coordinates for the most attractive corner (where the wood andlabor constraint equations intersect) can be found by simultaneously solving the constraint equations with two unknowns.ChairsWoodLaborFeasibleregionTablesFigure 1.—Determining the most attractive corner corresponding to the optimalsolution.4
SIMPLEX METHODTo simultaneously solve the two constraint equations, firstmultiply the labor equation by -2, and add it to the wood equation:30X1 20X2 300 (wood)-2(5X1 10X2 110) (labor)20X1 0X1 80 4 tablesNext, substitute into either of the constraint equations to find thenumber of chairs. We can substitute into both equations to illustratethat the same value is found.Wood constraintLabor constraint30(4) 20X2 3005(4) 10X2 110120 20X2 30020 10X2 11020X2 300 - 12010X2 110 - 2020X2 18010X2 90X2 180/20X2 90/10X2 9 chairsX2 9 chairsNow, determine the value of the objective function for theoptimal solution. Substitute into the equation the number of tablesand chairs, and solve for Z.Z 6(4) 8(9) 96The optimal solution is to manufacture four tables and ninechairs for a profit of 96.5
OPERATIONS RESEARCHUsing the simplex methodBy introducing the idea of slack variables (unused resources) tothe tables and chairs problem, we can add two more variables tothe problem. With four variables, we can’t solve the LP problemgraphically. We’ll need to use the simplex method to solve thismore complex problem.We’ll briefly present the steps involved in using the simplexmethod before working through an example. Table 2 shows anexample of a simplex tableau. Although these steps will give you ageneral overview of the procedure, you’ll probably find that theybecome much more understandable as you work through theexample.A list of shortcuts is found on page 23. You can refer to the sixsteps and shortcuts while working through the example.Step 1. Formulate the LP and construct a simplex tableau. Addslack variables to represent unused resources, thus eliminatinginequality constraints. Construct the simplex tableau—a table thatallows you to evaluate various combinations of resources todetermine which mix will most improve your solution. Use theslack variables in the starting basic variable mix.Step 2. Find the sacrifice and improvement rows. Values in thesacrifice row indicate what will be lost in per-unit profit by makinga change in the resource allocation mix. Values in the improvementrow indicate what will be gained in per-unit profit by making achange.Table 2.—Example of a simplex tableau.Unitprofit68000Basic crificeImprovement600 Current profit—
SIMPLEX METHODStep 3. Apply the entry criteria. Find the entering variable andmark the top of its column with an arrow pointing down. Theentering variable is defined as the current non-basic variable thatwill most improve the objective if its value is increased from 0. Ifties occur, arbitrarily choose one as the entering variable. When noimprovement can be found, the optimal solution is represented bythe current tableau.If no positive number appears in the entering variable’s column,this indicates that one or more constraints are unbounded. Since itis impossible to have an unlimited supply of a resource, anunbounded solution indicates that the LP problem was formulatedincorrectly.Step 4. Apply the exit criteria. Using the current tableau’sexchange coefficient from the entering variable column, calculatethe following exchange ratio for each row as:Solution value/Exchange coefficientThe exchange ratio tells you which variable is the limitingresource, i.e., the resource that would run out first.Find the lowest nonzero and nonnegative value. This variable isthe limiting resource. The basic variable in this row becomes theexiting variable. In case of identical alternatives, arbitrarily chooseone. Mark the exiting variable row with an arrow pointing left.Step 5. Construct a new simplex tableau. Constructing a newtableau is a way to evaluate a new corner. One variable will enterthe basic mix (entering variable), and one variable will leave thebasic mix and become a non-basic variable (exiting variable). Theoperation of an entering variable and an exiting variable is called apivot operation. The simplex method is made up of a sequence ofsuch pivots. The pivot identifies the next corner to be evaluated.The new basic mix always differs from the previous basic mix byone variable (exiting variable being replaced by the enteringvariable).To construct the new tableau, replace the exiting variable in thebasic mix column with the new entering variable. Other basic mixvariables remain unchanged. Change the unit profit or unit losscolumn with the value for the new entering variable. Compute thenew row values to obtain a new set of exchange coefficientsapplicable to each basic variable.Step 6. Repeat steps 2 through 5 until you no longer can improvethe solution.7
OPERATIONS RESEARCHSlack variables. . .“A mathematicalrepresentation ofsurplus resources.” Inreal-life problems, it’sunlikely that allresources will be usedcompletely, so thereusually are unusedresources.A simplex method example:Production of wooden tables and chairsStep 1. Formulate the LP and constructa simplex tableau.From the information in Table 3, we can formulate the LPproblem as before.Table 3.—Information for the wooden tables and chairs linear programmingproblem.ResourceWood (bf)Labor (hr)Table (X1)305Chair (X2)2010Unit profit 6 8Available300110Maximize:Z 6X1 8X2(objective function)Subject to:30X1 20X2 300(wood constraint: 300 bf available)5X1 10X2 110(labor constraint: 110 hours available)X1, X2 0(nonnegativity conditions)Slack variablesUsing the simplex method, the first step is to recognize surplusresources, represented in the problem as slack variables. In mostreal-life problems, it’s unlikely that all resources (usually a largemix of many different resources) will be used completely. Whilesome might be used completely, others will have some unusedcapacity. Also, slack variables allow us to change the inequalitiesin the constraint equations to equalities, which are easier to solvealgebraically. Slack variables represent the unused resourcesbetween the left-hand side and right-hand side of each inequality;in oth
operations research (OR) tools. It has been used successfully as a decision-making aid in almost all industries, and in financial and service organiza-tions. Programming refers to mathematical programming. In this context, it refers to a planning process that allocates resources—labor, materials, machines, and capital—in the best possible (optimal) way so that costs are minimized or .